
A note on lower timeframe confirming price action…
Waiting for lower timeframe confirmation is our main tool to confirm strength within higher timeframe zones, and has really been the key to our trading success. It takes a little time to understand the subtle nuances, however, as each trade is never the same, but once you master the rhythm so to speak, you will be saved from countless unnecessary losing trades. The following is a list of what we look for:
- A break/retest of supply or demand dependent on which way you’re trading.
- A trendline break/retest.
- Buying/selling tails … essentially we look for a cluster of very obvious spikes off of lower timeframe support and resistance levels within the higher timeframe zone.
- Candlestick patterns. We tend to only stick with pin bars and engulfing bars as these have proven to be the most effective.
We typically search for lower-timeframe confirmation between the M15 and H1 timeframes, since most of our higher-timeframe areas begin with the H4. Stops are usually placed 1-3 pips beyond confirming structures.
EUR/USD
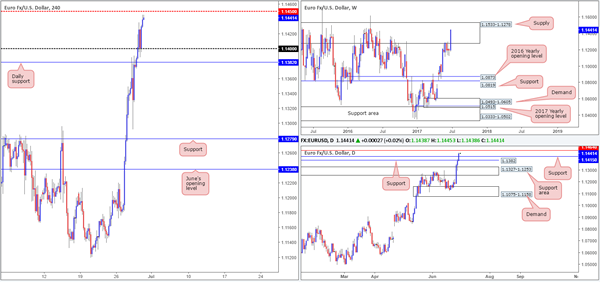
The single currency, as you can see, continued to advance during yesterday’s segment. Shaped by three near-full-bodied daily bullish candles, price is seen driving deeper into the upper limits of a major weekly supply at 1.1533-1.1278. On the daily timeframe, the unit is currently trading within touching distance of a major Quasimodo resistance level coming in at 1.1464.
Looking over to the H4 timeframe, it’s clear to see that the 1.14 handle provided support and lifted price up to just ahead of the mid-level resistance at 1.1450 going into the close. 34 pips above this number sits a supply area drawn from 1.1529-1.1484, which along with the daily Quasimodo resistance level mentioned above at 1.1464, is the last remaining areas of structure within the aforementioned weekly supply.
Our suggestions: Although we believe the bears will react to the H4 supply area should the candles connect today, we’re a tad wary of shorting given the bullish strength displayed over the past three days. With that in mind, our desk will humbly take a back seat and reassess price action going into the new month.
Data points to consider: German Retail sales figures at 7am, EUR CPI flash estimate at 10am. US Core PCE price index report at 1.30pm, followed by Chicago PMI at 2.45pm GMT+1.
Levels to watch/live orders:
- Buys: Flat (stop loss: N/A).
- Sells: Flat (stop loss: N/A).
GBP/USD:
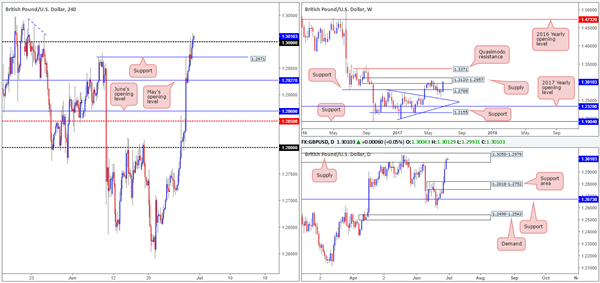
The GBP/USD is an interesting market at the moment, especially from a technical standpoint. The H4 timeframe shows that price recently crossed the large psychological boundary 1.30, which, as you can see, is currently being retested as support. To the left of current price, notice that we have drawn a mini down trendline. This is to represent what we believe to be consumed supply i.e. no active supply. So, with this, we should expect the pair to continue northbound? If only it were that easy!
On the bigger picture we have a weekly supply area at 1.3120-1.2957, and a partner supply seen on the daily timeframe at 1.3058-1.2979 in play right now. Therefore, although H4 price is showing potential to the upside, one has to remain cognizant of the surrounding environment.
Our suggestions: While a long is tempting from the 1.30 region today, we are going to hold fire. Buying into higher-timeframe supplies usually ends in tears!
Data points to consider: UK current account figures at 9.30am. US Core PCE price index report at 1.30pm, followed by Chicago PMI at 2.45pm GMT+1.
Levels to watch/live orders:
- Buys: Flat (stop loss: N/A).
- Sells: Flat (stop loss: N/A).
AUD/USD
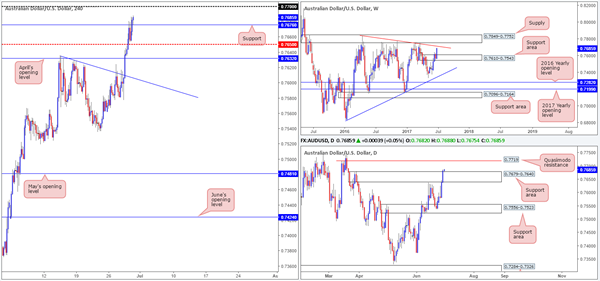
In recent trading, the AUD/USD pushed higher for a second consecutive day, breaking through a H4 resistance at 0.7676 which is now being retested as support. The next upside target from this number is the 0.77 handle. While the bulls are displaying clear strength at the moment, there could be trouble ahead!
The weekly timeframe clearly shows the bulls heading into an oncoming trendline resistance extended from the high 0.7835. In addition to this, the daily timeframe reveals that a Quasimodo left shoulder at 0.7719 intersects beautifully with the said weekly trendline! Couple this with the nearby 0.77 psychological boundary and we have a feasible sell zone at hand.
Our suggestions: Basically, we will be watching the behavior of H4 price action once/if it connects with the 0.7719/0.77 area. Should a reasonably sized H4 bearish candle form within the walls of this zone, preferably in the shape of a full-bodied candle, then our team would certainly consider shorts and target H4 support at 0.7676 as an initial take-profit zone.
Data points to consider: Chinese manufacturing PMI at 2am. US Core PCE price index report at 1.30pm, followed by Chicago PMI at 2.45pm GMT+1.
Levels to watch/live orders:
- Buys: Flat (stop loss: N/A).
- Sells: 0.7719/0.77 ([waiting for a reasonably sized H4 bear candle – preferably a full-bodied candle – to form before pulling the trigger is advised] stop loss: ideally beyond the candle’s wick).
USD/JPY:
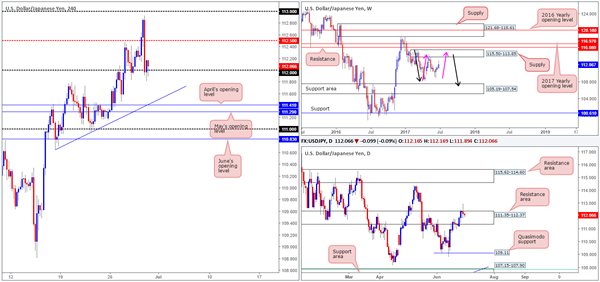
Along with the US equity market, the USD/JPY also tumbled lower going into the early hours of yesterday’s US segment. This, as you can see on the daily timeframe, has possibly saved the resistance area at 111.35-112.37, which remains intact despite suffering an aggressive whipsaw.
While daily bears appear to have gained some traction, the H4 candles are currently seen testing the 112 handle. A break beyond this number could lead to a move down to April’s opening level at 111.41, shadowed closely by May’s opening level at 111.29. Note also that these monthly levels converge with a trendline support etched from the low 110.64.
Our suggestions: A close below 112, followed by a retest and a lower-timeframe sell signal (see the top of this report) could be something to consider today, targeting the said H4 monthly levels. Buying from these barriers, however, even though it boasts trendline confluence, is risky given the position of daily price at the moment. So, as much as we’d like to long from here, we’ll pass.
Data points to consider: US Core PCE price index report at 1.30pm, followed by Chicago PMI at 2.45pm GMT+1.
Levels to watch/live orders:
- Buys: Flat (stop loss: N/A).
- Sells: Watch for H4 price to engulf 112 and then look to trade any retest seen thereafter ([waiting for a lower-timeframe sell signal to form following the retest is advised] stop loss: dependent on where one confirms this level).
USD/CAD
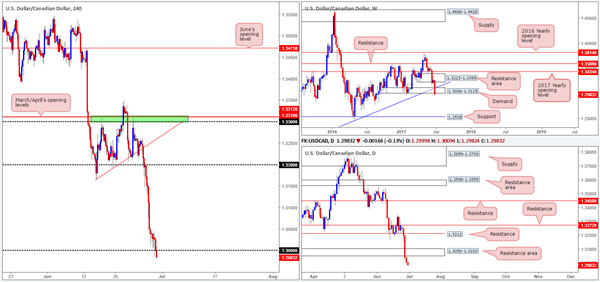
During the course of yesterday’s sessions, H4 price challenged the 1.30 region and for the best part, held firm. However, in recent hours the unit has broken lower and is now trading at 1.2989. Beyond the 1.30 boundary, the next area of interest is a H4 demand base pegged at 1.2910-1.2923.
Moving over to the daily timeframe, we see little active demand in this market until we reach 1.2822-1.2883. On the weekly timeframe, however, the path south currently looks free all the way down to support coming in at 1.2538!
Our suggestions: When all three timeframes are trading in unison, our job is easy: follow the flow! Should H4 price close below 1.30 and then retest the underside of this number as resistance, as well as print a H4 bearish candle (preferably a full-bodied candle), we would have no hesitation in shorting this market, targeting the aforementioned H4 demand, and quite possibly much lower.
Data points to consider: US Core PCE price index report at 1.30pm, followed by Chicago PMI at 2.45pm. Canadian GDP m/m data at 1.30pm GMT+1.
Levels to watch/live orders:
- Buys: Flat (Stop loss: N/A).
- Sells: Watch for H4 price to engulf 1.30 and then look to trade any retest seen thereafter ([waiting for a H4 bearish candle to form following the retest is advised] stop loss: ideally beyond the candle’s wick).
USD/CHF
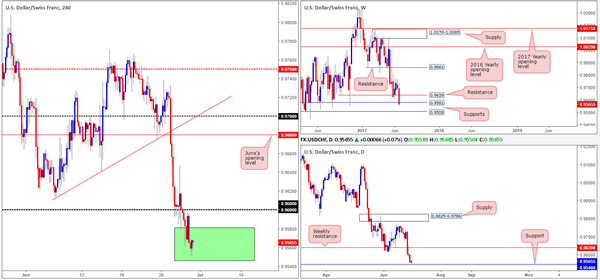
As highlighted in Thursday’s report, the 0.9546/0.9581 green area painted on the H4 chart, which is comprised of weekly and daily support levels, continues to be a zone our desk favors for potential longs. However, what we also made clear was that in order to confirm buyer intent within the walls of this zone, a H4 bullish rotation candle in the shape of a full or near-full-bodied candle is needed.
As you can see from the H4 chart, a H4 bullish candle that closed near its highs was just recently penciled in. This, to us, is a valid buy signal, with the likelihood of price now rallying up to at least the 0.96 handle.
Our suggestions: Based on the notes above, our desk has entered long at 0.9567, with a stop positioned below the daily support (0.9546) at 0.9544.
Data points to consider: US Core PCE price index report at 1.30pm, followed by Chicago PMI at 2.45pm GMT+1.
Levels to watch/live orders:
- Buys: 0.9567 ([live] stop loss: 0.9544).
- Sells: Flat (stop loss: N/A).
DOW 30:
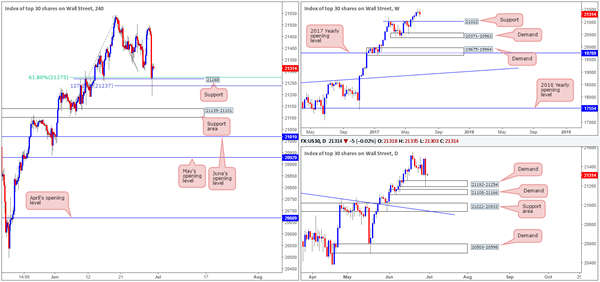
Trade update: long from 21164 was stopped out at 21298 for a handsome profit.
Despite suffering an aggressive whipsaw, the H4 support level coming in at 21268 has managed to remain in the game. We believe this was also likely because of the daily demand area seen below at 21192-21254, and a H4 61.8% Fib support level at 21275 taken from the low 21108 as well as a H4 127.2% Fib ext. point 21237 drawn from the high 21541.
Our suggestions: Following the large H4 bull candle that formed off the current H4 support, our team took another long position in this market at 21323, with the stop-loss order positioned at 21188. Ultimately, we do not have an immediate target, but will certainly be watching closely once/if price connects with the 21492 neighborhood, and possibly reduce risk to breakeven.
Data points to consider: US Core PCE price index report at 1.30pm, followed by Chicago PMI at 2.45pm GMT+1.
Levels to watch/live orders:
- Buys: 21323 ([live] stop loss: 21188).
- Sells: Flat (stop loss: N/A).
GOLD
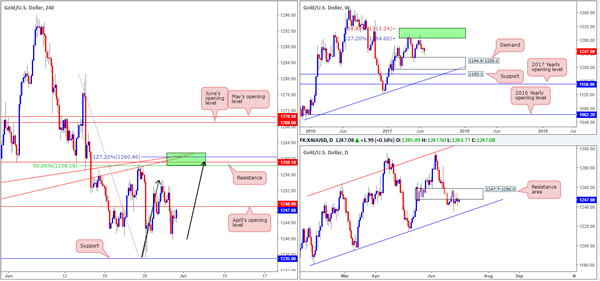
It’s reasonably easy to see who’s been in control on the weekly timeframe over the past few weeks. Since tapping the area comprised of two weekly Fibonacci extensions 161.8/127.2% at 1313.7/1285.2 taken from the low 1188.1 (green zone), the bears have, albeit apart from one week, put on a rather dominant performance. The next downside target in the firing range can be seen at 1194.8-1229.1: a demand zone.
On the other side of the field, however, the daily candles remain trading around a resistance area at 1247.7-1258.8. Yet, before the bears get too excited, the next area of concern can be seen nearby in the form of a channel support extended from the low 1180.4 that intersects with the said weekly demand base.
Yesterday’s action on the H4 timeframe shows that price drove below April’s opening level at 1248.0 and has remained there since. In recent hours, nonetheless, the metal has been seen trading within a few pips of this line and will eventually test this barrier’s strength we believe. Shorting from here is not something we are interested in, since a far more appealing area exists above in green between 1261.4/1258.1.
Our suggestions: Comprised of the following structures, 1261.4/1258.1 is a reasonably strong area for shorts, which could eventually bring the unit all the way down to the top edge of weekly demand at 1229.1:
H4 resistance at 1259.1.
Two H4 trendline resistances taken from lows of 1245.9/1252.9.
H4 50.0% retracement value at 1258.1 taken from the high 1281.1.
H4 AB=CD (black arrows) 127.2% ext. at 1260.4.
Located within the upper limits of a daily resistance area at 1247.7-1258.8.
Levels to watch/live orders:
- Buys: Flat (stop loss: N/A).
- Sells: 1261.4/1258.1 ([waiting for a reasonably sized H4 bear candle – preferably a full-bodied candle – to form before pulling the trigger is advised if you want to help avoid a potential fakeout] stop loss: ideally beyond the candle’s wick)


