
The EUR/USD currency pair
Technical indicators of the currency pair:
Prev Open: 1.10741
Open: 1.10676
% chg. over the last day: -0.05
Day’s range: 1.10549 – 1.10707
52 wk range: 1.0884 – 1.1623
The EUR / USD currency pair continues to show negative dynamics. The demand for greenback remains at a fairly high level. EUR/USD quotes updated the local lows. At the moment, the trading instrument is testing the support level of 1.10550. 1.10750 is already a mirror resistance. The single currency has the potential to further decline. We recommend opening positions from key levels.
The Economic News Feed for 07.11.2019:
Initial Jobless Claims (US) – 15:30 (GMT+2:00);
Pay attention to the speeches by the FOMC representatives
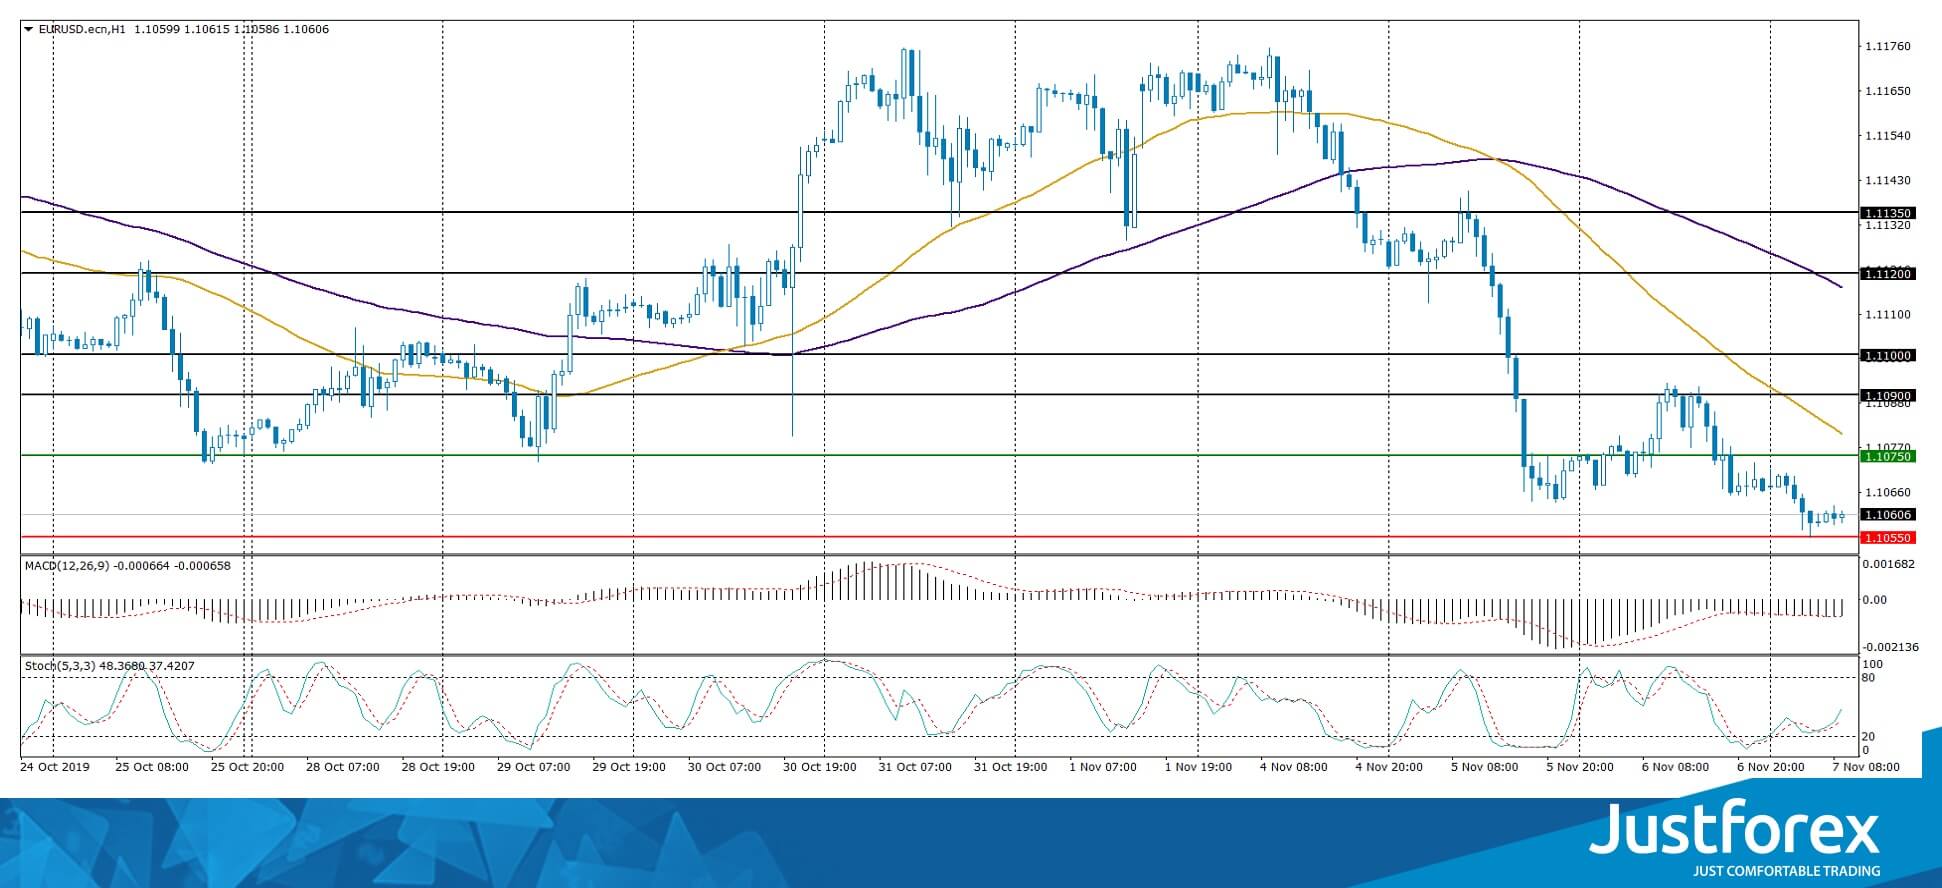
Indicators point to the power of the sellers, the price has fixed below 50 MA and 100 MA.
The MACD histogram is in the negative zone and below the signal line, which gives a strong signal to sell EUR/USD.
The Stochastic Oscillator is in the neutral zone, the %K line is above the %D line, which indicates a bullish sentiment.
Trading recommendations
Support levels: 1.10550, 1.10250, 1.10000
Resistance levels: 1.10750, 1.10900, 1.11200
If the price consolidates below 1.10550, expect a further descend toward 1.11000-1.11200.
Alternatively, the quotes can grow toward 1.11000-1.11200.
The GBP/USD currency pair
Technical indicators of the currency pair:
Prev Open: 1.28835
Open: 1.28528
% chg. over the last day: -0.23
Day’s range: 1.28372 – 1.28598
52 wk range: 1.1959 – 1.3385
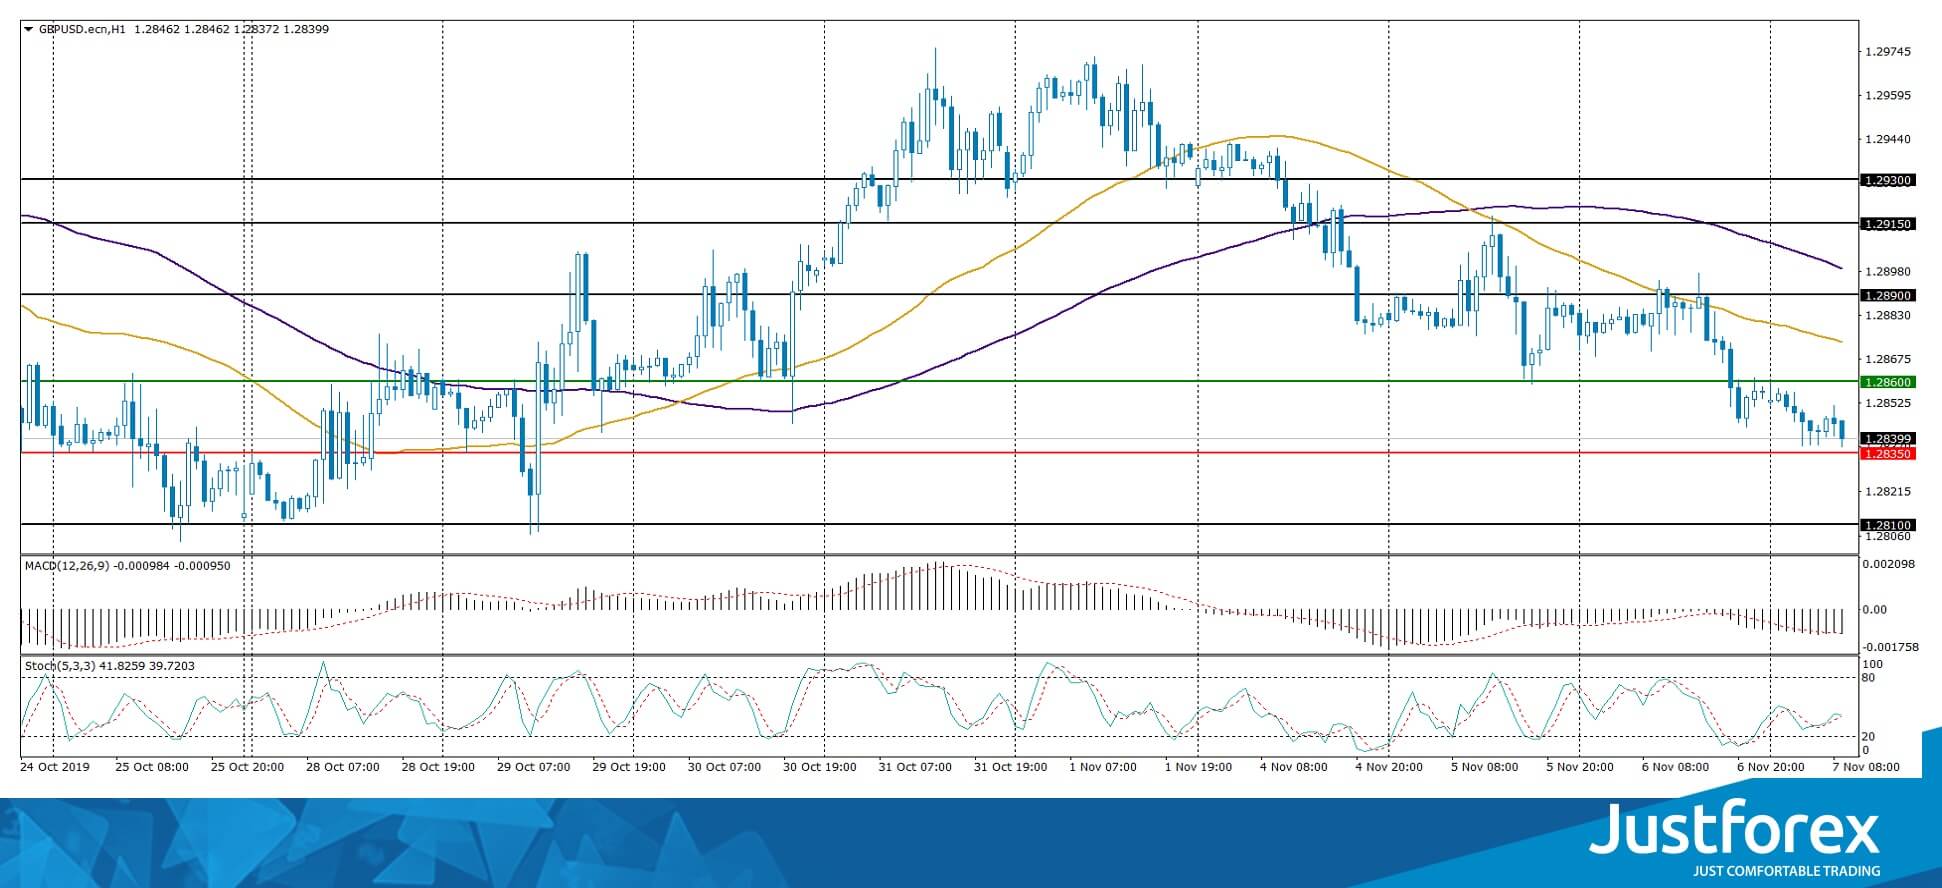
The GBP/USD currency pair is falling before the meeting of the Bank of England. Today, the regulator will announce its decision on a key interest rate. It is expected that the Central Bank will maintain the basic parameters of monetary policy at the same level. At the same time, the Central Bank may signal a decrease in interest rates amid the uncertainty surrounding Brexit. At the moment, GBP/USD quotes are consolidating in the range of 1.28350-1.28600. We recommend opening positions from these marks.
At 14:00 (GMT+2:00) the Bank of England will announce its decision on the key interest rate.

The MACD histogram is in the negative zone and below the signal line, which gives a strong signal to sell GBP / USD.
MACD.
The Stochastic Oscillator is in the neutral zone, the %K line crossed the %D line. There are no signals at the moment.
Trading recommendations
Support levels: 1.28350, 1.28100
Resistance levels: 1.28600, 1.28900, 1.29150
If the price consolidates below 1.28350, expect the further drop toward 1.28000-1.27800.
Alternatively, the quotes could grow toward 1.28800-1.29000.
The USD/CAD currency pair
Technical indicators of the currency pair:
Prev Open: 1.31550
Open: 1.31822
% chg. over the last day: +0.21
Day’s range: 1.31701 – 1.31971
52 wk range: 1.2727 – 1.3664
The USD/CAD currency pair has moved up. The trading tool has reached the key extremes. Pressure on CAD is caused by weak a Canadian PMI report from Ivey. At the moment, USD / CAD quotes are consolidating. The local support and resistance levels are 1.31700 and 1.32000, respectively. The USD / CAD currency pair has the potential for further growth. We recommend paying attention to the dynamics of oil quotes. Open positions from key levels.
The Economic News Feed for 07.11.2019 is calm.
The price fixed above 50 MA and 100 MA, which signals the power of buyers.
The MACD histogram is in the positive zone, but below the signal line, which gives a weak signal to buy USD/CAD.
The Stochastic Oscillator is in the neutral zone, the %K line is below the %D line, which indicates a bearish sentiment.
Trading recommendations
Support levels: 1.31700, 1.31400, 1.31150
Resistance levels: 1.32000, 1.32300, 1.32500
If the price consolidates above the round level of 1.32000, expect further growth toward 1.32300-1.32500.
Alternatively, the quotes could decrease toward 1.31500-1.31300.
The USD/JPY currency pair
Technical indicators of the currency pair:
Prev Open: 109.170
Open: 108.962
% chg. over the last day: +0.22
Day’s range: 108.648 – 109.123
52 wk range: 104.97 – 114.56
The USD/JPY currency pair shows a high trading activity and volatility. A trading instrument tests key highs. Financial market participants continue to monitor the settlement of the trade conflict between Washington and Beijing. At the moment, the local support and resistance levels are 108.800 and 109.100, respectively. We do not exclude further growth of the USD/JPY quotes. Open positions from the key levels.
The Economic News Feed for 07.11.2019 is calm.
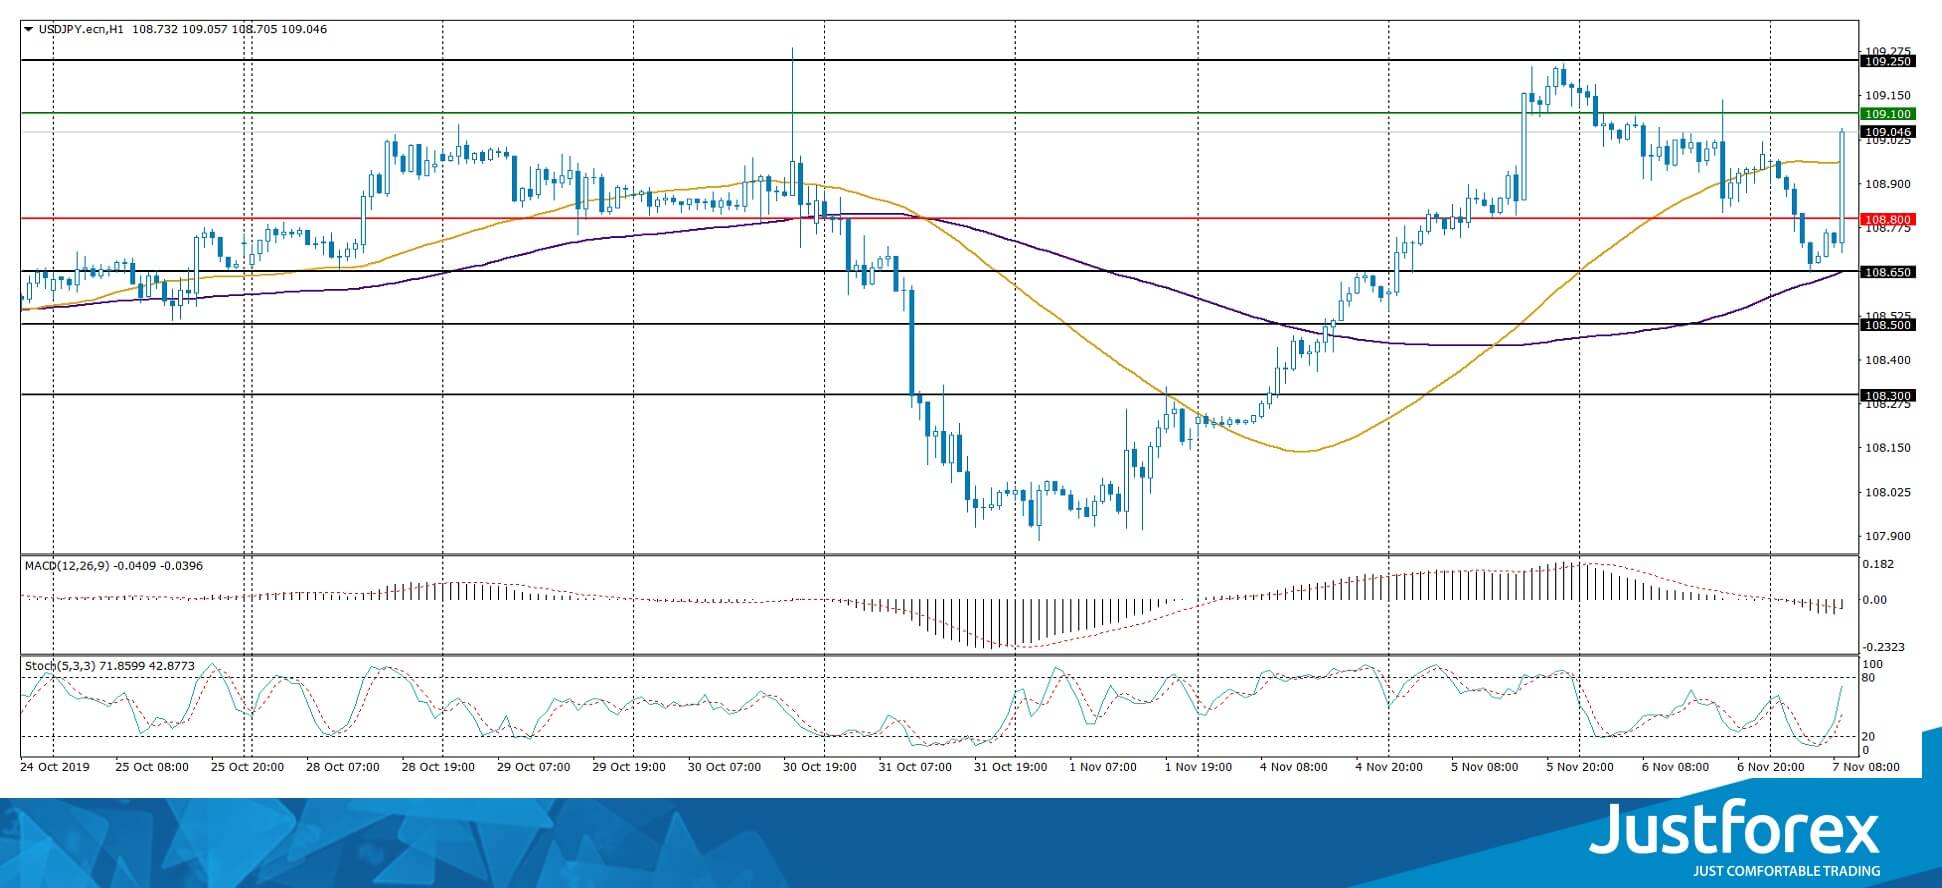
Indicators do not give accurate signals: the price crossed 50 MA and 100 MA.
The MACD histogram is in the negative zone, but above the signal line, which gives a weak signal to sell USD/JPY.
The Stochastic Oscillator is in the neutral zone, the %K line is above the %D line, which indicates bullish sentiment.
Trading recommendations
Support levels: 108.800, 108.650, 108.500
Resistance levels: 109.100, 109.250, 109.500
If the price consolidates above 109.100, expect further growth toward 109.400-109.600.
Alternatively, the quotes could descend toward 108.600-108.400.


