
Early in another November week, the oil market is going down againб but it is evident that investors just can’t decide on a more promising direction on a global scale. Currently, Brent is trading at 61.81 USD.
The statistics published by Baker Hughes last Friday showed that the Oil Rig Count in the USA reached the lowest level over the previous 31 months: the indicator lost 8 units and now equals to 684. The total number of rigs lost 7 units, down to 817 overall. As a result, the actual reading is close to April of 2017. Since the beginning of 2019, the indicator has dropped 23%, but without influencing the total oil extraction as it has added 8% over the same period.
The latest numbers showed that the daily oil output in the USA stopped at 12.6M. The EIA Crude Oil Stocks Change is increasing (+8M barrels over a week by November 8th).
All fine and dandy, and the reason for oil stocks growth can be easily explained by seasonality, but market players are anxious as they continue following the trade conflict between the USA and China. Earlier, US President Donald Trump said that he wasn’t ready yet to consider the possibility of completely removing import tariffs on Chinese goods introduced in the past.
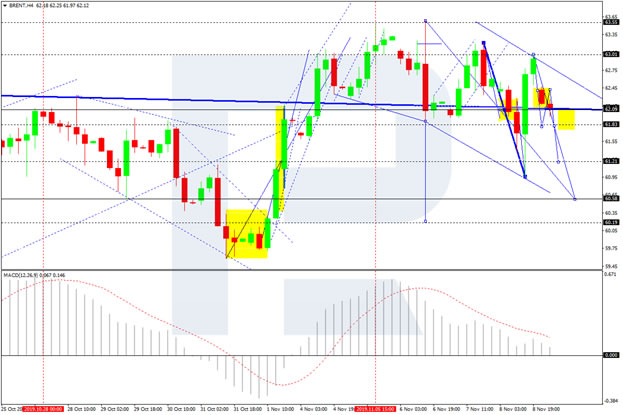
As we can see in the H4 chart, Brent is forming the fifth structure of Flag correctional pattern. Today, the pair may fall to break 61.83 and then continue trading downwards with the target at 60.60 to complete the correction. After that, the instrument may form a reversal pattern for one more ascending structure towards 64.40. However, the “correction” scenario may no longer be valid if the price grows to break 63.00. in this case, the market may resume trading inside the uptrend to reach 64.40б at least. From the technical point of view, this scenario is confirmed by MACD Oscillator: its signal line is moving downwards to reach 0. Breaking it may boost the downtrend.
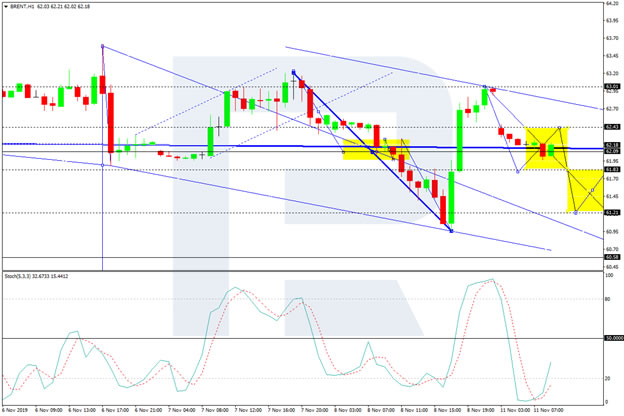
In the H1 chart, Brent is consolidating around 62.10. Possibly, today the pair may form a new descending structure towards 61.83 and then start another growth to reach 62.43. After that, the instrument may fall to reach 61.21, thus forming a wider consolidation range between 62.43 and 61.21. If later the pair breaks this range to the downside, the instrument may continue falling towards 60.60; if to the upside – cancel the correction. From the technical point of view, this scenario is confirmed by Stochastic Oscillator: its signal line is moving below 50. Practically, the indicator suggests that the instrument is moving in the middle of the fifth correctional structure. The indicator is expected to start another decline to enter the “oversold area” below 20.


