
Risk sentiment remained broadly stable on Thursday as US equity futures edged higher alongside European stocks, extending the optimistic tone already dominating global markets this week. But while equities continued drifting along the existing AI- and liquidity-driven rally, oil markets delivered a far more cautious verdict on the opening phase of the Trump-Xi summit in Beijing.
The key issue remains the Strait of Hormuz. Following talks between President Donald Trump and Chinese President Xi Jinping, the White House stated that both leaders agreed “the Strait of Hormuz must remain open to support the free flow of energy.” According to Washington, Xi also expressed opposition to “the militarization of the strait and any effort to charge a toll for its use,” while both sides reaffirmed that “Iran can never have a nuclear weapon.”
However, the Chinese side delivered a far more restrained public statement. China’s Foreign Ministry merely stated that the two leaders “exchanged views on major international and regional issues, such as the Middle East situation, the Ukraine crisis, and the Korean Peninsula,” without explicitly referencing Hormuz, Iran, maritime security, or energy flows.
That discrepancy appears to have prevented energy traders from embracing the summit as a meaningful geopolitical breakthrough. Brent crude dipped modestly below $105 but remained elevated overall, suggesting markets still see substantial war premium embedded in oil prices. If investors truly believed the Strait of Hormuz was on a credible path toward normalization, oil prices would likely be falling much more aggressively.
Equity investors are still willing to maintain the broader risk-on narrative supported by AI optimism and resilient global liquidity conditions. But oil traders continue signaling that the underlying geopolitical crisis has not actually been resolved. As long as the threat of partial blockage, tanker disruption, or Iranian “toll” measures remains alive, the war premium is unlikely to disappear from energy markets.
The concern now is that if diplomacy fails to deliver more concrete progress during the second day of talks, Washington could eventually pivot back toward a harder security response. Without operational guarantees on shipping access, the US may eventually return to naval escort operations or even military strike preparation to force the Strait open.
In currency markets, Dollar regained the top position for the week as stronger US inflation data continued supporting expectations for higher-for-longer Fed policy. Aussie remained the second strongest performer thanks to resilient risk appetite, while Loonie benefited from still-elevated crude prices. Sterling remained the weakest major currency amid continuing UK political instability, followed by Yen and Euro.
GBP/AUD Sinks to 1½-Year Lows as Aussie Risk Rally Meets UK Political Paralysis
GBP/AUD fell to fresh 2½-year lows as markets increasingly favored Australia’s growth-and-yield story over Britain’s rising political uncertainty. AI-driven risk appetite, hawkish RBA expectations, and Sterling’s growing political discount continue reinforcing the pair’s bearish trend. Read More.
Silver’s Momentum Stalls Below $90, but Bigger Breakout Risks Are Building
Silver momentum slowed near $90, but narrowing Gold-Silver Ratio and strong industrial demand continue building the case for a larger breakout toward $100. Read More.
US Retail Sales Rise 0.5% in April, Reinforcing Resilient Demand
US retail sales rose 0.5% in April while core spending measures came in stronger than expected, reinforcing the view that consumer demand remains resilient despite elevated inflation and higher interest rates. Read More.
US initial jobless claims rise to 211k vs exp 205k
US jobless claims rose slightly above expectations last week, suggesting the labor market is gradually cooling but still remains relatively resilient overall. The data is unlikely to shift the Fed’s focus away from persistent inflation risks for now. Read More.
UK GDP Expands 0.6% in Q1, up 0.3% in March
Britain’s economy held up better than expected in early 2026 as stronger services and construction activity lifted both quarterly and monthly GDP growth. The figures offer some reassurance for policymakers even as rising energy costs and political instability continue clouding the outlook. Read More.
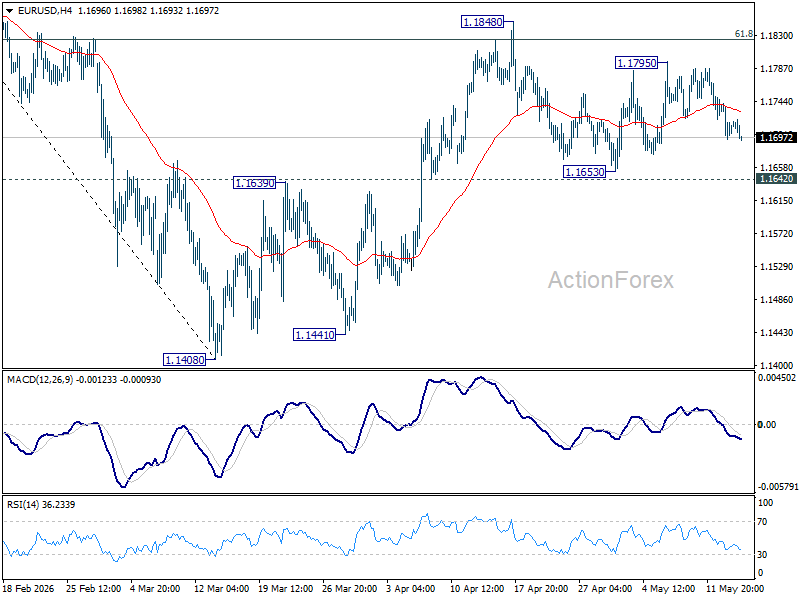
EUR/USD Mid-Day Outlook
Daily Pivots: (S1) 1.1688; (P) 1.1714; (R1) 1.1734; More….
EUR/USD dips slightly today but stays in established range. Intraday bias remains neutral for the moment. Further rise is expected with 1.1642 support intact. On the upside, firm break of 1.1848 will target 1.2081 high next. However, firm break of 1.1662 support will indicate the the rebound from 1.1408 has completed, and bring deeper decline back towards this low instead.
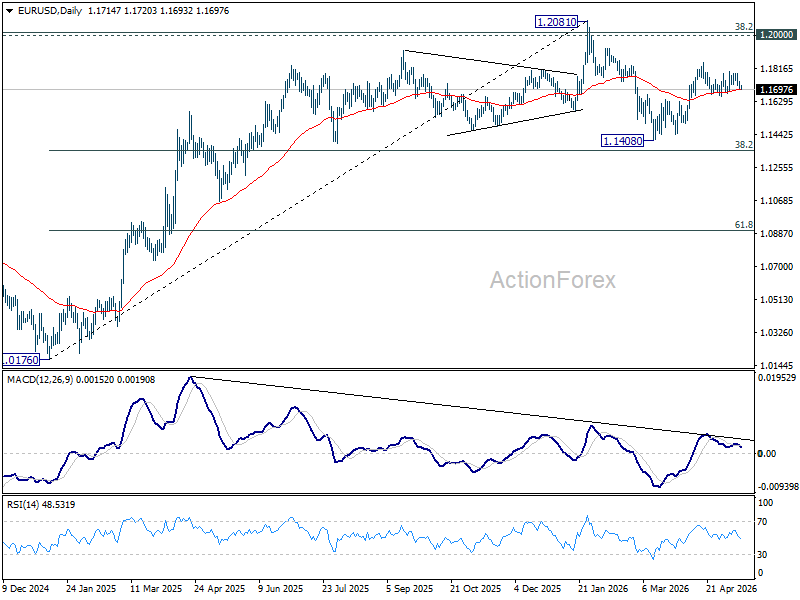
In the bigger picture, the strong support from 38.2% retracement of 1.0176 to 1.2081 at 1.1353 suggests that the pullback from 1.2081 is more likely a corrective move. Strong support was also found in 55 W EMA (now at 1.1539). Focus is back on 1.2 key cluster resistance level. Decisive break there will carry long term bullish implications. Nevertheless, break of 1.1408 support will revive the case of medium term bearish trend reversal.


