EUR/USD
The dollar advanced against all of its major rivals, again receiving a vote of confidence from European investors, which sent the EUR/USD pair down to 1.1311. Most of the common currency’s daily decline can be attributed to ECB’s Executive Board member Benoit Coeure, who said that the governing council hasn’t discussed policy changes, pouring cold water over expectations of soon-to-come tapering. The greenback retreated modestly early US session, as investors turned cautious ahead of the minutes of the Federal Reserve June meeting. The greenback ticked lower as an initial reaction to the release, but turned back higher afterwards, with the EUR/USD pair ending the day around 1.1330. The Minutes showed that policy makers are divided over when to start reducing their balance sheet, whilst most Fed members think that recent softness in inflation have little bearing on inflation trend.
Macroeconomic news coming from the EU were encouraging, but attention remained focused in Central Banks. Nevertheless, the final EU services and composite PMIs for June confirmed that growth remained strong in the region at the end of the second quarter, as the final Markit composite output index came in at 56.3, above the early estimate of 55.7, and only slightly below the six-year record high of 56.8. Growth in the services sector was also revised higher from flash PMIs, while May retail sales for the EUR doubled expectations, up by 0.4% in the month, and by 2.6% when compared to May 2016.
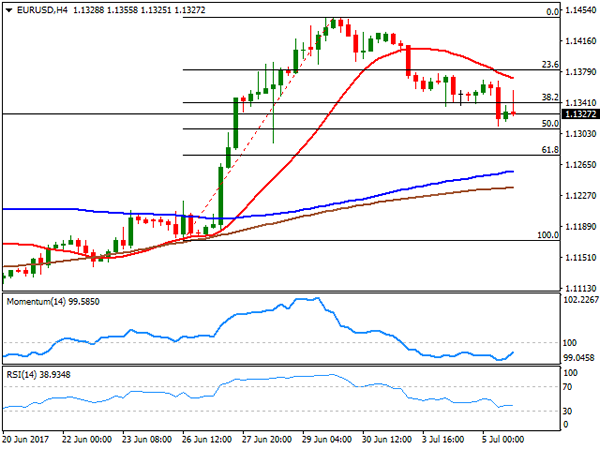
The EUR/USD pair kept retreating after nearing a major long-term resistance last week, the 1.1460 region, but a sustainable slide is not yet clear. Intraday technical readings show that the risk remains towards the upside, as the pair failed to regain the 1.1340 level, the 38.2% retracement of its latest bullish run and now the immediate resistance, whilst the 20 SMA in the 4 hours chart accelerated south above the current level. Technical indicators in the mentioned chart have managed to bounce some, but remain well below their mid-lines. The critical support remains to be 1.1290, June 28th low, with a break below it required to confirm a steeper decline.
Support levels: 1.1290 1.1250 1.1210
Resistance levels: 1.1340 1.1380 1.1420
USD/JPY
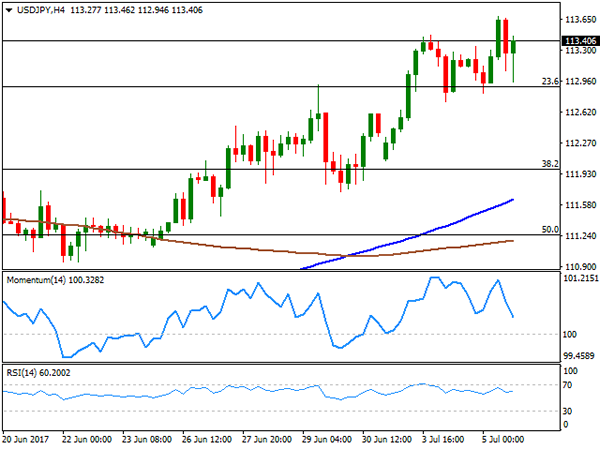
The USD/JPY pair advanced up to 113.68, a new 2-month high early Europe, but retreated from the level as Wall Street turned into the red after the opening, whilst Treasury yields also eased. The release of the latest meeting FOMC Minutes, revived demand for the greenback, with also advancing afterwards and the pair settling in the 113.40 region, as US policy makers showed little concerns over the latest slowdown in inflation, still thinking of it as temporally, with several seeing the balance sheet reduction staring in a couple of months. Earlier on the day, the Japanese services PMI came in stronger-than-expected, up to 53.3 in June from 53.0 in May, although the composite reading slipped from 53.4 to 52.9 in the same month. There are no big news scheduled in the country for the upcoming Asian session. From a technical point of view, the 4 hours chart shows that the pair keeps meeting buying interest on approaches to the 113.00 region, despite the limited upward strength coming from technical indicators, as the Momentum heads lower within positive territory, while the RSI turned marginally higher, but still below previous daily highs. Overall, the pair is poised to extend its advance, although the pair can see little action this Thursday, ahead of the release of the US Nonfarm Payroll report next Friday.
Support levels: 112.95 112.50 112.10
Resistance levels: 113.70 114.05 114.40
GBP/USD
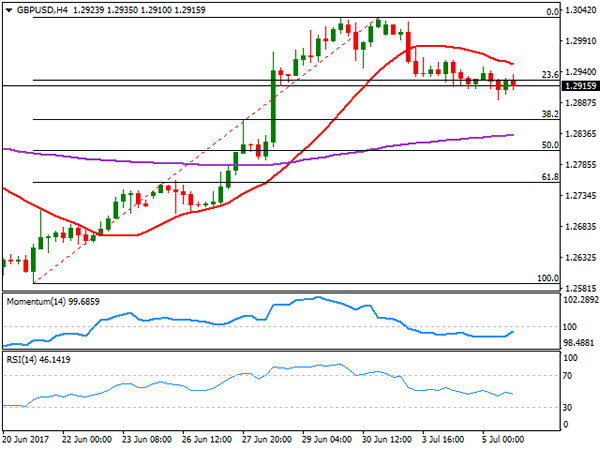
The GBP/USD pair fell down to 1.2892, with the following bounce limited to the 1.2930 region and posting a third consecutive lower low daily basis, hit by a poor Services PMI. In June, and according to Markit’s index, the sector’s growth decelerated for a second consecutive month, coming in at 53.4 from previous 53.8. This marks the third disappointing number release this week, as the indexes for the manufacturing and the construction sectors were also below previous and expected. The pair trades marginally lower daily basis, as the release of FOMC Minutes had little to add to what the market already knew, resulting in limited movements across the board. Technically, the risk remains towards the downside, given that in the 4 hours chart the price is below a bearish 20 SMA, currently at 1.2960, whilst the RSI indicator resumed its decline, now at 46 as the Momentum hovers directionless within negative territory. The pair is barely below 1.2925, the 23.6% retracement of its latest rally and the immediate resistance, but it would take an extension beyond 1.2960 to revert the ongoing bearish trend.
Support levels: 1.2890 1.2860 1.2820
Resistance levels: 1.2925 1.2960 1.2995
GOLD
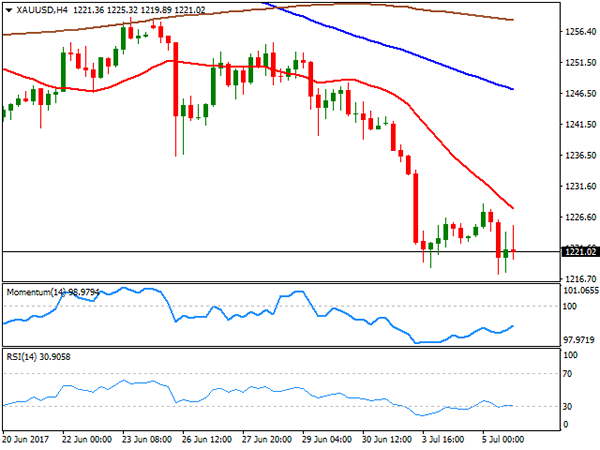
Gold prices extended their declines this Thursday, with spot ending the day at $1,220.97 a troy ounce, reverting and early advance triggered by geopolitical woes in Asia, after North Korea latest ballistic missile test. Spot came under pressure after during the US afternoon, as the Minutes of the latest Fed’s meeting showed that policy makers are firmly walking the tightening path, with no majors concerns over the latest slowdown in inflation. A recovery in US stocks, also weighed on the commodity. The daily chart shows that the bright metal was once again contained by selling interest around the 200 DMA, while reaching a fresh almost 2-month low of 1.217.40. Technical indicators in the mentioned time frame hold within bearish territory, with the RSI heading resuming its decline around 31, and the Momentum lacking directional strength within negative territory. Shorter term, and according to the 4 hours chart, the upside remains well-limited, with the price still developing below a bearish 20 SMA, today at 1,228.00, while technical indicators bounce modestly from oversold readings, not enough to support additional gains ahead.
Support levels: 1,217.40 1,208.30 1,198.20
Resistance levels: 1,228.00 1,236.50 1,241.80
WTI CRUDE OIL
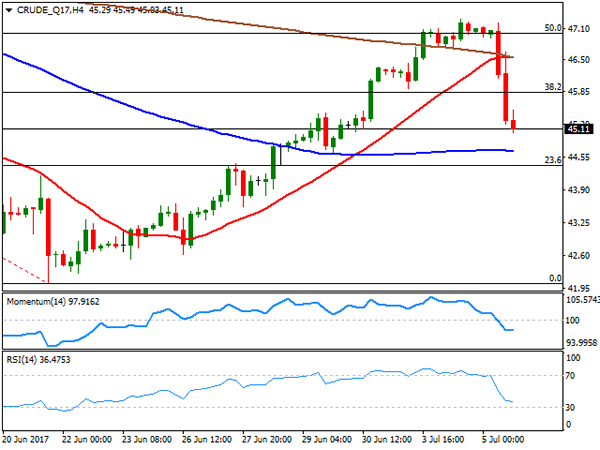
Crude oil prices plunged over 4% this Wednesday, with West Texas Intermediate futures ending the day at $45.10 a barrel, hit by news that Russia is not willing to support further OPEC cuts, and new evidence that the organization rose its exports in June. Russian officials announced that the government will oppose further cuts, indicating that it would send the wrong message to the market, while Reuters data showed that the organization exported 25.92 million barrels per day in June, up 450,000 bpd from May and 1.9 million bpd more than a year earlier. WTI daily chart supports further slides ahead, as the price retreated strongly after meeting selling interest around the 50% retracement of its latest decline, now trading below the 38.2% retracement of the same slide at 45.90. In the same chart, technical indicators have turned sharply lower, currently challenging their mid-lines, whilst the price is barely above a directionless 20 DMA. Shorter term, and according to the 4 hours chart, the commodity is bearish, with the Momentum indicator heading south well below its 100 level and the RSI indicator consolidating around 36, as the price broke below its 20 and 200 SMAs, now hovering a few cents above a flat 100 SMA.
Support levels: 44.40 43.70 43.10
Resistance levels: 45.90 46.60 47.20
DJIA
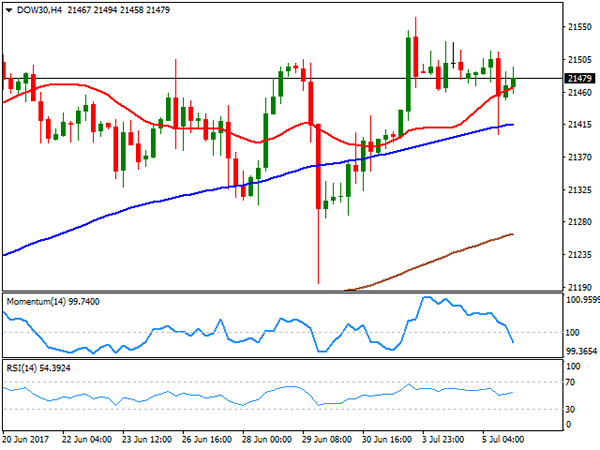
US equities ended a choppy session with modest gains, with the Nasdaq Composite outstanding amid a bounce in the tech sector, with the index up 40 points, to end at 6,150.86. The Dow Jones Industrial Average closed the day unchanged, down 1 point at 21,478.17, while the S&P added 3 points, to 2,432.54. Health-care, and financial equities also edged higher, while the energy sector weighed, amid the sharp decline in oil prices. Within the Dow, the best performer was Intel that added 275%, followed by Boeing that added 1.73%. Walt Disney led decliners, with a 1.75% decline, followed by Chevron that shed 1.68%. From a technical point of view, the index maintains a neutral-to-bearish stance, with indicators heading south around their mid-lines, but a bullish 20 DMA still providing support around 21,400. In the 4 hours chart, the Momentum indicator head sharply lower below its 100 level, the RSI indicator aims north around 54, while the index settled a few points above a bullish 20 SMA, overall limiting chances of a steeper decline ahead.
Support levels: 21,449 21,401 21,361
Resistance levels: 21,506 21,563 21,600
FTSE100
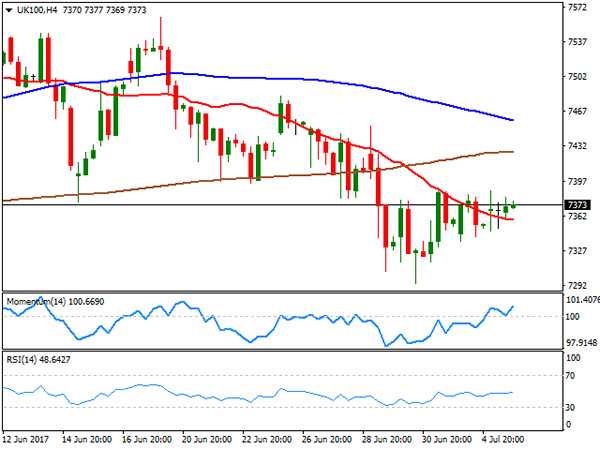
The UK benchmark, the FTSE 100, gained 10 points to close the day at 7,367.60, helped by a weaker Pound, but unable to find direction, with investors trapped within geopolitical tensions in Asia, and expectations over the FOMC Minutes´ release later on the day. Following an over 27% advance, Worldpay Group was the worst performer, down 8.82%, followed by Old mutual that shed 1.74%. Tesco led advancers with a 3.80% gain, followed by Provident Financial that added 3.49%. The index trades now around its 100 DMA in the daily chart, still well below a sharply bearish 20 SMA, and with technical indicators advancing within negative territory, limiting chances of a steeper advance. In the shorter term, and according to the 4 hours chart, the scale leans slightly towards the upside, as the index settled above a still bearish 20 SMA, but the RSI indicator consolidates within neutral territory, whilst the Momentum indicator advances beyond the 100 level at fresh weekly highs, not enough, however, to confirm a strong rally ahead.
Support levels: 7,331 7,294 7,256
Resistance levels: 7,380 7,424 7,452
DAX
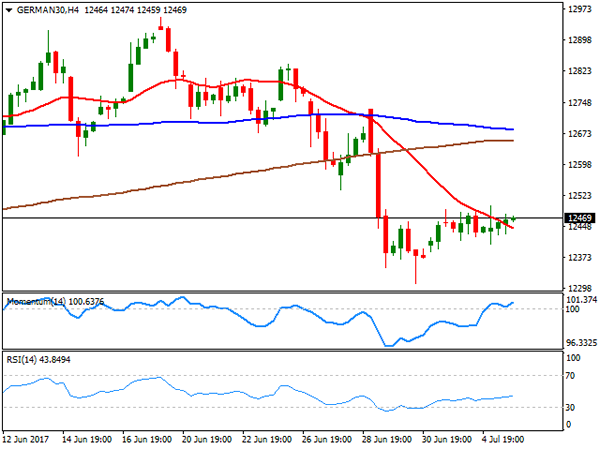
European equities hovered with gains and losses for most of the session, ending with modest gains, in spite of the slump in energy-related equities amid oil prices decline. The German DAX closed the day at 12,453.68, up 0.13% or 16 points, with Adidas leading advancers up 4.95%, followed by Deutsche Boerse which added 3.24%. Bayer was the worst performer, closing the day 0.94% lower, followed by Daimler that shed 0.84%, with auto makers under pressure across the region, on news that UK car registrations fell 4.8% in June. The index advanced modestly in after-hours trading, but the upward potential still seems limited according to the daily chart, as the index has held within its early week range, barely above a bullish 100 DMA but well below a bearish 20 DMA, whilst technical indicators have posted modest recoveries within bearish territory, with not enough momentum to confirm additional gains ahead. In the 4 hours chart, the index is right above a bearish 20 SMA, the RSI indicator is flat around 43, whilst the Momentum indicator heads higher around its 100 level, in line with the longer term perspective.
Support levels: 12,420 12,364 12,310
Resistance levels: 12,490 12,536 12,587