
A note on lower timeframe confirming price action…
Waiting for lower timeframe confirmation is our main tool to confirm strength within higher timeframe zones, and has really been the key to our trading success. It takes a little time to understand the subtle nuances, however, as each trade is never the same, but once you master the rhythm so to speak, you will be saved from countless unnecessary losing trades. The following is a list of what we look for:
- A break/retest of supply or demand dependent on which way you’re trading.
- A trendline break/retest.
- Buying/selling tails … essentially we look for a cluster of very obvious spikes off of lower timeframe support and resistance levels within the higher timeframe zone.
- Candlestick patterns. We tend to only stick with pin bars and engulfing bars as these have proven to be the most effective.
We typically search for lower-timeframe confirmation between the M15 and H1 timeframes, since most of our higher-timeframe areas begin with the H4. Stops are usually placed 1-3 pips beyond confirming structures.
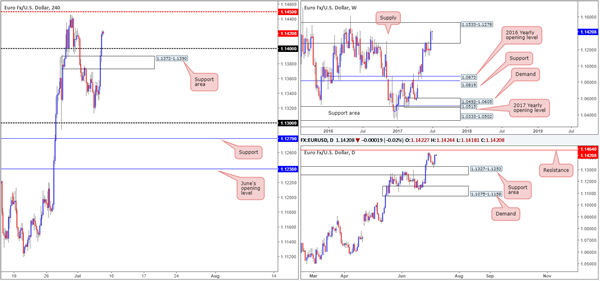
EUR/USD
The EUR/USD bulls went on the offensive during yesterday’s segment, running through both the H4 resistance area at 1.1372-1.1390, as well as the 1.14 handle. Influenced by lower-than-expected US ADP non-farm employment numbers and weekly unemployment figures, the major managed to end the day forming a nice-looking daily full-bodied bullish candle.
While we agree that the bulls look incredibly aggressive at this time, traders may want to note that weekly flow remains loitering within the walls of a major supply zone drawn from 1.1533-1.1278 that has capped upside since May 2015. Furthermore, we also see a strong-looking daily resistance level overhead at 1.1468. Therefore, the bears still clearly have a hand in this fight!
Our suggestions: Based on the above findings, our desk has their eye on a H4 supply zone positioned just above the 1.1450 mid-level line at 1.1529-1.1484 (seen higher on the screen) for potential shorts. Why this area? Well, we can see that it’s located within the upper boundary of the said weekly supply zone, thus should we trade it, we can place stops above the weekly supply. What’s more, it is positioned just above the aforementioned daily resistance line, and also of interest is how fresh the H4 supply zone is!
In addition, stop-loss orders above 1.1450 and the daily resistance line at 1.1464 will, should price strike our H4 supply, likely provide enough liquidity for the big boys to sell, and this is exactly where we want to be!
Data points to consider: US Employment figures at 1.30pm, US Fed Monetary policy report at 4pm GMT+1.
Levels to watch/live orders:
- Buys: Flat (stop loss: N/A).
- Sells: 1.1529-1.1484 ([waiting for a H4 bear candle – preferably a full, or near full-bodied candle –to form is advised] stop loss: ideally beyond the candle’s wick).
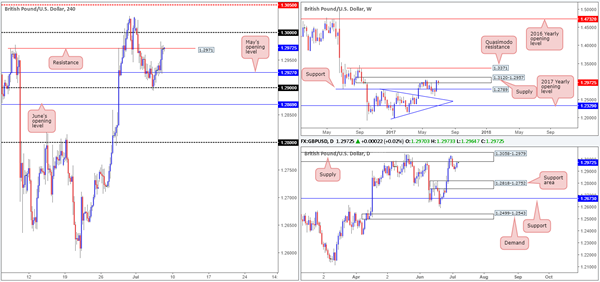
GBP/USD
Cable struck the 1.29 handle on Wednesday and, as you can see, has remained in a bullish state since. Using May’s opening level at 1.2927 to bolster price yesterday, the pair managed to lock horns with a H4 resistance level at 1.2971 going into the close. This level, and the nearby 1.30 psychological band located above, are of interest to our team this morning.
Looking over to the bigger picture, weekly price remains teasing a supply pegged at 1.3120-1.2957 and daily action is also seen kissing the underside of a supply base coming in at 1.3058-1.2979.
Now, looking at how the H4 candles have responded to the resistance line at 1.2971, we feel that the 1.30 boundary will likely be seeing some action today. This number – coupled with it being sited within both of the above said weekly and daily supply areas, is of interest to our desk this morning. However, one has to take into account that should the bears react from 1.30, there’s a chance that 1.2971 could halt selling as it will effectively be a support at that stage.
Our suggestions: To confirm bearish intent from 1.30, we would need to see price close back below 1.2971. This, for us, would be enough evidence to suggest that the H4 candles are likely going to retest May’s opening level at 1.2927, and possibly the 1.29 handle lurking just beneath it.
Data points to consider: UK manufacturing production at 9.30am, BoE Gov. Carney is also speaking sometime today. US Employment figures at 1.30pm, US Fed Monetary policy report at 4pm GMT+1.
Levels to watch/live orders:
- Buys: Flat (stop loss: N/A).
- Sells: 1.30 region ([waiting for a H4 bearish close to form below 1.2971 is advised before pulling the trigger] stop loss: ideally beyond the candle’s wick).
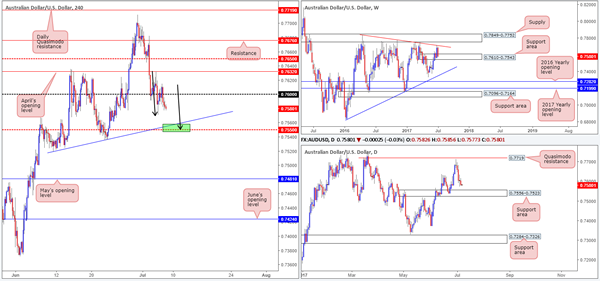
AUD/USD
The AUD/USD charts are certainly interesting this morning! Over on the weekly chart, the bears continue to dig their way into a support area marked at 0.7610-0.7543. Stepping down a level to the daily chart, however, the unit shows space for price to continue pushing lower until we reach the support area formed at 0.7556-0.7523, which happens to be glued around the lower edge of the current weekly support area.
Now, this is where it gets exciting! As mentioned in Thursday’s report, we are currently watching to see if H4 price can shake hands with the mid-level support at 0.7550 for potential longs. Here’s our reasoning:
By and of itself, 0.7550 is a watched psychological band.
0.7550 merges with a H4 trendline support etched from the low 0.7519.
Should the H4 candles continue pressing lower, the approach will have formed a beautiful-looking AB=CD bullish formation terminating at 0.7550 (see black arrows).
0.7550 is also located within both of the above said weekly and daily support areas.
Our suggestions: So, put simply, we are going to be watching for price to strike 0.7550 today and hold firm. Should we spot H4 bulls coming into the picture from here in the shape of a (preferably) full-bodied bull candle, we would have no hesitation buying this market and targeting 0.76 as an initial take-profit zone.
Data points to consider: US Employment figures at 1.30pm, US Fed Monetary policy report at 4pm GMT+1.
Levels to watch/live orders:
- Buys: 0.7550 region ([waiting for a H4 bull candle – preferably a full, or near full-bodied candle –to form is advised] stop loss: ideally beyond the candle’s tail).
- Sells: Flat (stop loss: N/A).
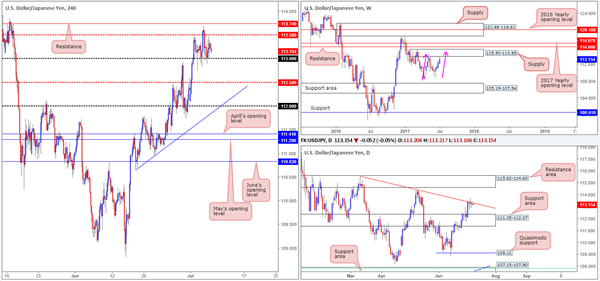
USD/JPY
Over the past few days, the USD/JPY has been somewhat subdued. H4 action remains capped between the mid-level resistance at 113.50 and the 113 handle. Directly above this area sits a resistance level drawn from 113.74, and below 113, we do not see much in the way of support until the mid-level number 112.50.
Recent developments on the weekly timeframe show price came within a cat’s whisker of connecting with the underside of supply pegged at 115.50-113.85. Assuming that the unit connects with this area, it could also form a possible AB=CD correction completing around 115 (see pink arrows). Sliding down to the daily timeframe, nonetheless, we can see that the candles remain capped by the trendline resistance taken from the high 115.50. What’s also notable from a technical perspective is this has formed back-to-back indecision candles here.
Our suggestions: Seeing as the overall structure of this market remains unchanged, we still do not want to risk trading short until we know that the market is located within the aforementioned weekly supply. What would be ideal here, however, is for the said weekly AB=CD formation to complete, but that could be sometime before we see this come to fruition!
Data points to consider: US Employment figures at 1.30pm, US Fed Monetary policy report at 4pm GMT+1.
Levels to watch/live orders:
- Buys: Flat (stop loss: N/A).
- Sells: Flat (stop loss: N/A).
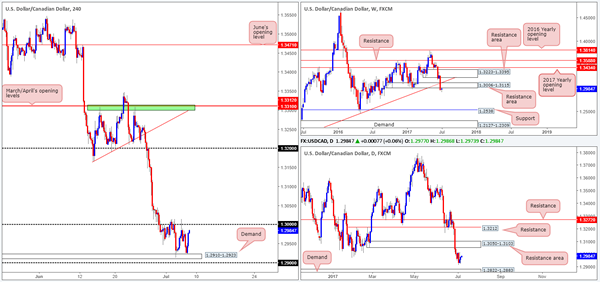
USD/CAD
As can be seen from the H4 chart this morning, the unit remains consolidating between demand at 1.2910-1.2923 and the 1.30 boundary.
As highlighted in yesterday’s report, we do not expect the bulls to breach the top edge of this range for the following reasons:
1.30 is a line watched by the majority of the market and seeing as it already held as resistance on Monday; we believe it is likely to continue holding firm.
Secondly, 1.30 also denotes the underside of a recently broken weekly demand base at 1.3006 (now acting as a resistance area).
The underlying trend is strongly pointing to the downside at the moment, and daily price shows space for the unit to continue lower until we reach demand pegged at 1.2822-1.2883.
Our suggestions: The desk has come to a general consensus that 1.30 could, if retested for a third time today, be an area we may consider a sell from. To decide this, however, we would require a H4 bearish candle to form following the retest, preferably in the shape of a full, or near-full-bodied candle. The first take-profit target, assuming that a sell comes to fruition, would be the aforementioned H4 demand, followed closely by the 1.29 handle.
Data points to consider: US Employment figures at 1.30pm, US Fed Monetary policy report at 4pm. Canadian employment figures at 1.30pm GMT+1.
Levels to watch/live orders:
- Buys: Flat (Stop loss: N/A).
- Sells: 1.30 region ([waiting for a H4 bear candle – preferably a full, or near full-bodied candle –to form is advised] stop loss: ideally beyond the candle’s wick).
USD/CHF
Kicking this morning’s report off with a look at the weekly timeframe, we can see that the resistance level at 0.9639 is holding firm for the time being. With that said, the bears have certainly not got it easy right now! Not only have they got to overcome the nearby support at 0.9581, but also the support level seen below it at 0.9508. Looking down to the daily timeframe, the next area of support can be seen at 0.9561, a 127.2% Fib ext. taken from the high 0.9808, followed closely by support at 0.9546.
Bouncing across to the H4 timeframe, the pair has recently crossed swords with the 0.96 handle and is, for now, holding firm. Personally, we do not feel 0.96 is going to hold for much longer though. The reason is simply because of the green area planted below (comprised of the weekly support level at 0.9581 and the daily support level pegged at 0.9546) being far more attractive.
Our suggestions: In the event that our analysis is correct and H4 price connects with the aforementioned green zone, our team will, once again, be looking to buy from here. Should a H4 bull candle, preferably a full-bodied candle, take shape, a long from here is high probability. The first area of trouble would obviously be the 0.96 line, so we’d be looking for price to overcome this before considering reducing risk to breakeven and taking some profits off the table.
Data points to consider: US Employment figures at 1.30pm, US Fed Monetary policy report at 4pm GMT+1.
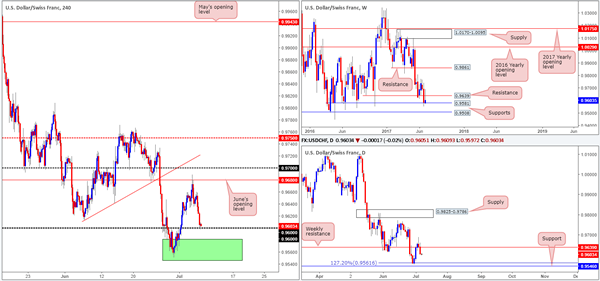
Levels to watch/live orders:
- Buys: 0.9546-0.9581 ([waiting for a H4 bull candle – preferably a full, or near full-bodied candle –to form is advised] stop loss: ideally beyond the candle’s tail).
- Sells: Flat (stop loss: N/A).
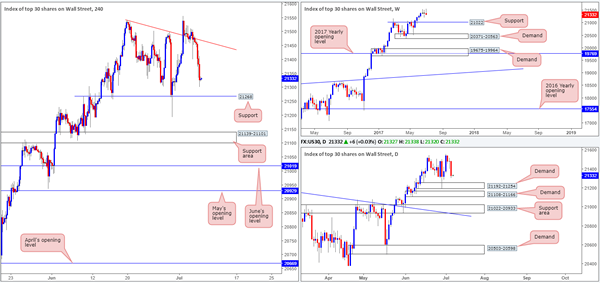
DOW 30
In recent trading, US equities took a turn for the worse and traded to a low of 21300 by the closing bell. What the move also did was tap our breakeven stop at 21323 for a reasonable profit as we already took 50% off the table upon striking the H4 trendline resistance extended from the high 21541.
With H4 price now lurking nearby a support level at 21268, where do we go from here? Well, 21268 hovers just ahead of a daily demand base coming in at 21192-21254, so if you’re thinking of going long from the H4 level, be ready for a possible fakeout to take place! On the weekly timeframe, there’s little stopping the unit from pulling all the way back to 21022: a support level which has relatively sound history as a resistance.
Our suggestions: We will be watching for H4 price to whipsaw through the current H4 support and touch gloves with the said daily demand. Should this come to fruition, our team would likely look to enter long again, with stops planted below the fakeout candle’s tail, targeting the said H4 trendline resistance as an initial take-profit zone.
Data points to consider: US Employment figures at 1.30pm, US Fed Monetary policy report at 4pm GMT+1.
Levels to watch/live orders:
- Buys: 21323 region ([watching for H4 price to fake through this number and touch daily demand before looking to go long here] stop loss: ideally beyond the fakeout candle’s tail).
- Sells: Flat (stop loss: N/A).
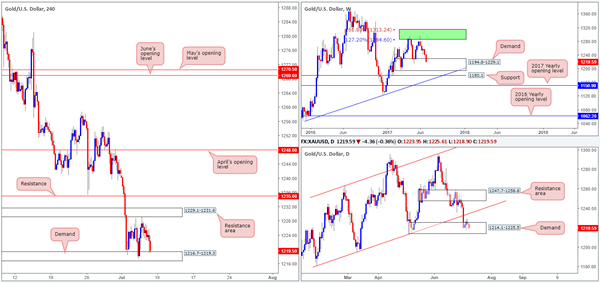
GOLD
(Much of the following gold report echoes similar thoughts to Thursday’s analysis since structure remains unchanged).
As we noted in Thursday’s report, H4 price continues to put together a consolidation zone formed by a resistance area penciled in at 1229.1-1231.6 and a demand base coming in at 1216.7-1219.3.
While traders who only focus on one timeframe may feel that this market is likely headed south due to the medium-term downtrend that we are currently in on the H4 timeframe, the higher-timeframe picture would suggest otherwise!
Scrolling over to the weekly timeframe, the buyers and sellers are seen battling for position within a demand zone at 1194.8-1229.1. This demand has held price higher once already back in early May, so there’s a solid chance that history may repeat itself here. In conjunction with the weekly timeframe, daily price also shows the yellow metal trading from within a demand at 1214.1-1225.5, which happens to be positioned within the said weekly demand area.
While the H4 candles could remain bouncing from the H4 range extremes this week, we do not believe this consolidation will give way to the downside for reasons stated above. And, even if it does, we don’t feel price will manage to get far beyond the lower edge of the daily demand at 1214.1.
As mentioned in yesterday’s analysis, a level that has sparked some interest is the H4 resistance base penciled in at 1235.0, due to its connection with the daily trendline resistance seen extended from the low 1180.4. Still, shorting from this line would still entail one going against potential weekly buying power.
With that in mind, it would not be until a decisive H4 close above 1235.0 is seen, would our team consider buying as an option.
Our suggestions: Typically, we try to avoid trading against higher-timeframe flow. And selling 1235.0 would place us against potential weekly flow! Therefore, our desk is going to remain on the sidelines and wait and see if the H4 bulls can close above 1235.0 for possible longs up to April’s opening level at 1248.0.
Levels to watch/live orders:
- Buys: Watching for 1235.0 to be consumed on the H4 chart before buying becomes an option.
- Sells: Flat (stop loss: N/A).


