
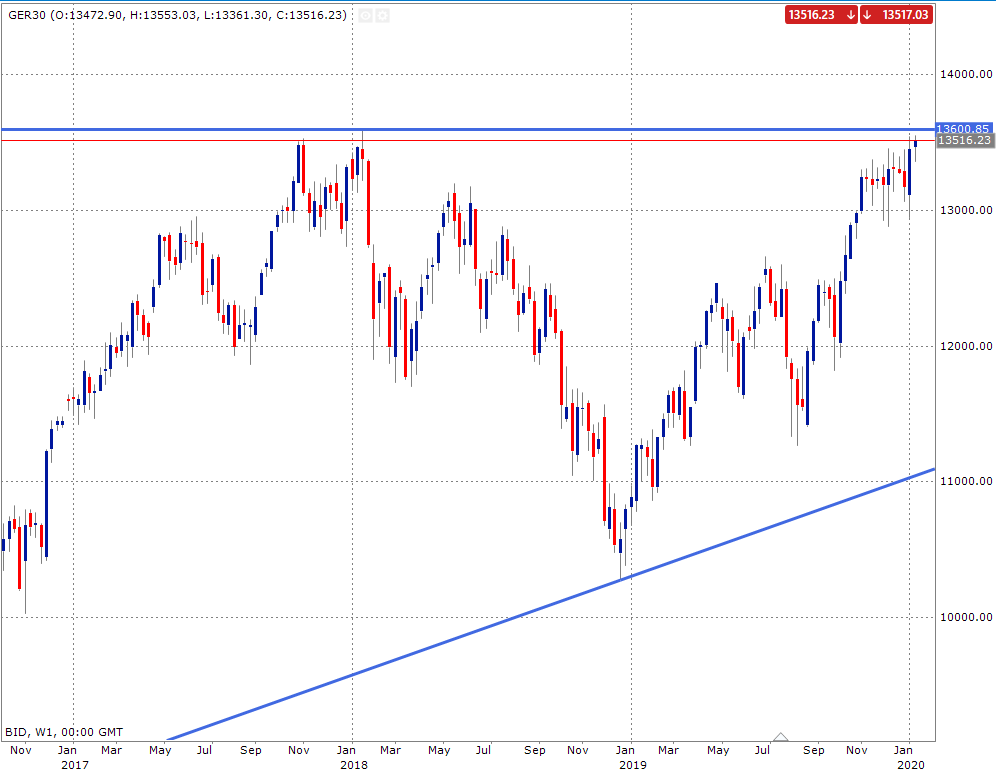
The Dax is at a key level and might break the resistance on the weekly chart of 13600.85 (GER30).
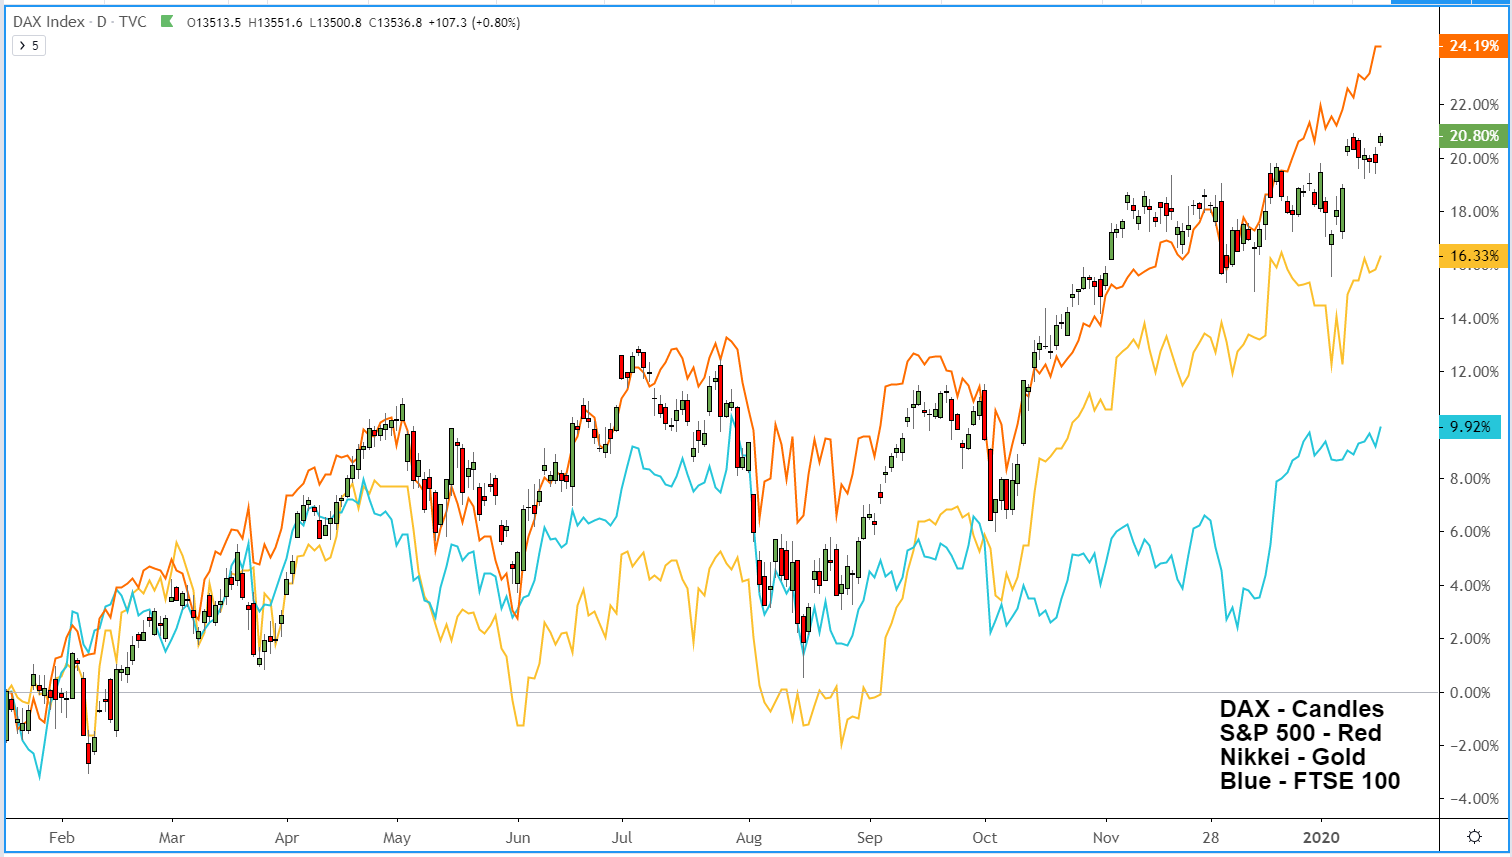
This is a key level as of course compared to its US counterparts it has been lagging somewhat on that front as they seem to make record highs on a daily basis.
Some analysts have noted that this could be an opportunity in 2020 (catch up trade) and the ECB easing story could just lend a hand. Some have also suggested that EU indices could be undervalued compared to the US bourses.
Below is the weekly chart highlighting the importance of the level.
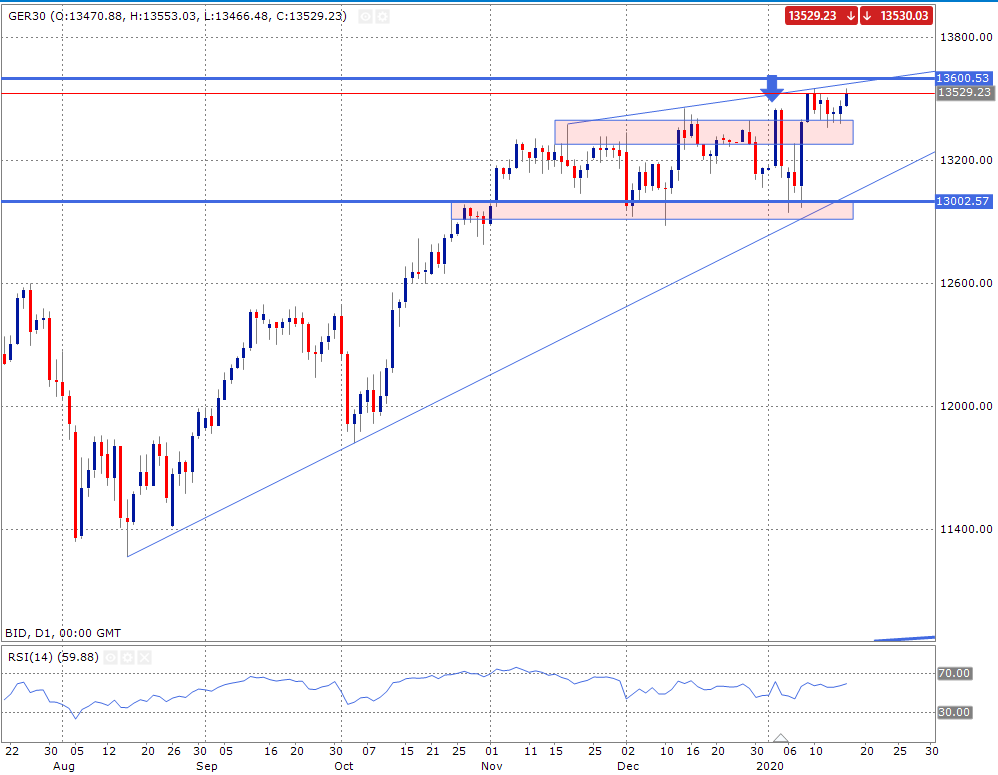
On the daily chart, you can see we are in a heavy area where price is really looking to make up its mind on this break out. The previous wave high looked like it was going to test the resistance but failed at the last hurdle. The good news for the bulls is that when the retracement kicked in the price didn’t even manage to test the bottom trendline correctly.
There was a reversal candle formation at the blue arrow that failed and now the area is being used as a support for the test higher today.
The RSI is in a positive area but still has some scope for a move higher as its not yet reached extreme overbought areas. And after 13000 was used as support the prospects of a move higher from there looked good as the RSI gave a bullish failure swing signal.


