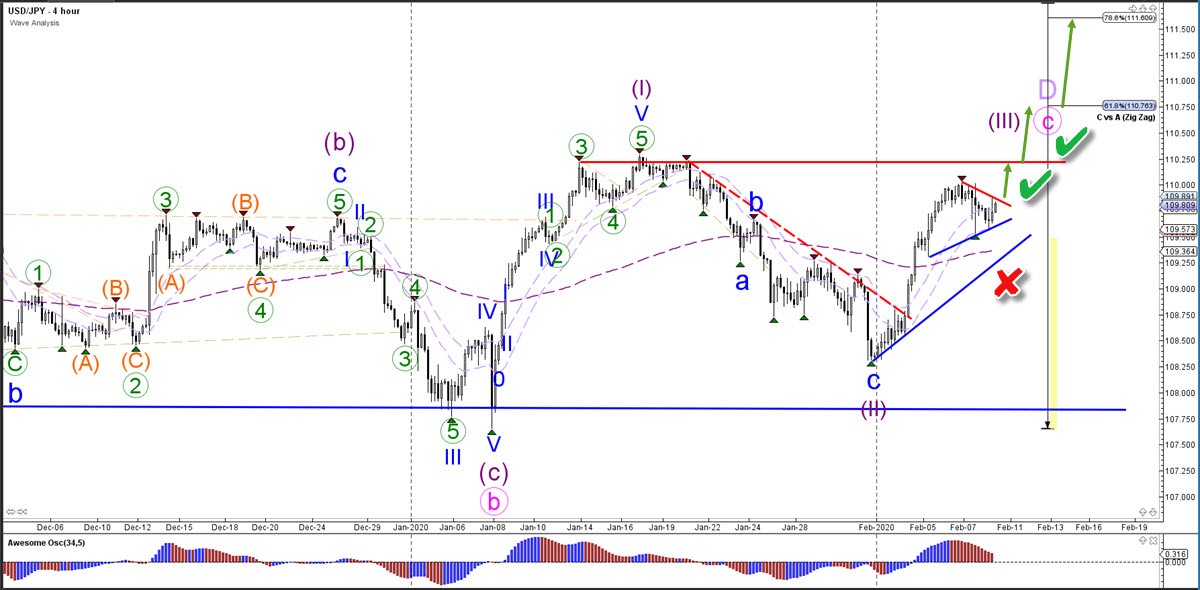
The USD/JPY breakout above the triangle pattern resistance and the previous top could confirm (green check) the push higher towards the Fibonacci targets of wave C vs A. A break below the support trend line (blue) and the long-term moving averages could invalidate (red x) the wave outlook
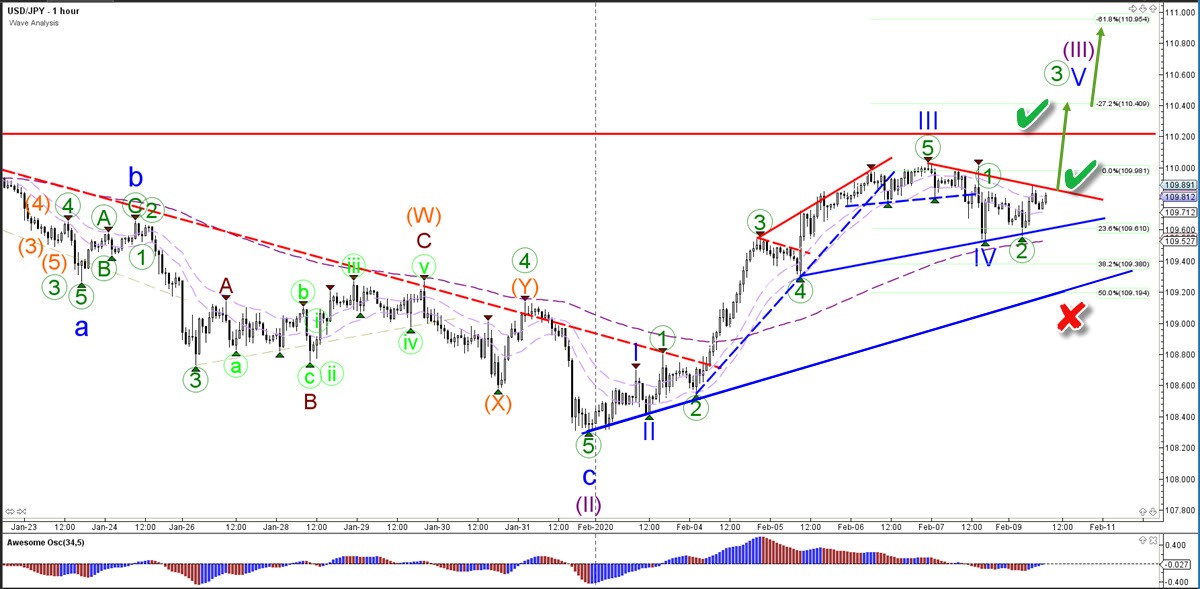
The USD/JPY is building a bearish pullback after building a rising wedge reversal chart pattern. The shallow retracement could confirm a wave 4 (blue) pattern. The bullish breakout (green check) above the resistance (red) could indicate the start of a wave 5 (blue) pattern.