
The EUR/USD currency pair
Technical indicators of the currency pair:
Prev Open: 1.09796
Open: 1.09412
% chg. over the last day: -0.32
Day’s range: 1.09412 – 1.09574
52 wk range: 1.0879 – 1.1572
The EUR/USD currency pair shows a stable downtrend. The trading instrument has set new local lows again. On Friday, February 07, the USA published a quite optimistic labor market statistics for January. The demand for USD remains at a high level. Investors continue to assess the risks of further coronavirus spreading from China. Currently, EUR/USD quotes are consolidating in the range of 1.09400-1.09700. Positions should be opened from key levels.
The Economic News Feed for 10.02.2020:
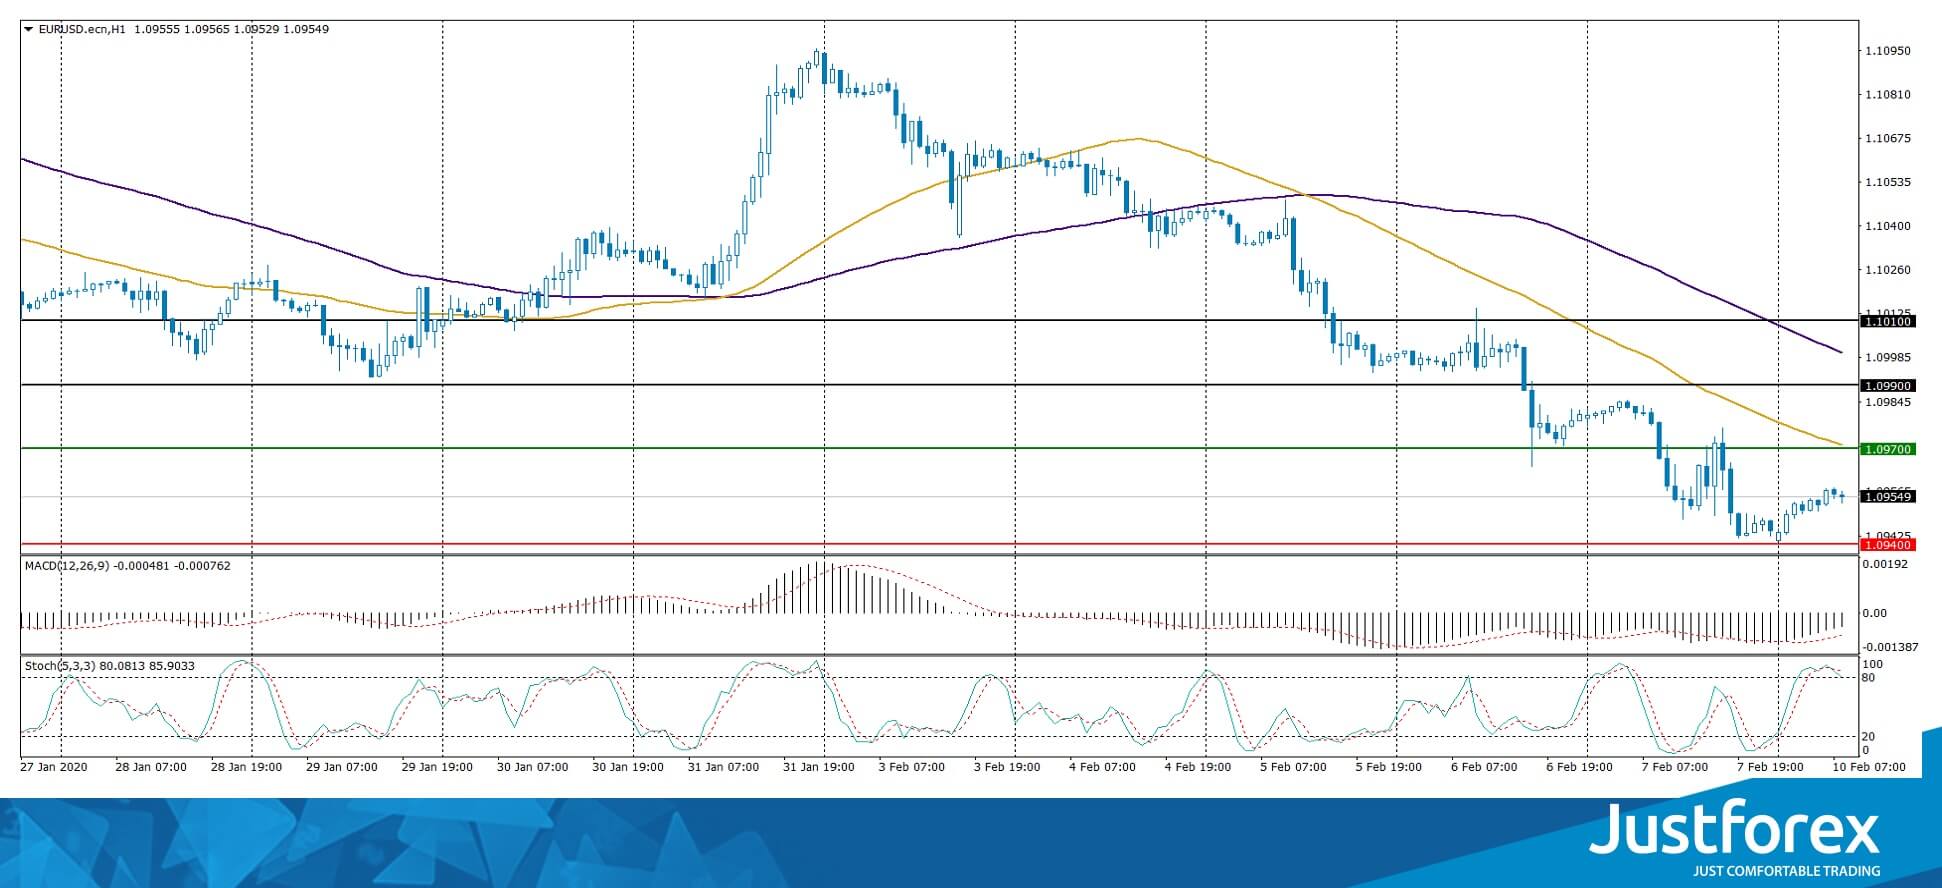
The indicators signal the sellers’ strength: the price has fixed below 50 MA and 100 MA.
MACD histogram is in the negative zone, but above the signal line, which gives a weak signal to sell EUR/USD.
The Stochastic Oscillator is located in the overbought zone, the %K line crossed the %D line. There are no signals at the moment.
Trading recommendations
Support levels: 1.09400, 1.09000
Resistance levels: 1.09700, 1.09900, 1.10100
If the price fixes below 1.09400, expect further decline toward 1.09000.
Alternatively, the quotes could grow toward 1.09900-1.10100.
The GBP/USD currency pair
Technical indicators of the currency pair:
Prev Open: 1.29261
Open: 1.28839
% chg. over the last day: -0.29
Day’s range: 1.28839 – 1.29086
52 wk range: 1.1959 – 1.3516
GBP/USD quotes continue to show negative dynamics. Sterling has updated the local lows. The demand for the American currency remains at a high level after the release of positive labor statistics. At the moment, the trading instrument is consolidating. The local support and resistance levels are 1.28800 and 1.29200, respectively. The GBP/USD currency pair has a potential for further decline. Positions should be opened from key levels.
The news background on the UK economy is calm.
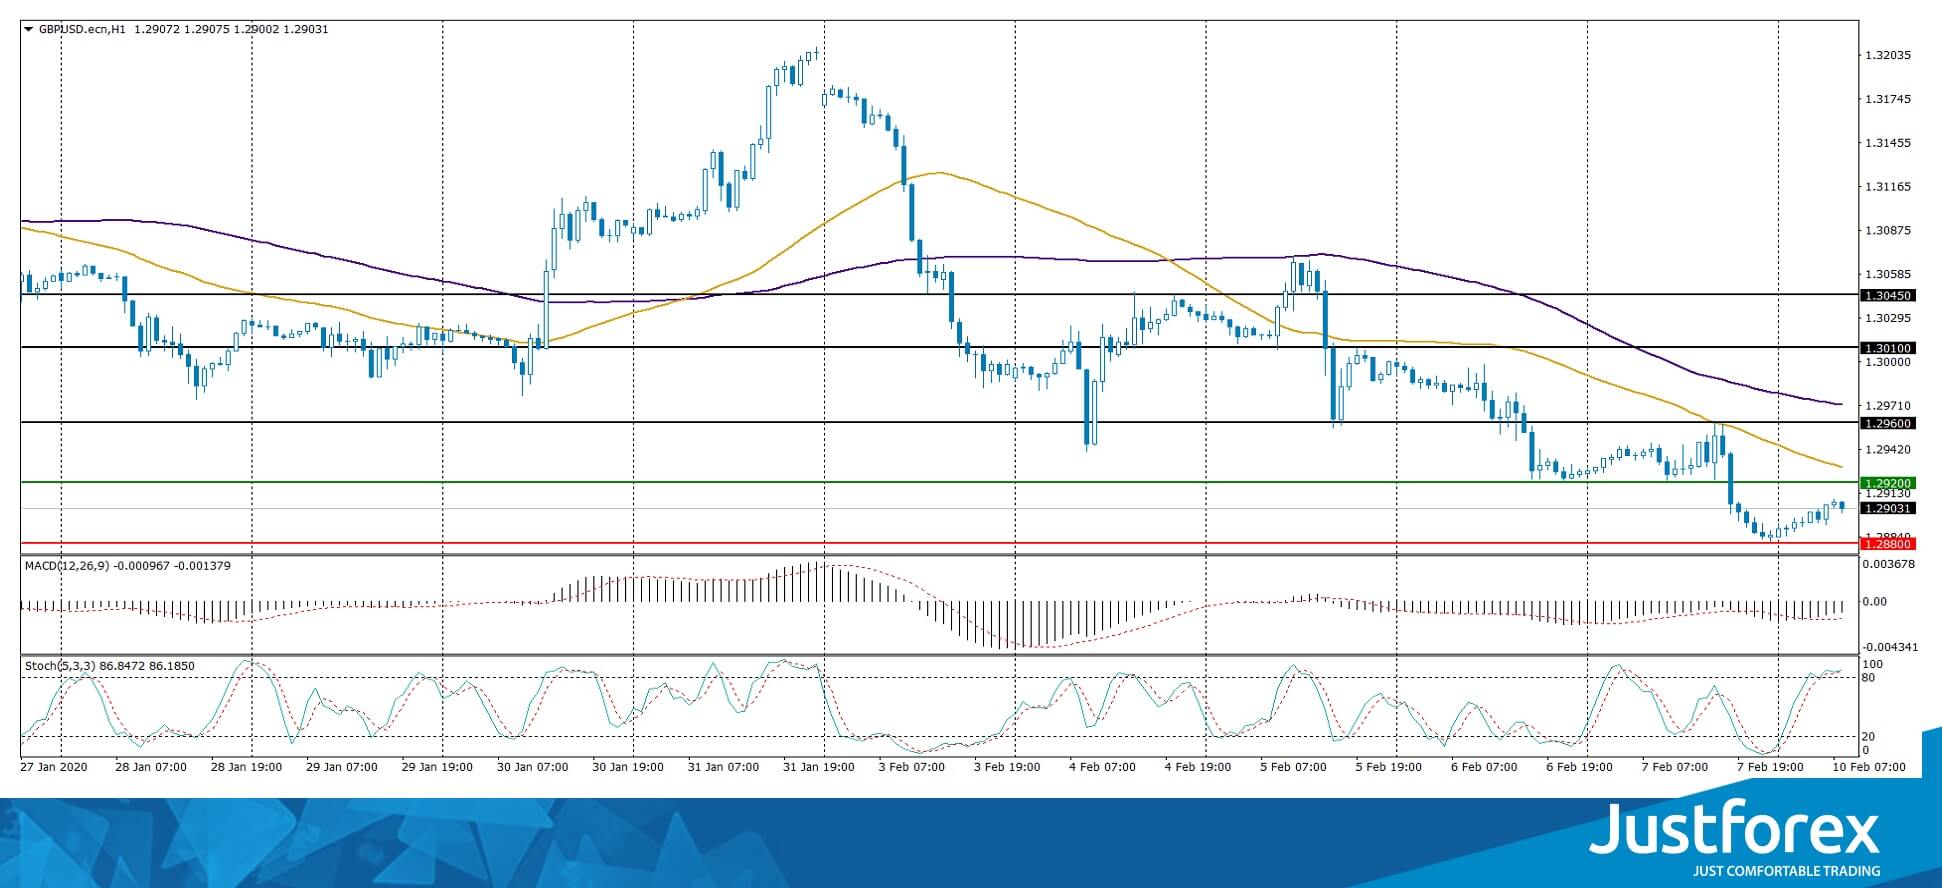
The price is fixed below 50 MA and 100 MA, which signals the strength of the sellers.
The MACD histogram is in the negative zone, which indicates a bearish sentiment.
The Stochastic Oscillator is located in the overbought zone, the %K line crossed the %D line. There are no signals at the moment.
Trading recommendations
Support levels: 1.28800, 1.28400
Resistance levels: 1.29200, 1.29600, 1.30100
If the price fixes below 1.28800, expect quotes to fall toward 1.28500-1.28300.
Alternatively, the quotes could grow toward 1.29600-1.30000.
The USD/CAD currency pair
Technical indicators of the currency pair:
Prev Open: 1.32840
Open: 1.32999
% chg. over the last day: +0.21
Day’s range: 1.32894 – 1.33129
52 wk range: 1.2949 – 1.3566
There is a mixed technical picture on the USD/CAD currency pair. The Mooney is traded in flat. Unidirectional trend is not observed. Financial markets participants are waiting for additional drivers. At the moment local support and resistance levels are acting: 1.32850 and 1.33150, respectively. In the nearest future correction of the trading instrument after prolonged growth is not excluded. We recommend to pay attention to the dynamics of black gold prices. Positions should be opened from key levels.
At 15:30 (GMT+2:00) a report on construction permits in Canada will be published.
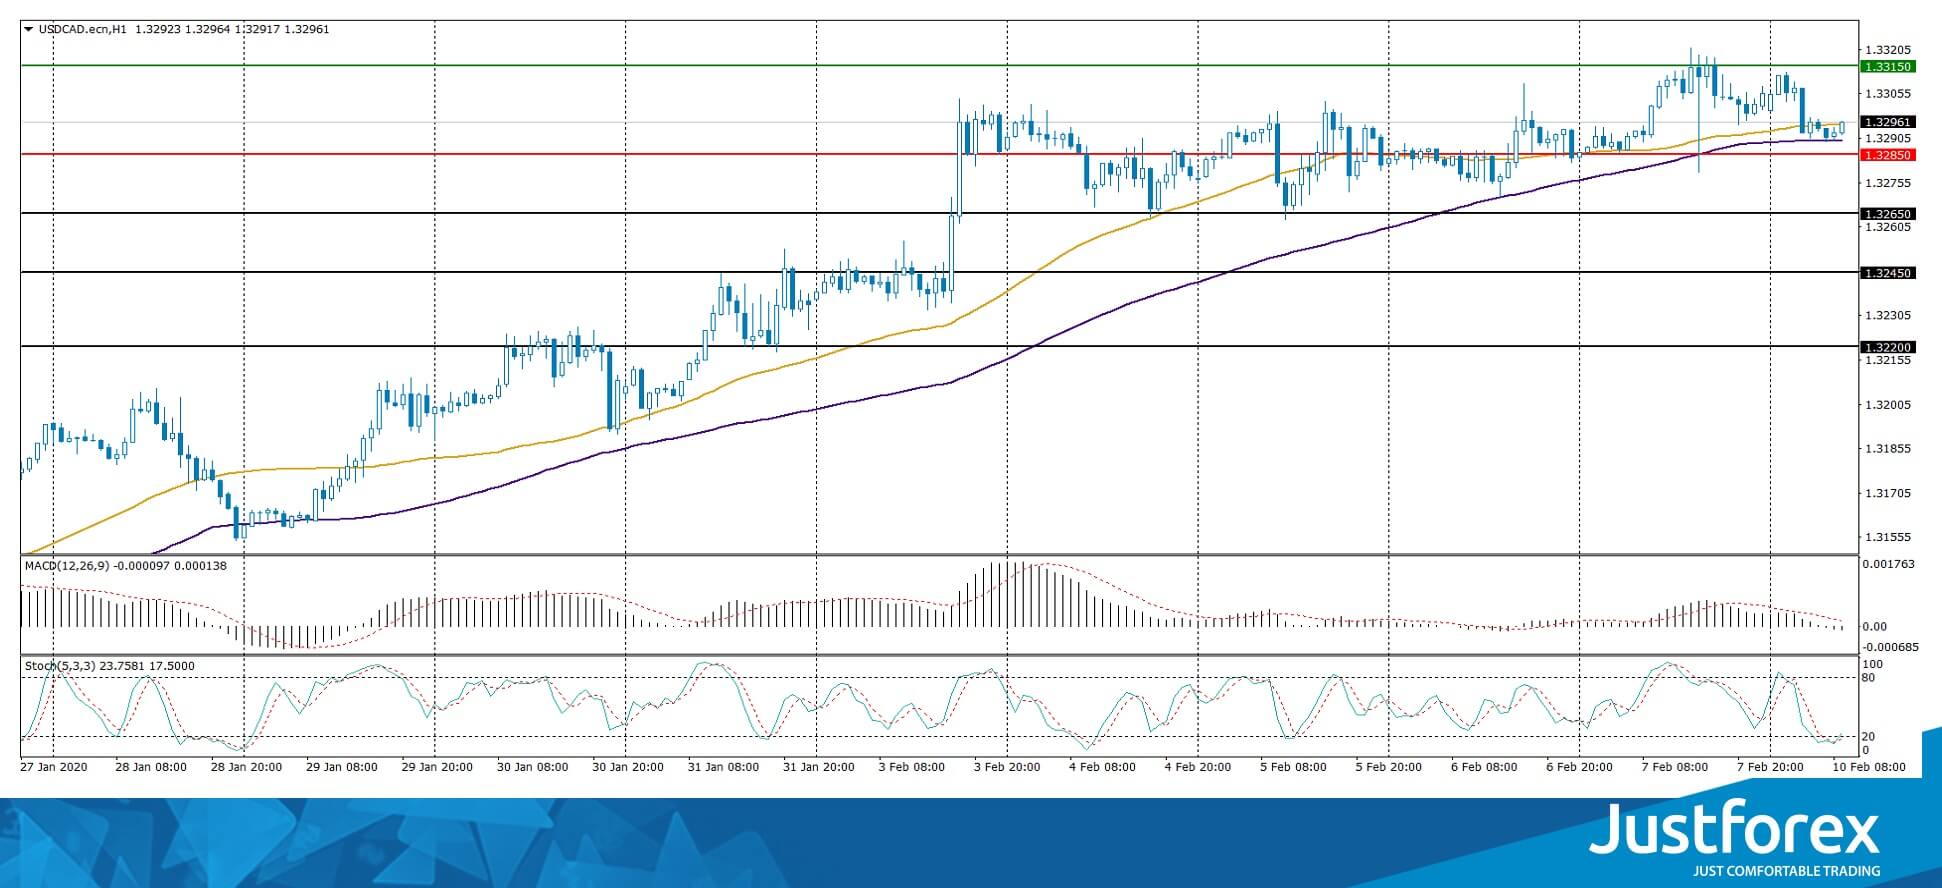
Indicators do not give accurate signals: the price has crossed 50 MA and 100 MA.
MACD histogram is near the 0 mark.
The Stochastic Oscillator is located in the oversold area, the %K line has crossed the %D line. No signals at the moment.
Trading recommendations
Support levels: 1.32850, 1.32650, 1.32450
Resistance levels: 1.33150, 1.33500
If the price fixes above 1.33150, expect further growth of USD/CAD quotes to 1.33500-1.33700.
Alternatively, the quotes could correct toward 1.32500-1.32300.
The USD/JPY currency pair
Technical indicators of the currency pair:
Prev Open: 109.986
Open: 109.678
% chg. over the last day: -0.25
Day’s range: 109.561 – 109.879
52 wk range: 104.45 – 113.53
USD/JPY currency pair is in a sideways movement. The technical picture is ambiguous. At the moment the following key support and resistance levels can be identified 109.550 and 110.000, respectively. The correction of USD/JPY quotes is not ruled out in the nearest future. We recommend to pay attention to the dynamics of US government securities yield. Positions should be opened from key levels.
The news background on Japanese economy is rather calm.
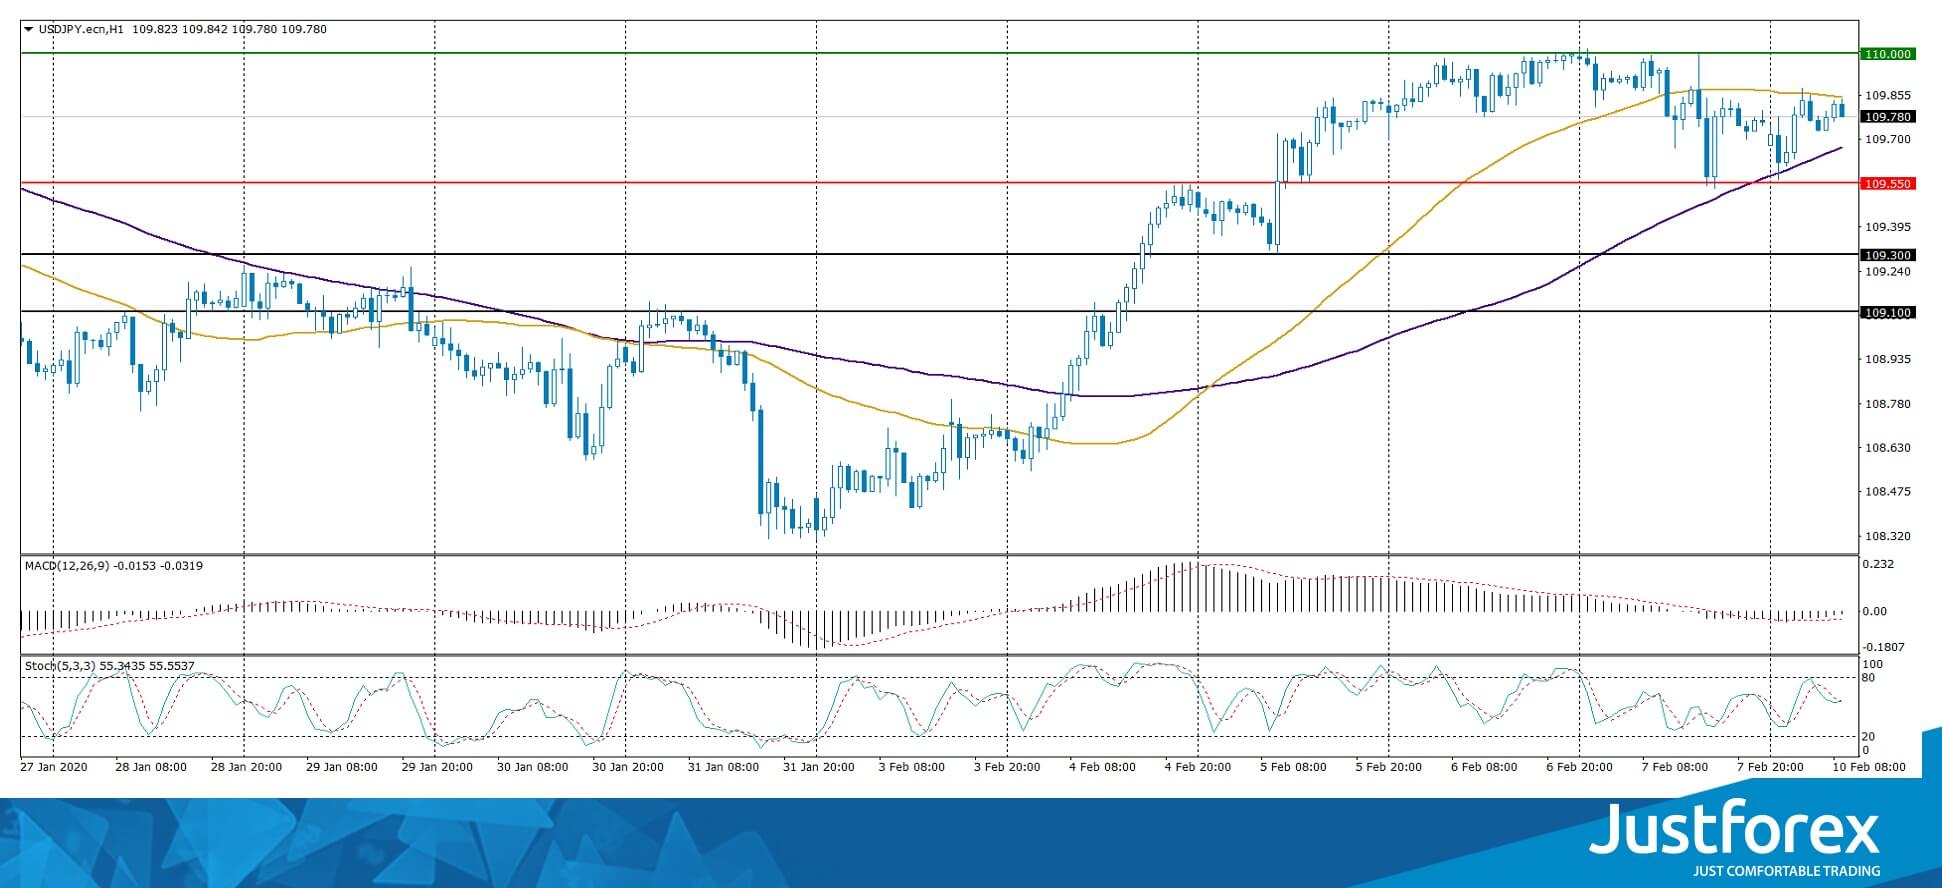
Indicators do not give accurate signals: the price has fixed between 50 MA and 100 MA.
The MACD histogram has approached the 0 point. There are no accurate signals.
The Stochastic Oscillator is located in the neutral zone, the %K line has crossed the %D line. There are no signals at the moment.
Trading recommendations
Support levels: 109.550, 109.300, 109.100
Resistance levels: 110.000, 110.250
If the price fixes above 110.000, expect further growth toward 110.250-110.400.
Alternatively, the quotes could descend toward 109.300-109.100.


