
The EUR/USD currency pair
Technical indicators of the currency pair:
Prev Open: 1.09412
Open: 1.09107
% chg. over the last day: -0.36
Day’s range: 1.09080 – 1.09171
52 wk range: 1.0879 – 1.1572
EUR/USD quotes continue to show negative dynamics. The single currency has set new local lows again. Demand for the U.S. dollar remains at a high level. At the moment, the trading instrument is consolidating. The key support and resistance levels are 1.09000 and 1.09400, respectively. Technical correction of the EUR/USD currency pair is not excluded in the nearest future. Positions should be opened from key levels.
Today we recommend to pay attention to the speeches of the head of ECB and FOMC representatives.
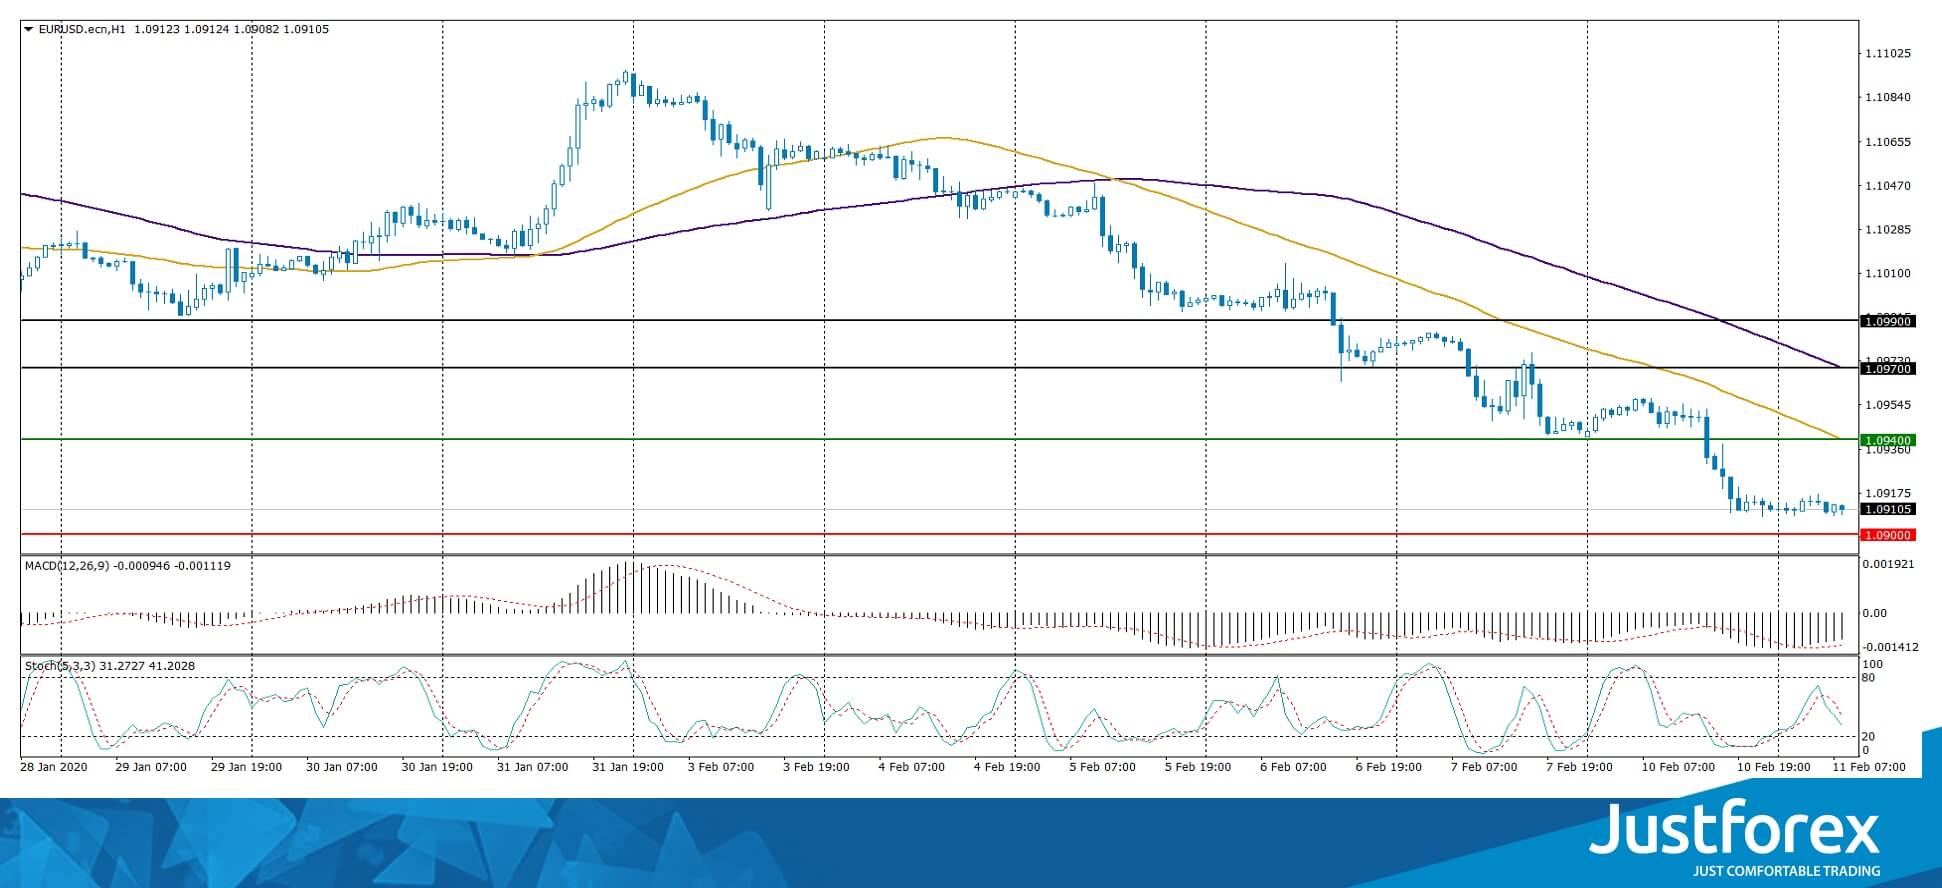
The indicators signal the sellers’ strength: the price has fixed below 50 MA and 100 MA.
MACD histogram is in the negative zone, but above the signal line, which gives a weak signal to sell EUR/USD.
The Stochastic Oscillator is in the neutral zone, the %K line is below the %D line, which indicates that the sentiment is bearish.
Trading recommendations
Support levels: 1.09000, 1.08700
Resistance levels: 1.09400, 1.09700, 1.09900
If the price fixes below the round level of 1.09000, expect a drop toward 1.08700-1.08600.
Alternatively, the quotes could grow toward 1.09700-1.09900.
The GBP/USD currency pair
Technical indicators of the currency pair:
Prev Open: 1.28839
Open: 1.29148
% chg. over the last day: +0.20
Day’s range: 1.29074 – 1.29217
52 wk range: 1.1959 – 1.3516
The GBP/USD currency pair has stabilized. Sterling is being consolidated at the moment. The key support and resistance levels are: 1.28750 and 1.29250, respectively. Technical correction of the trading instrument is not ruled out in the nearest future. The participants of financial markets took a waiting position before the release of important statistical data on the UK economy. Positions should be opened from key levels.
The Economic News Feed for 11.02.2020:
UK GDP Report (GB) – 11:30 (GMT+2:00);
UK manufacturing output (GB) – 11:30 (GMT+2:00);
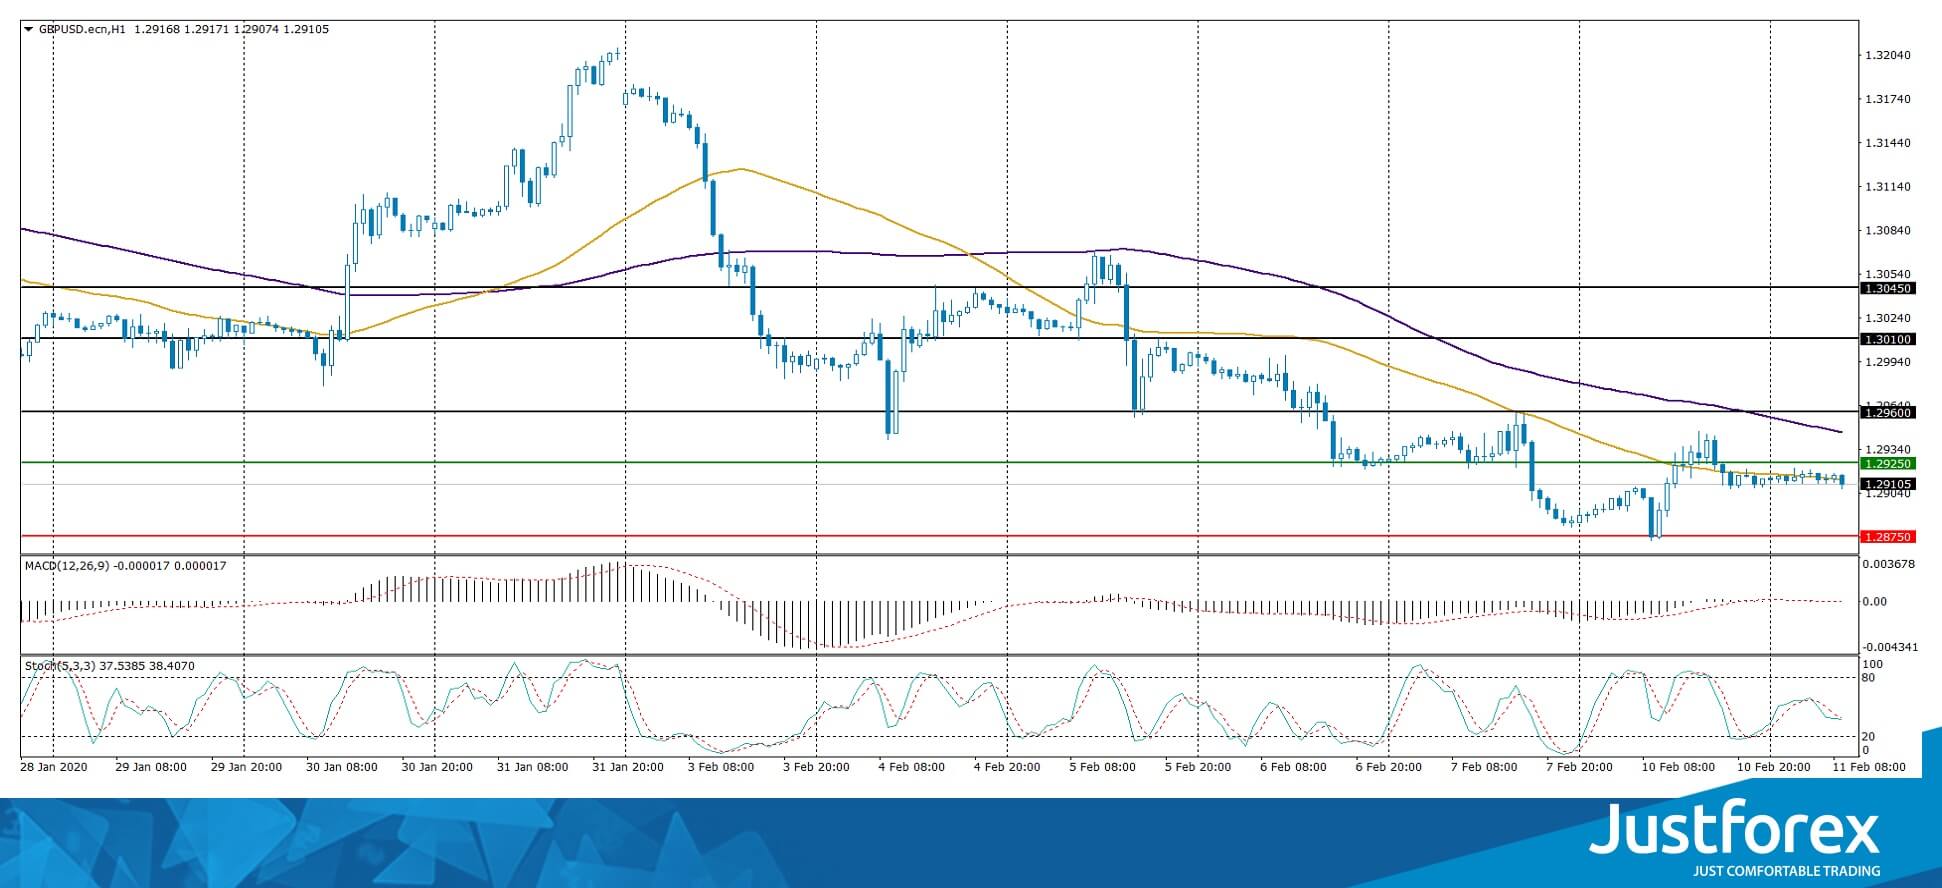
Indicators do not give accurate signals: the price has crossed 50 MA.
MACD histogram is near the 0 mark.
The Stochastic Oscillator is located in the neutral zone, the %K line has crossed the %D line. There are no signals at the moment.
Trading recommendations
Support levels: 1.28750, 1.28400
Resistance levels: 1.29250, 1.29600, 1.30100
If the price fixes below 1.28750, expect quotes to fall toward 1.28500-1.28300.
Alternatively, the quotes could grow toward 1.29600-1.30000.
The USD/CAD currency pair
Technical indicators of the currency pair:
Prev Open: 1.32999
Open: 1.33168
% chg. over the last day: +0.05
Day’s range: 1.32950 – 1.33199
52 wk range: 1.2949 – 1.3566
The USD/CAD currency pair is in sideways movement. There is no defined trend. At the moment, the local support and resistance levels are at 1.32900 and 1.33250, respectively. Investors are waiting for additional drivers. Technical correction of USD/CAD quotes is not excluded in the nearest future. We recommend you to pay attention to the dynamics of black gold prices. Positions should be opened from key levels.
Publication of important economic releases from Canada is not planned.
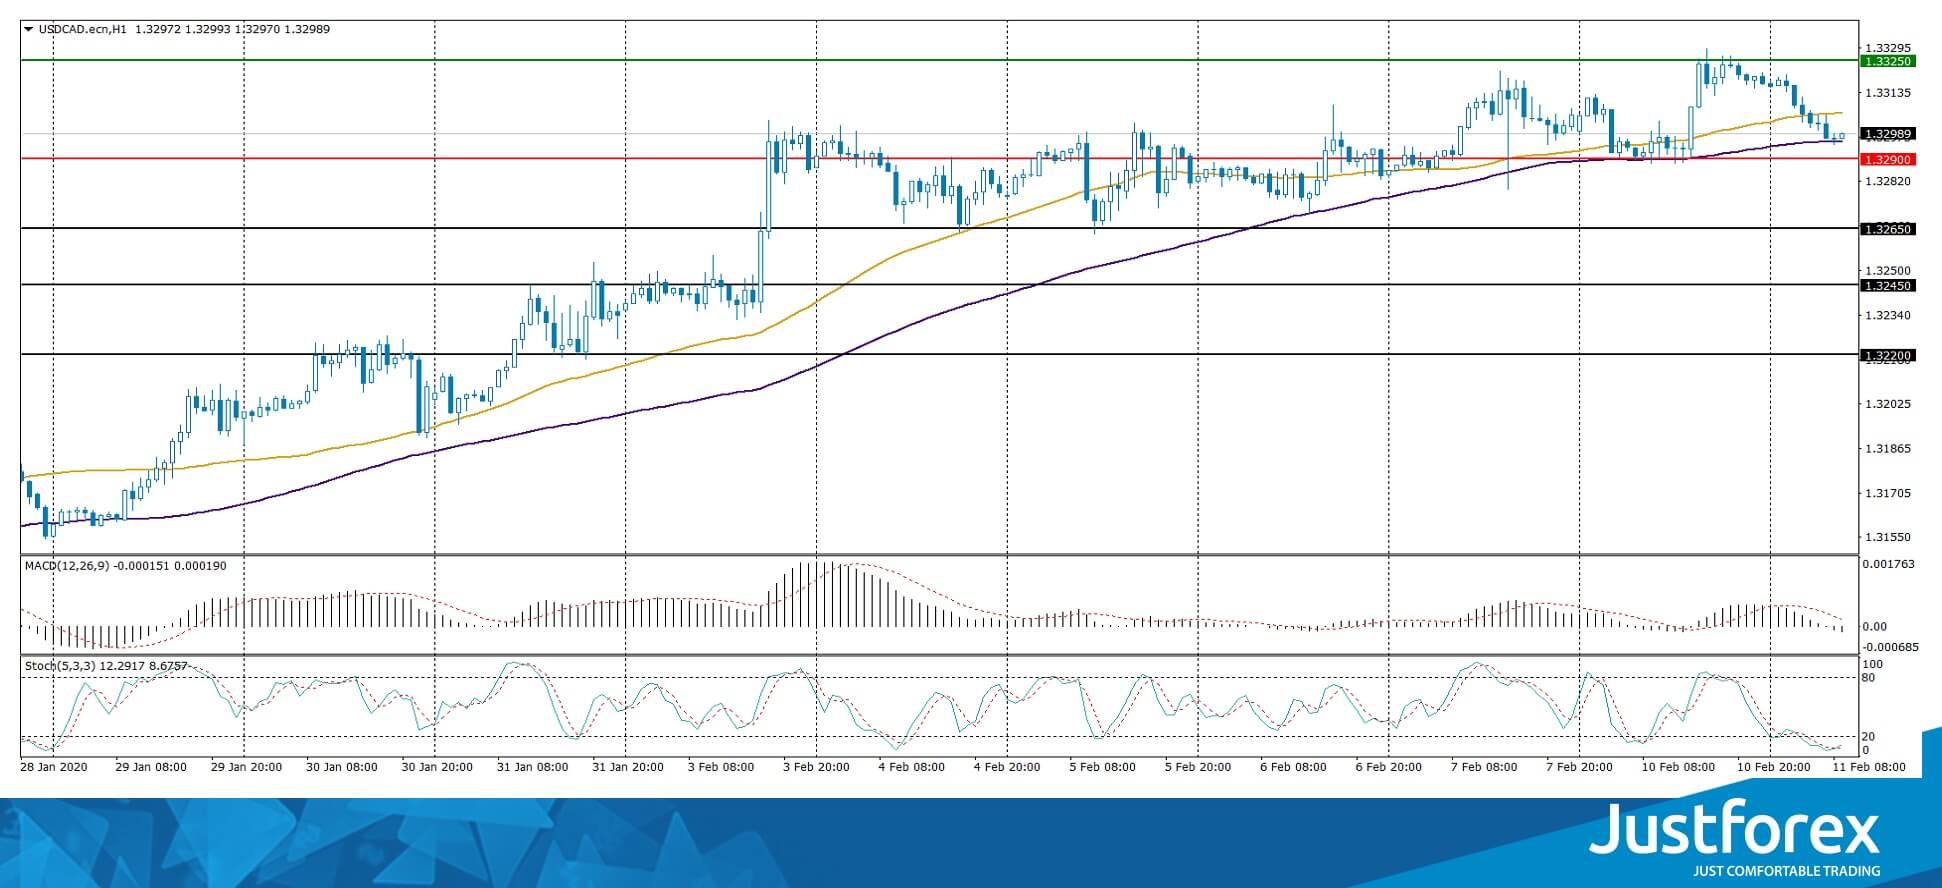
Indicators do not give accurate signals: the price has crossed 50 MA and 100 MA.
MACD histogram has gone down, which indicates a development of a correction movement.
The Stochastic Oscillator is located in the oversold area, the %K line has crossed the %D line. No signals at the moment.
Trading recommendations
Support levels: 1.32900, 1.32650, 1.32450
Resistance levels: 1.33250, 1.33500
If the price fixes above 1.33250, expect the quotes to grow toward 1.33500-1.33700.
Alternatively, the quotes could correct toward 1.32600-1.32400.
The USD/JPY currency pair
Technical indicators of the currency pair:
Prev Open: 109.678
Open: 109.746
% chg. over the last day: +0.14
Day’s range: 109.744 – 109.932
52 wk range: 104.45 – 113.53
The USD/JPY currency pair keeps consolidating. The technical picture is ambiguous. At the moment local support and resistance levels are at 109.700 and 110.000, respectively. The correction of the trading instrument is not ruled out in the nearest future. Today we recommend you to pay attention to the statements of the FOMC representatives, as well as to the dynamics of the US government securities yield. Positions should be opened from key levels.
Financial markets in Japan are closed due to the holiday.
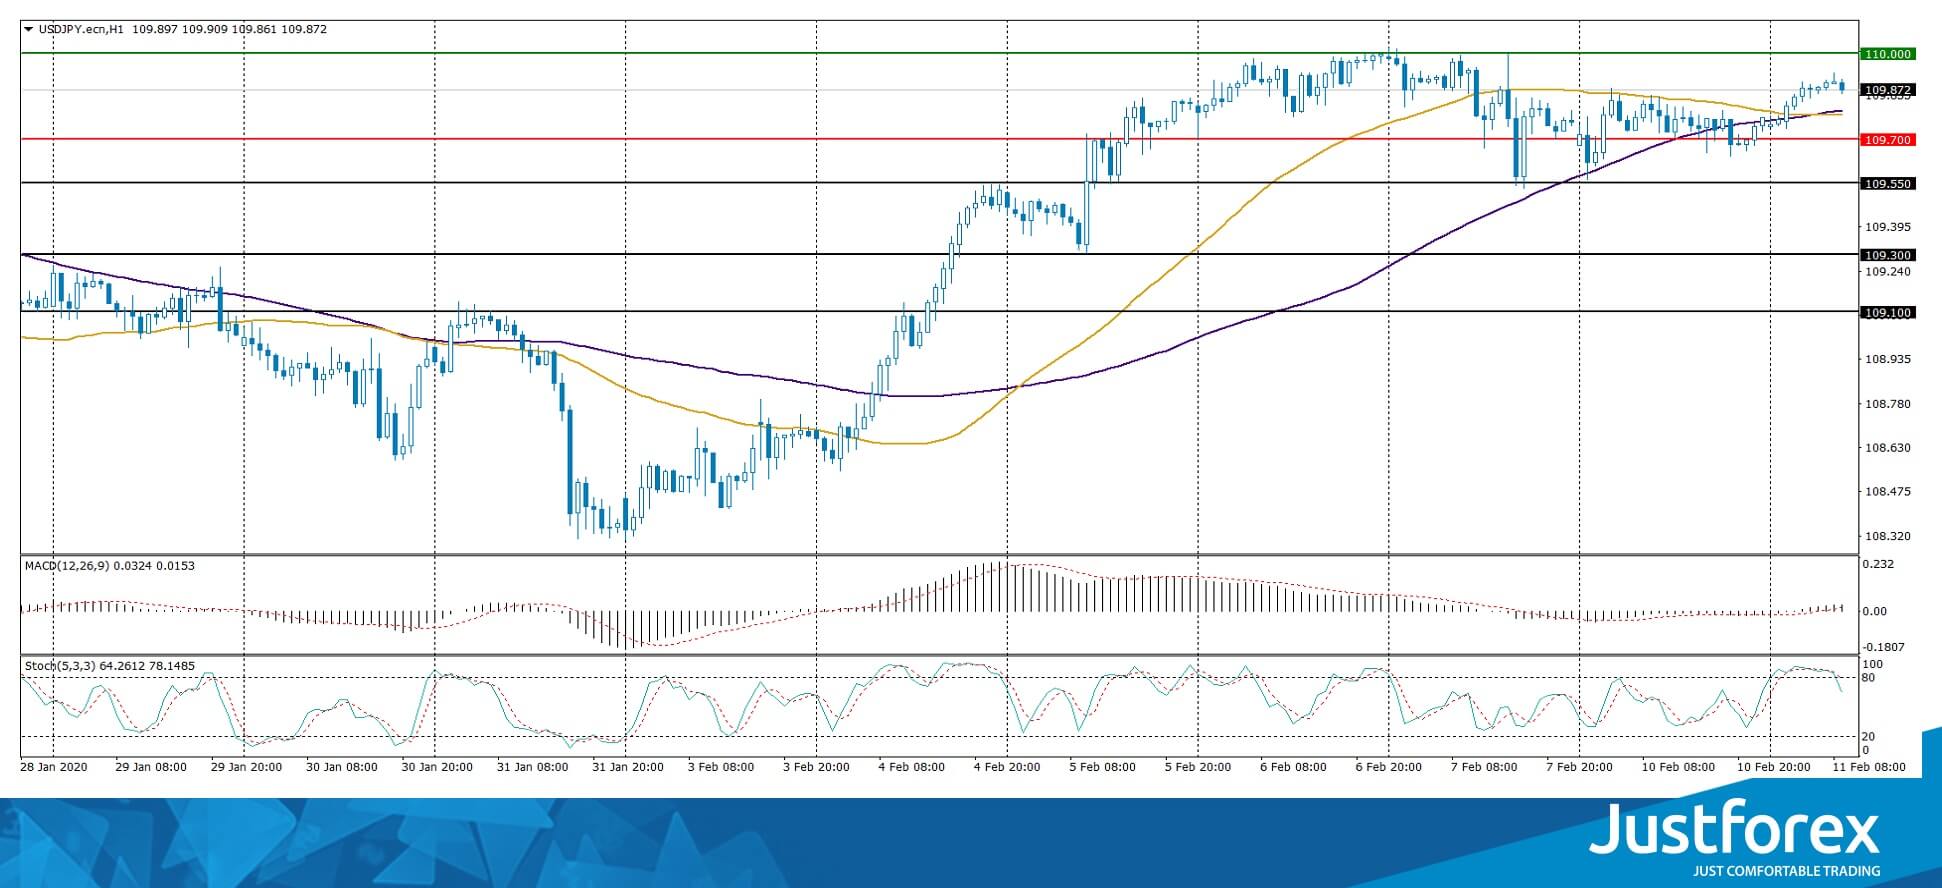
Indicators do not give an accurate signal: 50 MA crossed 100 MA.
The MACD histogram has crossed the positive zone, indicating bullish sentiments.
The Stochastic Oscillator is located in the overbought zone, the %K line crossed the %D line. No signals at the moment.
Trading recommendations
Support levels: 109.700, 109.550, 109.300
Resistance levels: 110.000, 110.250
If the price fixes above 110.000, expect further growth of USD/JPY quotes towards 110.250-110.400.
Alternatively, the USD/JPY pair may decline to 109.400-109.200.


