
The EUR/USD currency pair
Technical indicators of the currency pair:
Prev Open: 1.09107
Open: 1.09152
% chg. over the last day: +0.08
Day’s range: 1.09052 – 1.09209
52 wk range: 1.0879 – 1.1572
The EUR/USD currency pair has become stable after a prolonged fall. At the moment, the trading instrument is consolidating near the round level of 1.09000. The 1.09400 mark is the key resistance. In the near future, a technical correction of EUR/USD quotes is not ruled out. The Fed Chairman said that he expected continued purchases of treasury securities by his department in the second quarter of 2020. Jerome Powell believes that it is too early to draw conclusions about the effects of coronavirus on the US economy. We recommend opening positions from key levels.
Today, the news feed is calm enough.
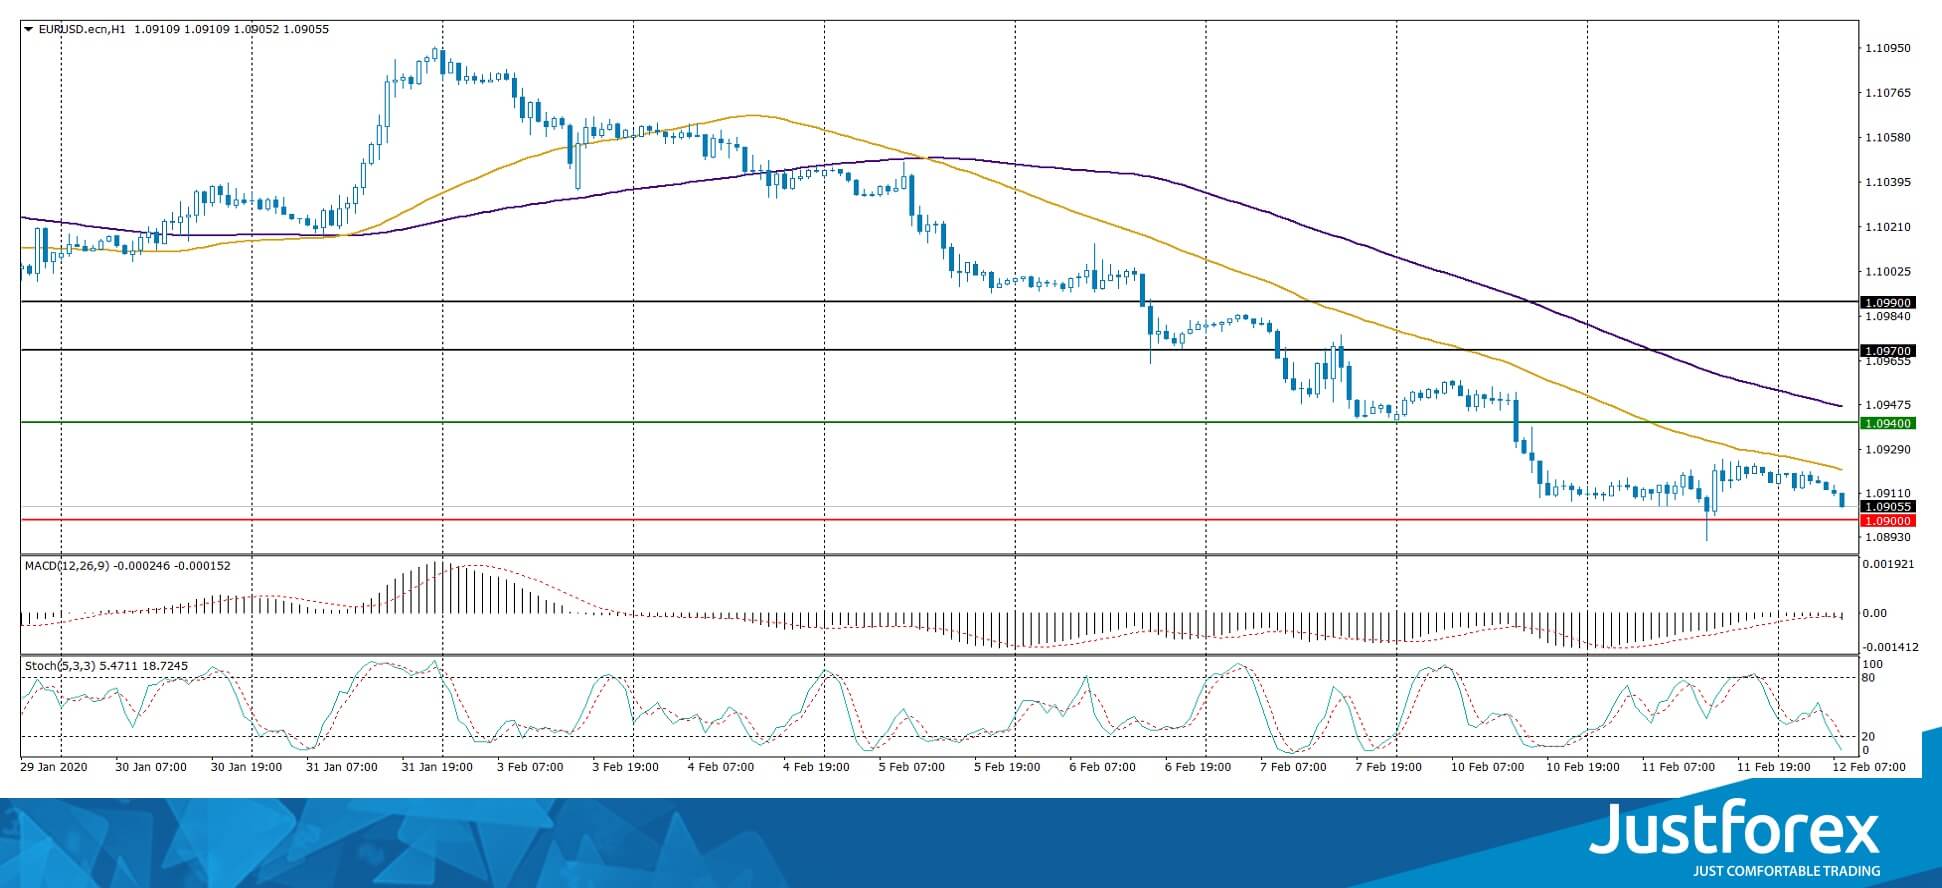
Indicators signal the power of sellers: the price has fixed below 50 MA and 100 MA.
The MACD histogram is in the negative zone, indicating the bearish sentiment.
Stochastic Oscillator is in the oversold zone, the %K line is below the %D line, which gives a weak signal to sell EUR/USD.
Trading recommendations
Support levels: 1.09000, 1.08700
Resistance levels: 1.09400, 1.09700, 1.09900
If the price fixes below the round level of 1.09000, a further drop in the EUR/USD quotes is expected. The movement is tending to 1.08700-1.08500.
An alternative could be the growth of the EUR/USD currency pair to 1.09700-1.09900.
The GBP/USD currency pair
Technical indicators of the currency pair:
Prev Open: 1.29148
Open: 1.29518
% chg. over the last day: +0.32
Day’s range: 1.29484 – 1.29689
52 wk range: 1.1959 – 1.3516
GBP/USD quotes are recovering. A trading instrument has reached local highs. Yesterday, Great Britain published a series of optimistic economic releases, which supports sterling. At the moment, the GBP/USD currency pair is consolidating in the range of 1.29200-1.2970. The technical pattern signals a further correction of the pound against the US dollar. Positions should be opened from key levels.
The news feed on the UK economy is fairly calm.
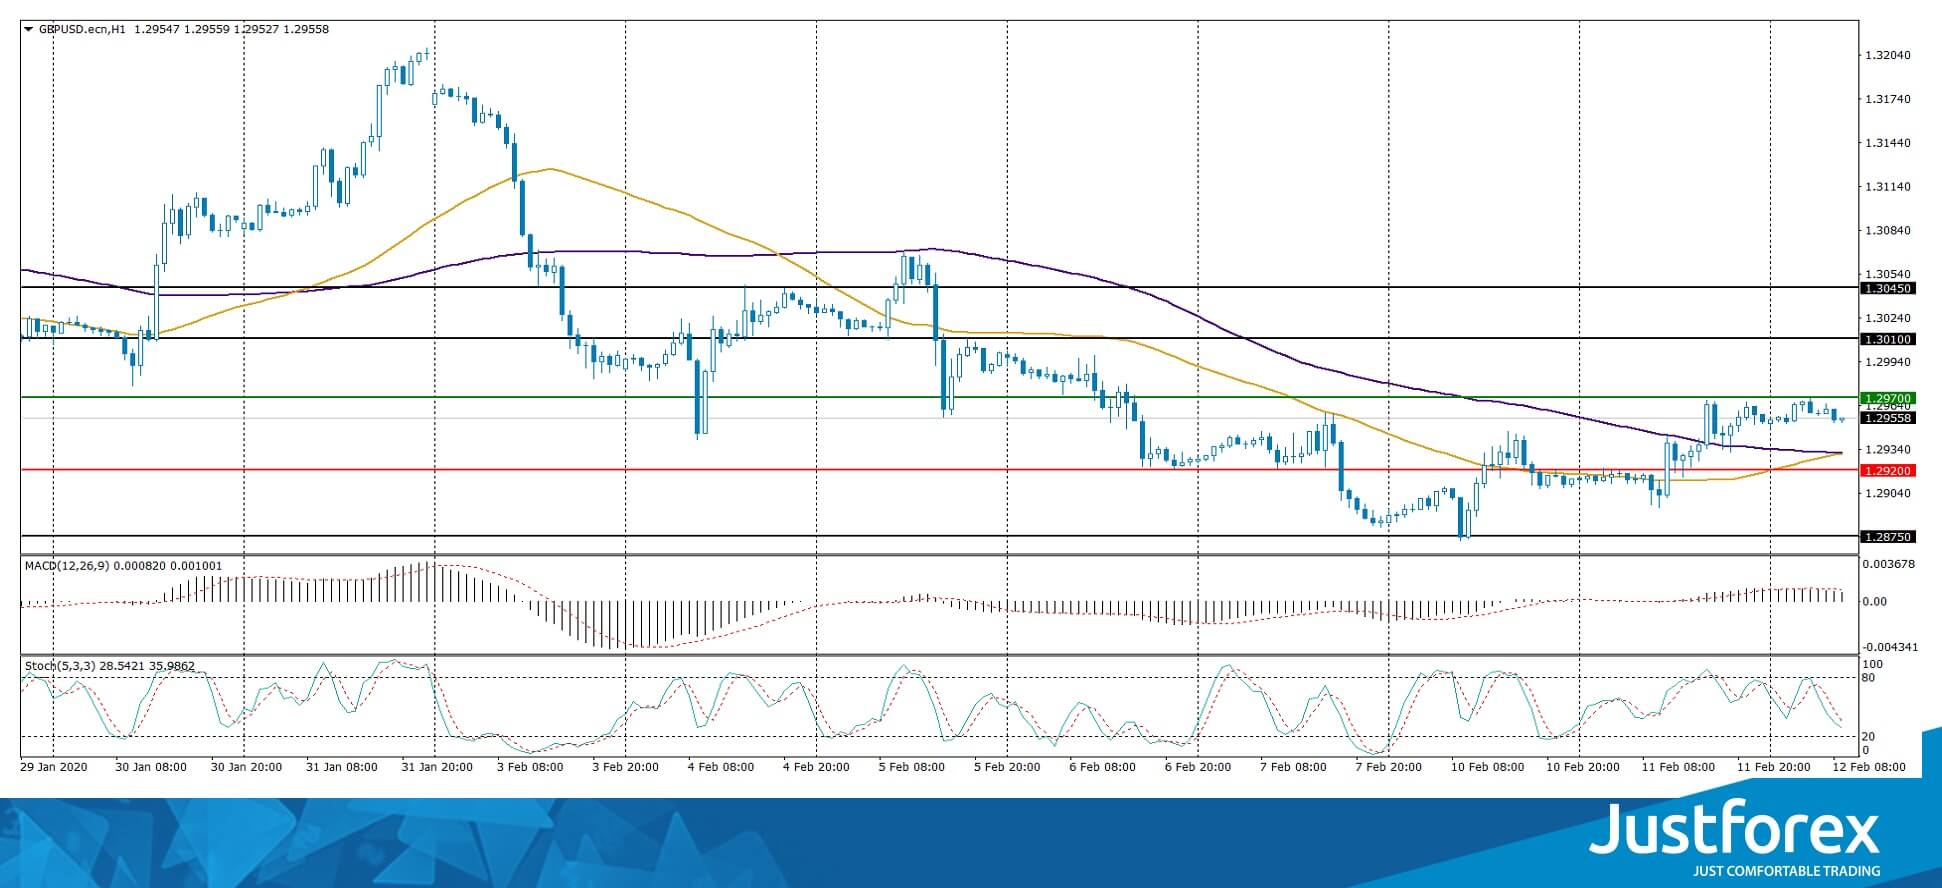
Indicators do not give accurate signals: 50 MA has crossed 100 MA.
The MACD histogram has moved into the positive zone, indicating the bullish sentiment.
Stochastic Oscillator is in the neutral zone, the %K line is below the %D line, which gives a signal to sell GBP/USD.
Trading recommendations
Support levels: 1.29200, 1.28750, 1.28400
Resistance levels: 1.29700, 1.30100, 1.30450
If the price fixes above 1.29700, further growth of GBP/USD quotes is expected. The movement is tending to 1.30100-1.30400.
An alternative could be a decrease in the GBP/USD currency pair to 1.28800-1.28600.
The USD/CAD currency pair
Technical indicators of the currency pair:
Prev Open: 1.33168
Open: 1.32870
% chg. over the last day: -0.19
Day’s range: 1.32774 – 1.32958
52 wk range: 1.2949 – 1.3566
The USD/CAD currency pair has been declining after a prolonged consolidation. Quotes have updated local lows. At the moment, the following key support and resistance levels can be identified: 1.32650 and 1.33000, respectively. Loonie has the potential for further growth. The recovery of oil quotes supports the Canadian dollar. Positions should be opened from key levels.
The publication of important economic releases from Canada is not planned.
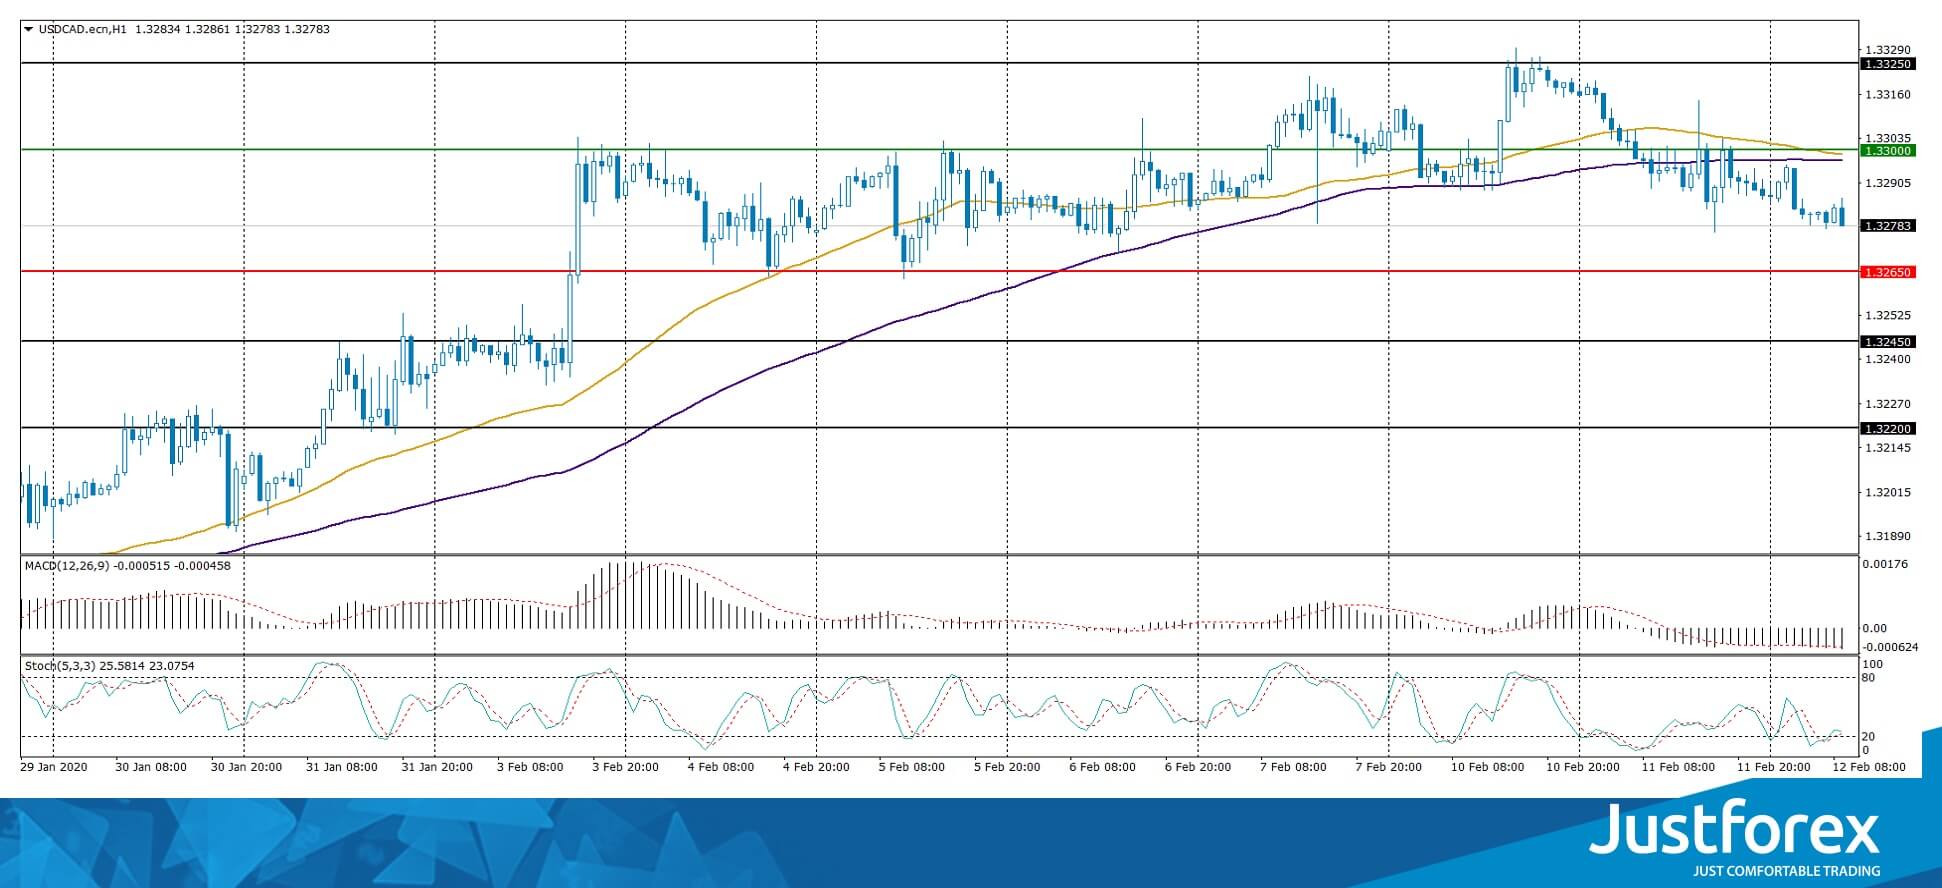
Indicators do not give accurate signals: 50 MA has crossed 100 MA.
The MACD histogram is in the negative zone, indicating the bearish sentiment.
Stochastic Oscillator is in the neutral zone, the %K line has crossed the %D line. There are no signals at the moment.
Trading recommendations
Support levels: 1.32650, 1.32450, 1.32200
Resistance levels: 1.33000, 1.33250
If the price fixes below 1.32650, USD/CAD quotes are expected to correct. The movement is tending to 1.32450-1.32200.
An alternative could be the growth of the USD/CAD currency pair to 1.33200-1.33400.
The USD/JPY currency pair
Technical indicators of the currency pair:
Prev Open: 109.746
Open: 109.783
% chg. over the last day: +0.01
Day’s range: 109.766 – 109.923
52 wk range: 104.45 – 113.53
The USD/JPY currency pair is being traded in a flat. There is no defined trend. The local support and resistance levels are 109.700 and 110.000, respectively. In the near future, technical correction of the trading instrument is not ruled out. Investors continue to assess the risks of further spread of the epidemic from China. We recommend paying attention to the dynamics of US government bonds yield. Positions should be opened from key levels.
The news feed on Japan’s economy is calm.
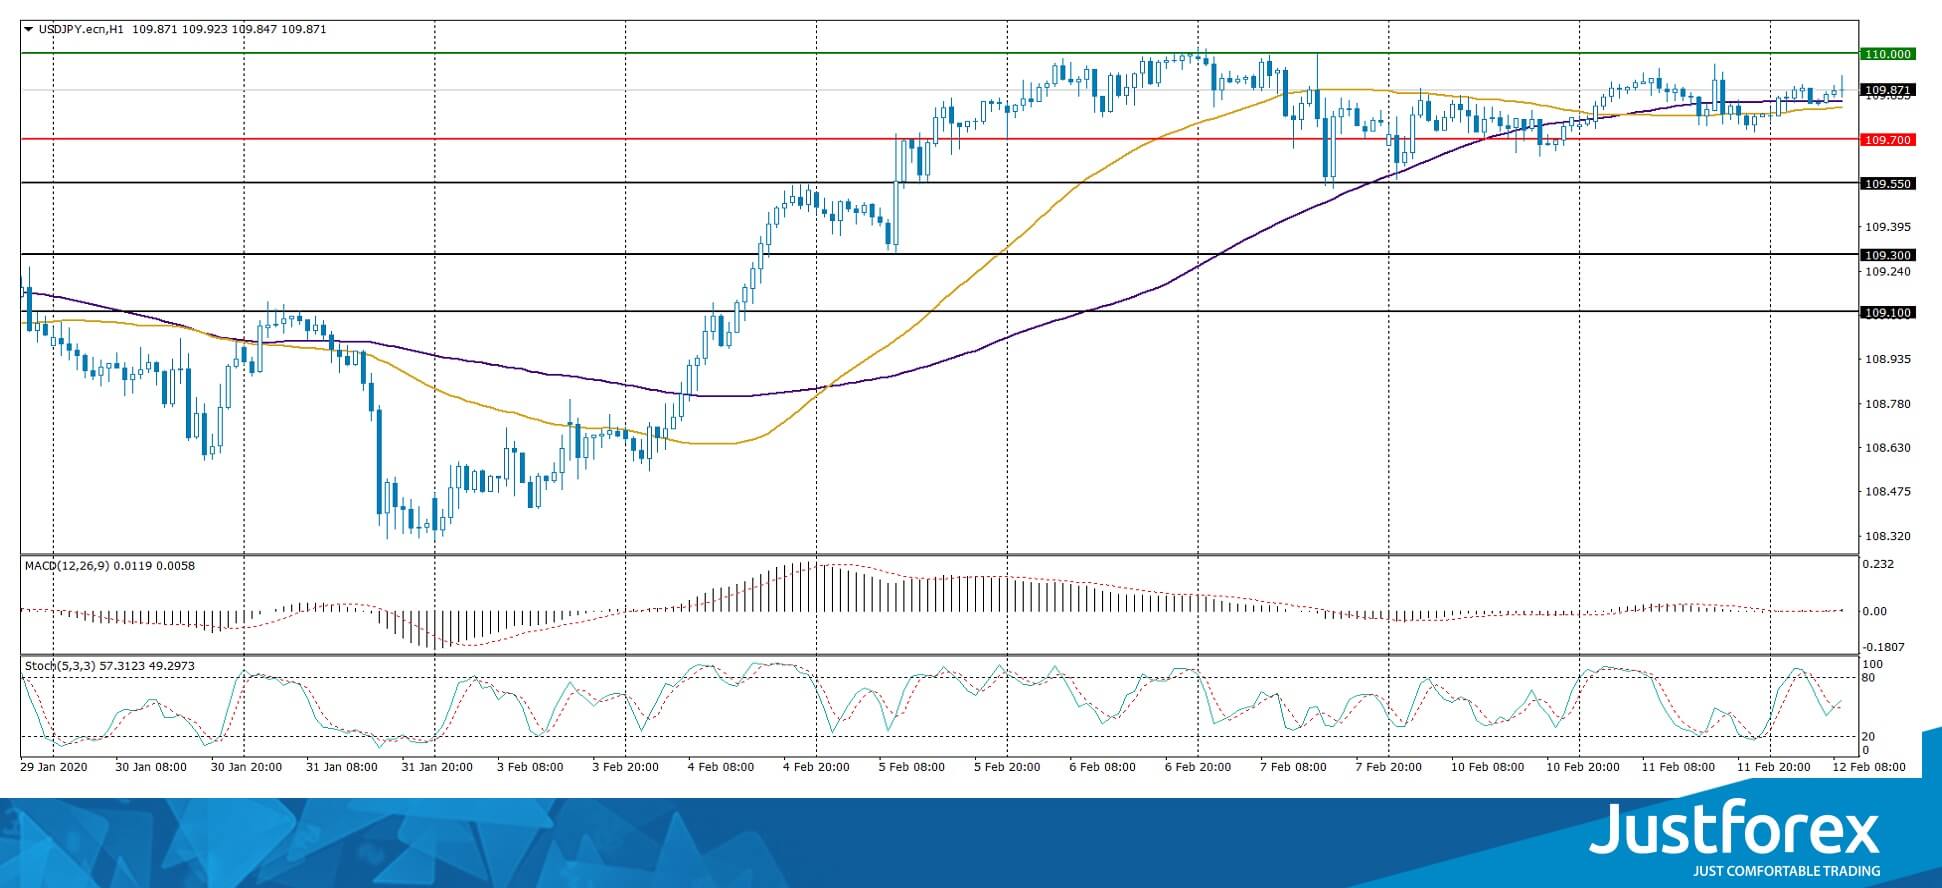
Indicators do not give accurate signals: 50 MA has crossed 100 MA.
The MACD histogram is near the 0 mark. There are no signals at the moment.
Stochastic Oscillator is in the neutral zone, the %K line has crossed the %D line. There are no signals at the moment.
Trading recommendations
Support levels: 109.700, 109.550, 109.300
Resistance levels: 110.000, 110.250
If the price fixes above 110,000, further growth of USD/JPY quotes is expected. The movement is tending to 110.250-110.400.
An alternative could be a decrease in the USD/JPY currency pair to 109.400-109.200.


