During last week’s trading sessions, the New Zealand Dollar declined by 1.65% in value against the Canadian Dollar. The currency pair was pressured south by the 50– and 100– hour SMAs.
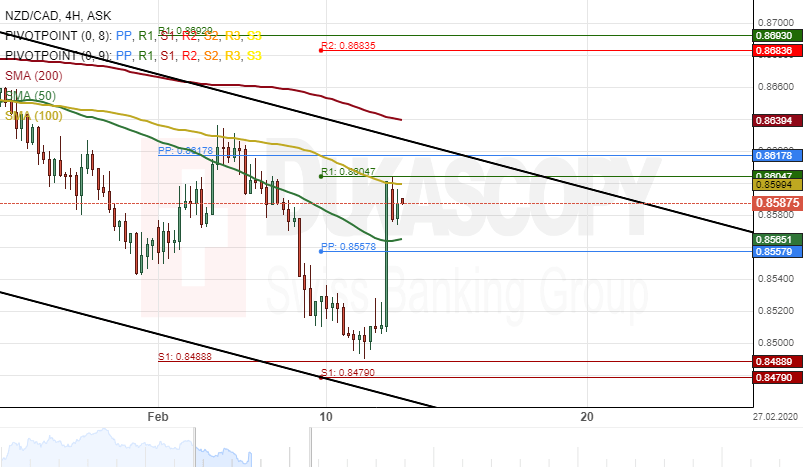
The exchange rate made a U-turn north from a support cluster formed by the weekly S1 and the monthly S2 at 0.8488 during yesterday’s trading session.
All things being equal, the NZD/CAD pair will most likely continue to trade bullish within this week’s trading sessions.
However, a resistance cluster at 0.8617 could provide resistance for the currency exchange rate in the shorter term