
A note on lower timeframe confirming price action…
Waiting for lower timeframe confirmation is our main tool to confirm strength within higher timeframe zones, and has really been the key to our trading success. It takes a little time to understand the subtle nuances, however, as each trade is never the same, but once you master the rhythm so to speak, you will be saved from countless unnecessary losing trades. The following is a list of what we look for:
- A break/retest of supply or demand dependent on which way you’re trading.
- A trendline break/retest.
- Buying/selling tails … essentially we look for a cluster of very obvious spikes off of lower timeframe support and resistance levels within the higher timeframe zone.
- Candlestick patterns. We tend to only stick with pin bars and engulfing bars as these have proven to be the most effective.
We typically search for lower-timeframe confirmation between the M15 and H1 timeframes, since most of our higher-timeframe areas begin with the H4. Stops are usually placed 1-3 pips beyond confirming structures.
EUR/USD
Weekly gain/loss: + 65 pips
Weekly closing price: 1.1465
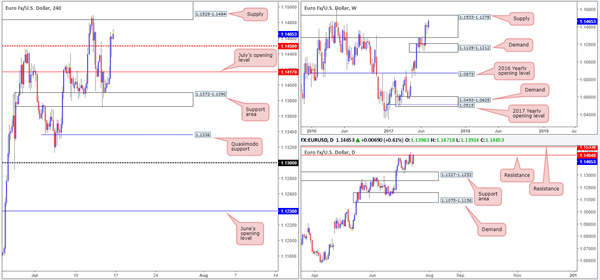
EUR/USD bulls gravitated higher last week despite weekly price being positioned within the walls of a major supply drawn from 1.1533-1.1278, which has capped upside since May 2015. This is the highest we’ve seen the single currency close since mid-Feb 2015, thus possibly signifying that the bears could be under serious pressure here!
Daily resistance at 1.1464, however, remains in play. This line boasts strong historical significance, managing to cap upside multiple times during the past couple of years, often delivering to-the-pip reactions! Should the bulls overcome this line this week, they’ll likely attempt an approach to a daily resistance level seen pegged at 1.1533, essentially denoting the upper edge of the said weekly supply.
A brief look at recent dealings on the H4 timeframe shows that price managed to find a strong pocket of bids around the support area marked at 1.1372-1.1390, and end the week closing above a mid-level resistance at 1.1450. The move was strongly influenced after US inflation and retail sales figures missed consensus, therefore sending the dollar lower and the EUR higher.
For those who have been following recent reports on the EUR/USD you may recall that our desk took a short from 1.1484. 50% of the position was liquidated around July’s opening level at 1.1417, with the remaining 50% left in the market to target the H4 Quasimodo support level at 1.1336: seen placed just nine pips above the top edge of a daily support area 1.1327-1.1253. Given Friday’s news and the strong close above 1.1450, we decided to close the remainder of our position at 1.1460.
Our suggestions: Although weekly price shows the bulls to have the upper hand right now, it would be unwise of us to disregard the fact that the aforementioned weekly supply is still in motion. What’s more, daily resistance at 1.1464 and the nearby H4 supply seen at 1.1529-1.1484 has yet to be breached. Therefore, for us, the bears still have a hand in this fight until proven otherwise.
With the above taken into account, we will be watching the said H4 supply base for shorts again this week. However, instead of entering using a pending order as we did last time, we will be waiting for H4 candle confirmation in the shape of a full, or near-full-bodied bearish candle, before pulling the trigger.
Data points to consider: No high-impacting events on the docket today.
Levels to watch/live orders:
- Buys: Flat (stop loss: N/A).
- Sells: 1.1529-1.1484 ([waiting for a H4 bearish candle – preferably in the form of a full, or near-full-bodied candle – is advised] stop loss: ideally beyond the candle’s wick).
GBP/USD:
Weekly gain/loss: + 218 pips
Weekly closing price: 1.3101
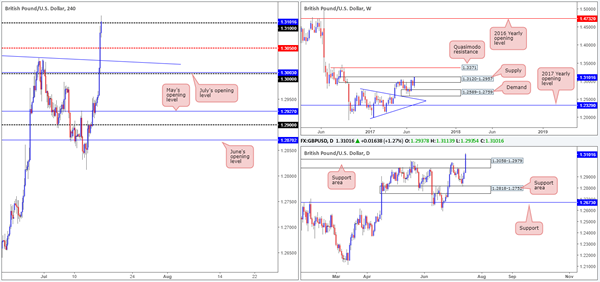
Looking at the weekly timeframe, it’s clear to see that a strong succession of bids flowed into the market last week, consequently forming a near-full-bodied weekly candle within supply at 1.3120-1.2957. Assuming that the bulls continue to govern direction here, this could lead to a move being seen up to a Quasimodo resistance level coming in at 1.3371.
Recent action on the daily timeframe, nevertheless, shows price recently crossed above a resistance area at 1.3058-1.2979. Technically speaking, this could potentially stimulate another round of buying this week up to supply drawn from 1.3278-1.3179 (not seen on the screen).
A quick recap of Friday’s trade on the H4 timeframe shows that the GBP/USD received a sharp boost of buying, following lower-than-expected US inflation and retail sales numbers. The move, as you can see, pushed price above multiple tech resistances and ended the week closing marginally above the 1.31 handle.
To our way of seeing things, 1.31 is a key level to keep an eye on today. Should the market reject this number, it could imply that the bears may make an appearance within the current weekly supply. A decisive H4 close above this psychological boundary, nonetheless, would likely suggest that the unit could be heading up to a H4 resistance derived from 1.3172 (not seen on the screen), located seven pips below the daily supply mentioned above at 1.3278-1.3179.
Our suggestions: Keep a close eye on 1.31 today as it could play a decisive role in where this market may be headed today/ this week.
A decisive H4 close above 1.31 followed up with a retest and a H4 bull candle (preferably a full, or near-full-bodied candle) would be enough evidence for us to consider a long, targeting 1.3172.
A rejection of 1.31, however, would likely call for a move back down to the top edge of the recently broken daily resistance area at 1.3058/mid-level support at 1.3050. This could be an option should one be able to pin down an entry with a small enough stop to accommodate sufficient risk/reward.
Personally, we prefer looking for longs above 1.31 since risk/reward will likely be much better.
Data points to consider: No high-impacting events on the docket today.
Levels to watch/live orders:
- Buys: Watch for H4 price to print a decisive engulf above 1.31 and then look to trade any retest seen thereafter ([waiting for a H4 bullish candle – preferably in the form of a full, or near-full-bodied candle – to form following the retest is advised] stop loss: ideally beyond the candle’s tail).
- Sells: Flat (stop loss: N/A).
AUD/USD
Weekly gain/loss: + 221 pips
Weekly closing price: 0.7824
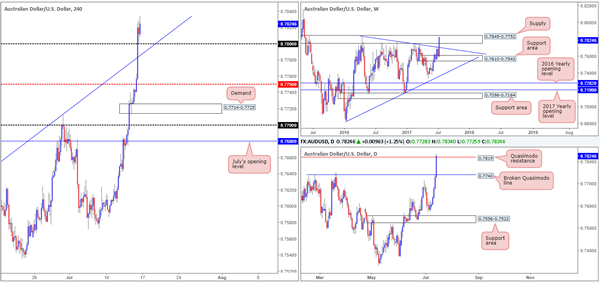
A stronger-than-expected rebound was seen from the weekly support area at 0.7610-0.7543 last week, resulting in weekly price running through the trendline resistance extended from the high 0.7835 and aggressively challenging the weekly supply zone seen at 0.7849-0.7752.
Over on the daily picture, we can see that the commodity currency edged its way slightly above a daily Quasimodo resistance at 0.7819 by the week’s close. Despite the strong bullish close seen here, we would not consider this line to be engulfed until the apex of the Quasimodo formation has been taken out at 0.7849, which also represents the top edge of the aforementioned weekly supply.
Influenced by Friday’s weak US inflation and retails sales data, H4 action rallied through the 0.78 handle and, as you can see, was quickly retested as support. Given that the number held into the week’s end, there’s a chance that we could witness further buying up to a resistance level pegged at 0.7870.
Our suggestions: Seeing as weekly price is still trading within supply, and daily flow is seen interacting with a Quasimodo resistance, our team is wary of taking any long positions above 0.78 at the moment despite room being seen on the H4 timeframe to punch higher. To that end, opting to stand on the sidelines here may be the best path to take today.
Data points to consider: Chinese growth figures and Industrial production data is scheduled to be released at 3am GMT+1.
Levels to watch/live orders:
- Buys: Flat (stop loss: N/A).
- Sells: Flat (stop loss: N/A).
USD/JPY
Weekly gain/loss: – 139 pips
Weekly closing price: 112.51
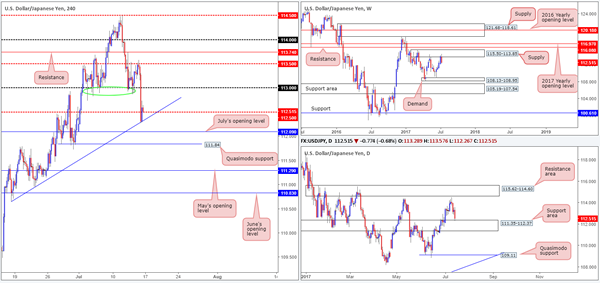
Following a four-week bullish phase, last week saw the bears stamp in a strong-looking weekly bearish candle from the underside of a weekly supply zone at 115.50-113.85. In the case that the bears continue to push things south from here, the next area of interest on the weekly scale is 108.13-108.95: a demand zone that supported price beautifully mid-way through the month of June.
Bouncing down to the daily timeframe, we can see that the weekly bears have some stiff opposition! Holding firm since late January 2017, the daily support area at 111.35-112.37 was recently brought into play on Friday. Considering the established history surrounding this zone, there’s a solid possibility the bulls will attempt to come into the market here.
Zooming in for a closer look at price action on the H4 timeframe, Friday’s selloff, influenced by weak US inflation and retail sales figures, saw the 113 handle and the mid-level support at 112.50 consumed, and a H4 trendline support extended from the low 110.64 brought into play. The pair ended the day closing marginally above 112.50, likely helped by the reaction seen from the top edge of the daily support area at 112.37.
Our suggestions: Buying from 112.50 seems a logical idea if one dismisses the weekly timeframe. The next target from 112.50 is likely to be the 113 band given how well it served as support since the beginning of the month (see green circle).
While it is tempting to pull the trigger and buy from 112.50, our team is reluctant to commit, due to where weekly price is positioned at the moment (see above). In regard to selling this market, we’re also hesitant. This is obviously because of the daily support area in motion and how restricted H4 structure is right now: July’s opening level seen nearby at 112.09, followed closely by the Quasimodo support level at 111.84.
Data points to consider: No high-impacting events on the docket today. Japanese banks will be closed in observance of Marine Day.
Levels to watch/live orders:
- Buys: Flat (stop loss: N/A).
- Sells: Flat (stop loss: N/A).
USD/CAD:
Weekly gain/loss: – 229 pips
Weekly closing price: 1.2648
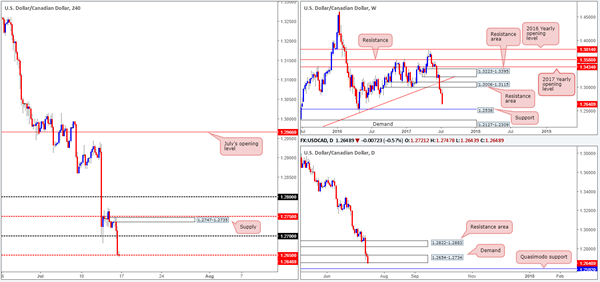
Last week’s sharp run to the downside pushed the USD/CAD into further losses, stripping close to 230 pips off its value. The next area of support on the weekly timeframe does not come into view until we reach 1.2538, thus the odds of further selling being seen this week, in our opinion, is relatively high.
Turning our attention to the daily candles, demand at 1.2654-1.2734 suffered a minor breach going into the week’s close in the shape of a full-bodied bearish candle. Assuming that the bears remain dominant beneath this zone, it’s likely that we’ll see price cross swords with a Quasimodo support level coming in at 1.2592 sometime this week.
Looking over to the H4 timeframe, the week ended printing a strong full-bodied bearish candle a few pips below the mid-level support at 1.2650. With this number likely under pressure, we see little reason, from a technical perspective, why the market will not attempt to approach the 1.26 handle (not seen on the screen).
With stop-loss orders likely getting chewed up from beneath the current daily demand at the moment, alongside breakout sellers’ orders, a bounce from the 1.2595/1.26 neighborhood is likely to take shape. How much of a bounce is difficult to judge though, since you would be effectively buying into strong weekly selling!
Our suggestions: Should you feel 1.2592/1.26 is worthy of attention, we would strongly recommend waiting for additional confirmation here either in the form of a H4 bull candle or using the lower-timeframe candles (see above for information on how we look for this) before pulling the trigger.
Data points to consider: No high-impacting events on the docket today.
Levels to watch/live orders:
- Buys: 1.2592/1.26 (possible area to hunt for long opportunities).
- Sells: Flat (Stop loss: N/A).
USD/CHF:
Weekly gain/loss: – 10 pips
Weekly closing price: 0.9629
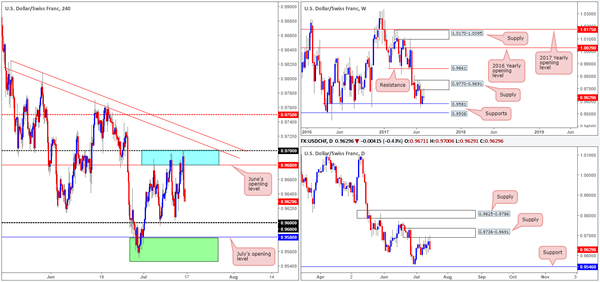
Weekly price, as you can probably see, remains capped by a supply at 0.9770-0.9691 and a support formed at 0.9581. Beyond the supply zone, we can see little stopping price from reaching the resistance level seen at 0.9861, and beneath the current support, there’s a nearby level planted at 0.9508 that will likely be challenged should the bears come into this market.
In conjunction with the weekly timeframe, there’s also a partner supply seen glued around the underside of the said weekly zone on the daily timeframe at 0.9736-0.9691 that’s in play. Should this area continue to hold firm, then the next level of support does not come into view until we reach 0.9546.
Since the 5th May, the H4 candles have been consolidating between 0.97/0.9680 (round number/June’s opening level – blue zone) and the 0.96 handle.
With this in mind, we remain interested in the two following zones for potential trades:
The first is the blue resistance zone mentioned above at 0.97/0.9680. We’ve selected this area since not only is this barrier lodged around the underside of the said weekly supply, but also its partner supply seen on the daily timeframe.
The second zone is a support area marked in green comprised of a daily support at 0.9546 and the weekly support at 0.9581, which also happens to converge closely with July’s opening level at 0.9580.
Our suggestions: To initiate a trade at either of the above noted zones, nevertheless, we would require H4 candle confirmation, preferably in the shape of a full, or near-full-bodied candle. This is just a way to confirm that there are other speculators interested in the same zone as we are!
Data points to consider: No high-impacting events on the docket today.
Levels to watch/live orders:
- Buys: 0.9546/0.9581 ([waiting for a H4 bull candle – preferably a full, or near full-bodied candle – to form is advised] stop loss: ideally beyond the candle’s tail).
- Sells: 0.97/0.9680 ([waiting for a H4 bear candle – preferably a full, or near full-bodied candle – to form is advised] stop loss: ideally beyond the candle’s wick).
DOW 30:
Weekly gain/loss: + 229 points
Weekly closing price: 21645
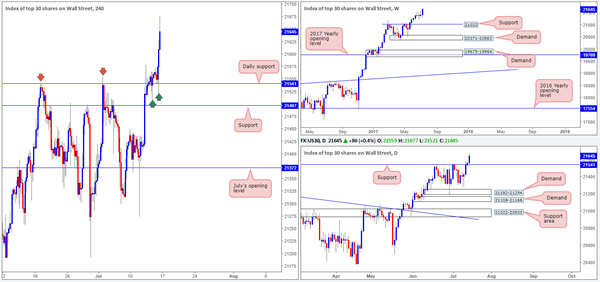
US equity prices pushed to a record high of 21677 last week, which led to a strong-looking bullish candle forming. From the weekly timeframe, it is clear to see that this market’s underlying trend remains strong. However, should the index pullback, the support level drawn from 21022 is likely the area where we’ll see the bulls make an appearance.
Looking down to the daily timeframe, nevertheless, we can see that price recently crossed above the resistance level pegged at 21541, which technically speaking, should now act as a support barrier if it is retested.
There’s not much information we can glean from the H4 timeframe that we have not already done so from the higher timeframes. Therefore, the aforementioned daily support level will likely be the first port of call should the market pullback this week.
Our suggestions: Put simply, our team wants to see the daily support level mentioned above at 21541 retested today/this week. This – coupled with a reasonably sized H4 bull candle, preferably a full, or near-full-bodied candle, would be enough evidence for us to confirm a long position as valid.
Data points to consider: No high-impacting events on the docket today.
Levels to watch/live orders:
- Buys: 21541 ([waiting for a H4 bull candle – preferably a full, or near full-bodied candle – to form is advised] stop loss: ideally beyond the candle’s tail).
- Sells: Flat (stop loss: N/A).
GOLD
Weekly gain/loss: + $16.5
Weekly closing price: 1228.6
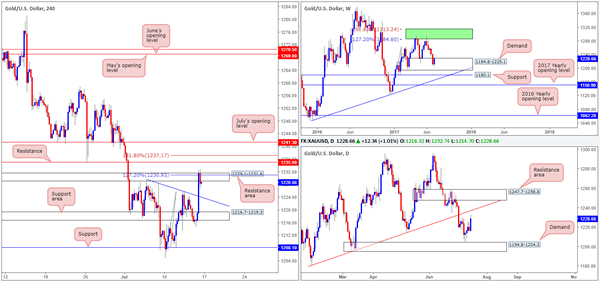
After diving relatively deep into weekly demand, the bulls slammed on the breaks last week and reversed price, erasing around 70% of the prior week’s losses in the process. According to the weekly timeframe, there’s space for the candles to rally back up to an area comprised of two weekly Fibonacci extensions 161.8/127.2% at 1313.7/1285.2 taken from the low 1188.1 (green zone).
On the daily timeframe, nonetheless, price is currently seen trading within a stone’s throw away from a trendline resistance extended from the low 1180.4, followed closely by a resistance area pegged at 1247.7-1258.8.
Across on the H4 timeframe, the resistance area at 1229.1-1231.6, which converges with a 127.2% Fib ext. point at 1230.9 taken from the low 1208.1, is currently in play. To our way of seeing things, this area looks vulnerable to the upside. The next line beyond this zone sits nearby at 1235.0: a resistance level that happens to fuse nicely with a 161.8% Fib ext. point at 1237.1 taken from the low 1208.1.
Our suggestions: This is quite a tricky market to judge at the moment. On the one hand we have weekly price suggesting to buy the metal, and on the other hand, we have daily and H4 price nearing reasonably strong resistances!
Therefore, whichever way one choses you’ll be trading against higher-timeframe structure. For now, we feel the best route one can take is to remain on the sidelines here until we have all three timeframes trading in unison.
Levels to watch/live orders:
- Buys: Flat (stop loss: N/A).
- Sells: Flat (stop loss: N/A).


