
The EUR/USD currency pair
Technical indicators of the currency pair:
Prev Open: 1.11783
Open:: 1.10070
% chg. over the last day: -1.48
Day’s range: 1.09657 – 1.10450
52 wk range: 1.0879 – 1.1572
The EUR/USD currency pair has moved down. Yesterday the drop in quotes exceeded 170 points. The trading instrument has set new local lows. The demand for USD grew after Donald Trump’s statements. The US president promised to provide emergency financial aid to the population, to postpone tax payments and to provide new credit incentives. Currently, EUR/USD quotes are consolidating in the range 1.09550-1.10600. The can decline further. Open positions from key levels.
The Economic News Feed for 18.03.2020:
Inflation Report (EU) – 12:00 (GMT+2:00);
Real Estate Market Report (USA) – 14:30 (GMT+2:00);
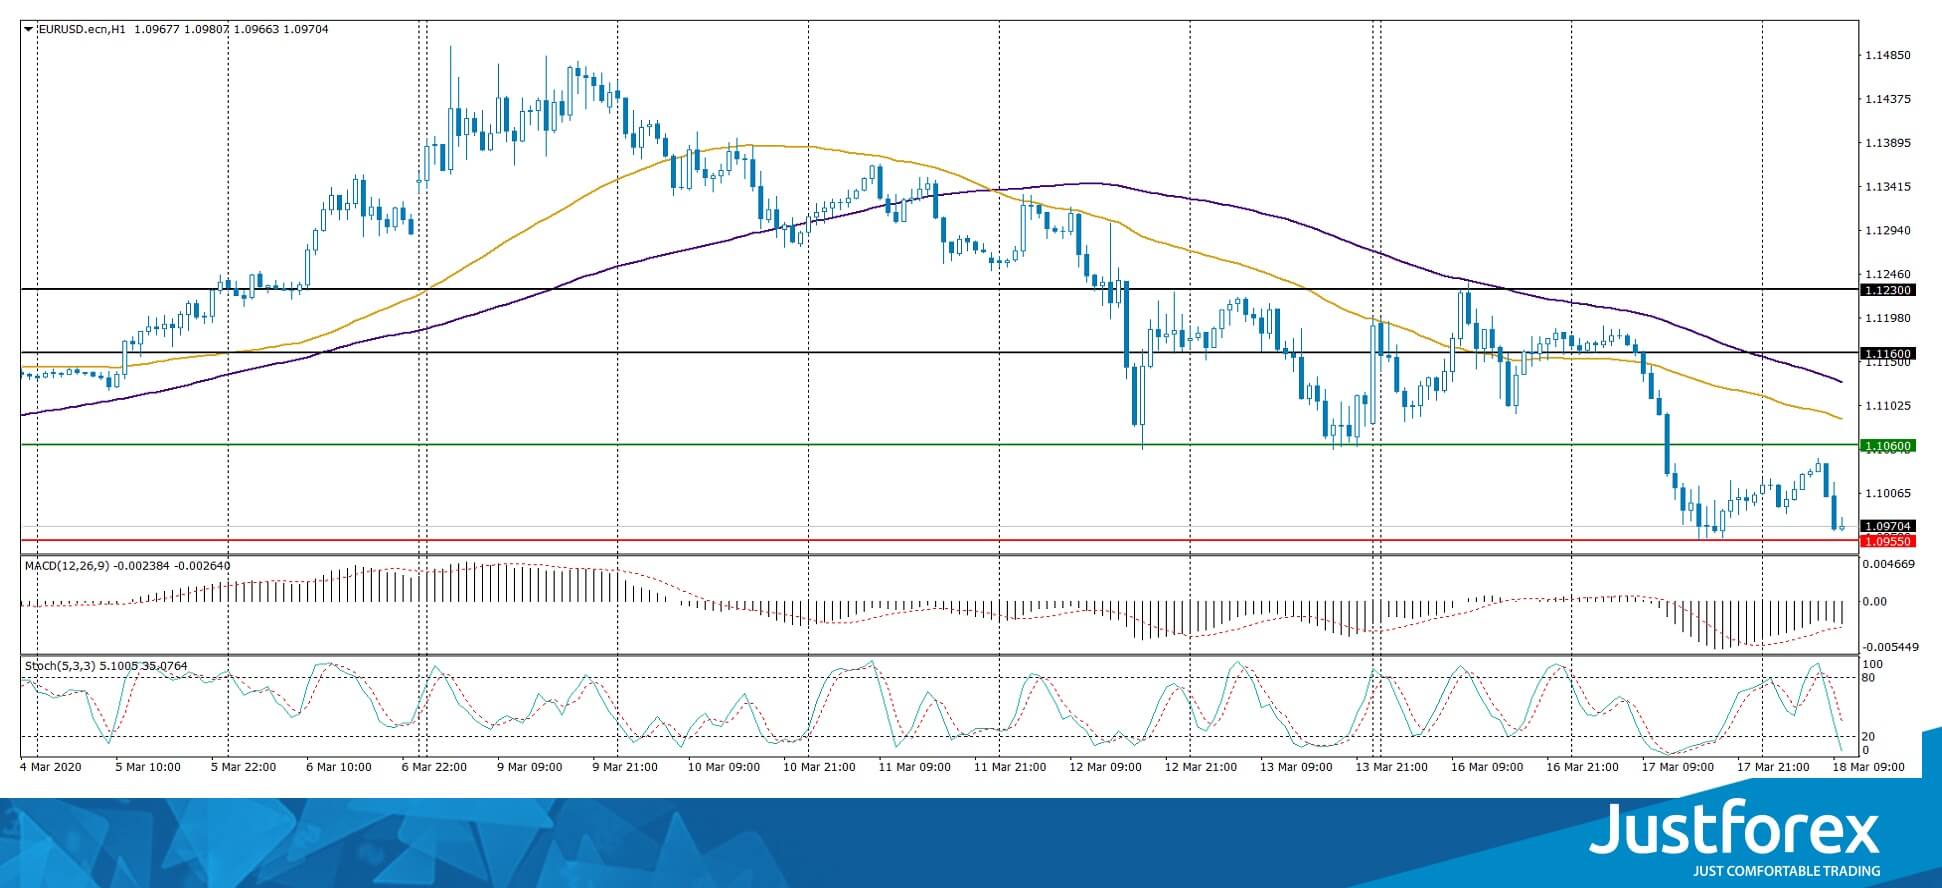
The indicators signal the sellers’ power: the price has fixed below 50 MA and 100 MA.
The MACD histogram is in the negative zone, indicating a bearish sentiment.
The Stochastic Oscillator is in the neutral zone, the %K line is below the %D line, which gives a sell signal for EUR/USD.
Trading recommendations
Support levels: 1.09550, 1.09000
Resistance levels: 1.10600, 1.11600, 1.12300
If the price fixes below 1.09550, expect further decline of EUR/USD to the round level 1.09000.
Alternatively, the quotes could recover toward 1.09000.
The GBP/USD currency pair
Technical indicators of the currency pair:
Prev Open: 1.22688
Open: 1.20594
% chg. over the last day: -1.23
Day’s range: 1.20200 – 1.21295
52 wk range: 1.1959 – 1.3516
Aggressive sales are still observed on GBP/USD currency pair. Over the past two weeks, the pound lost over 1000 points. GBP reached the level of $1.20. At the moment, the trading instrument is consolidating. Investors continue to monitor the current information about the spread of the virus COVID-19. Technical correction of GBP/USD quotes is not ruled out in the near future. Positions should be opened from key levels.
The Economic News Feed for 18.03.2020 is calm.
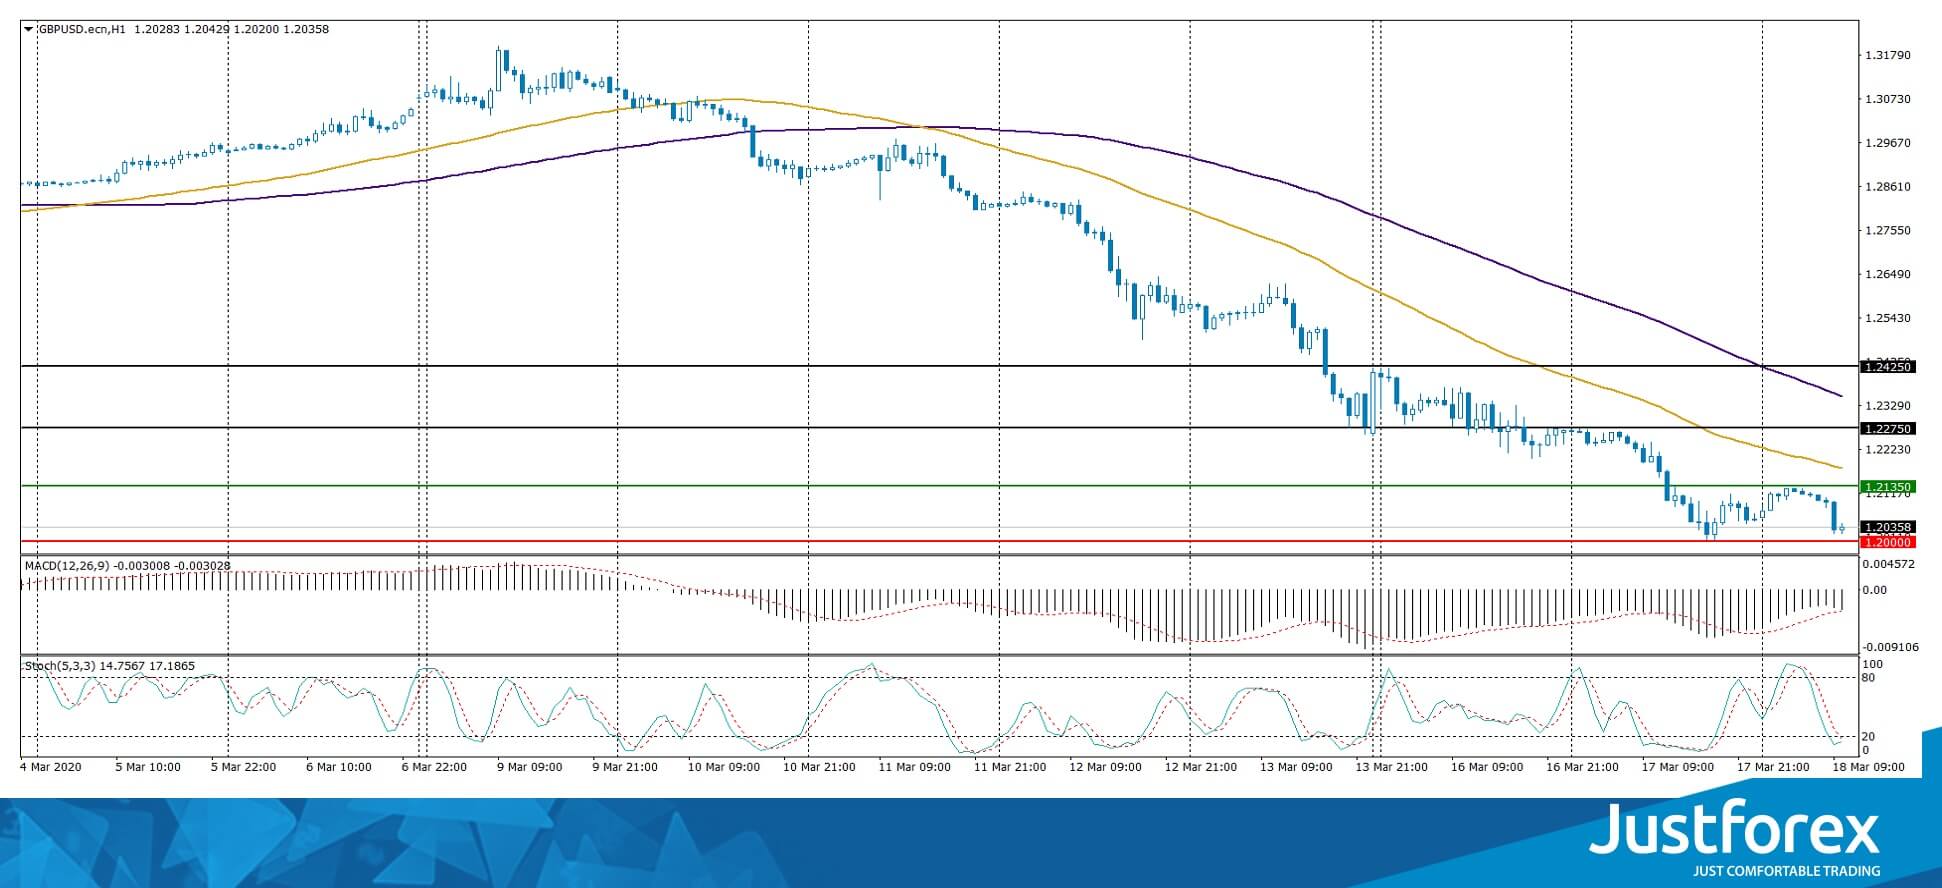
The indicators signal the sellers’ power: the price has fixed below 50 MA and 100 MA.
The MACD histogram is in the negative zone, which indicates a bearish sentiment.
The Stochastic Oscillator has reached the oversold zone, the %K line has started to cross the %D line. There are no signals at the moment.
Trading recommendations
Support levels: 1.20000, 1.19000
Resistance levels: 1.21350, 1.22750, 1.24250
If the price fixes below the round level of 1.20000, GBP/USD quotes are expected to fall further toward 1.19500-1.19000.
Alternatively, the quotes could correct toward 1.22500-1.22300.
The USD/CAD currency pair
Technical indicators of the currency pair:
Prev Open: 1.40007
Open: 1.42021
% chg. over the last day: +1.61
Day’s range: 1.41663 – 1.42601
52 wk range: 1.2949 – 1.3566
USD/CAD currency pair continues to show a stable upward trend. The quotes have updated the multi-year highs. The CAD is under pressure from a significant drop in “black gold” prices. At the moment the local support and resistance levels are at 1.41500 and 1.42750, respectively. Nevertheless, technical correction of the trading instrument is not ruled out in the nearest future. We expect important statistics on Canadian economy. Open positions from key levels.
The basic consumer price index in Canada will be published at 14:30 (GMT+2:00).
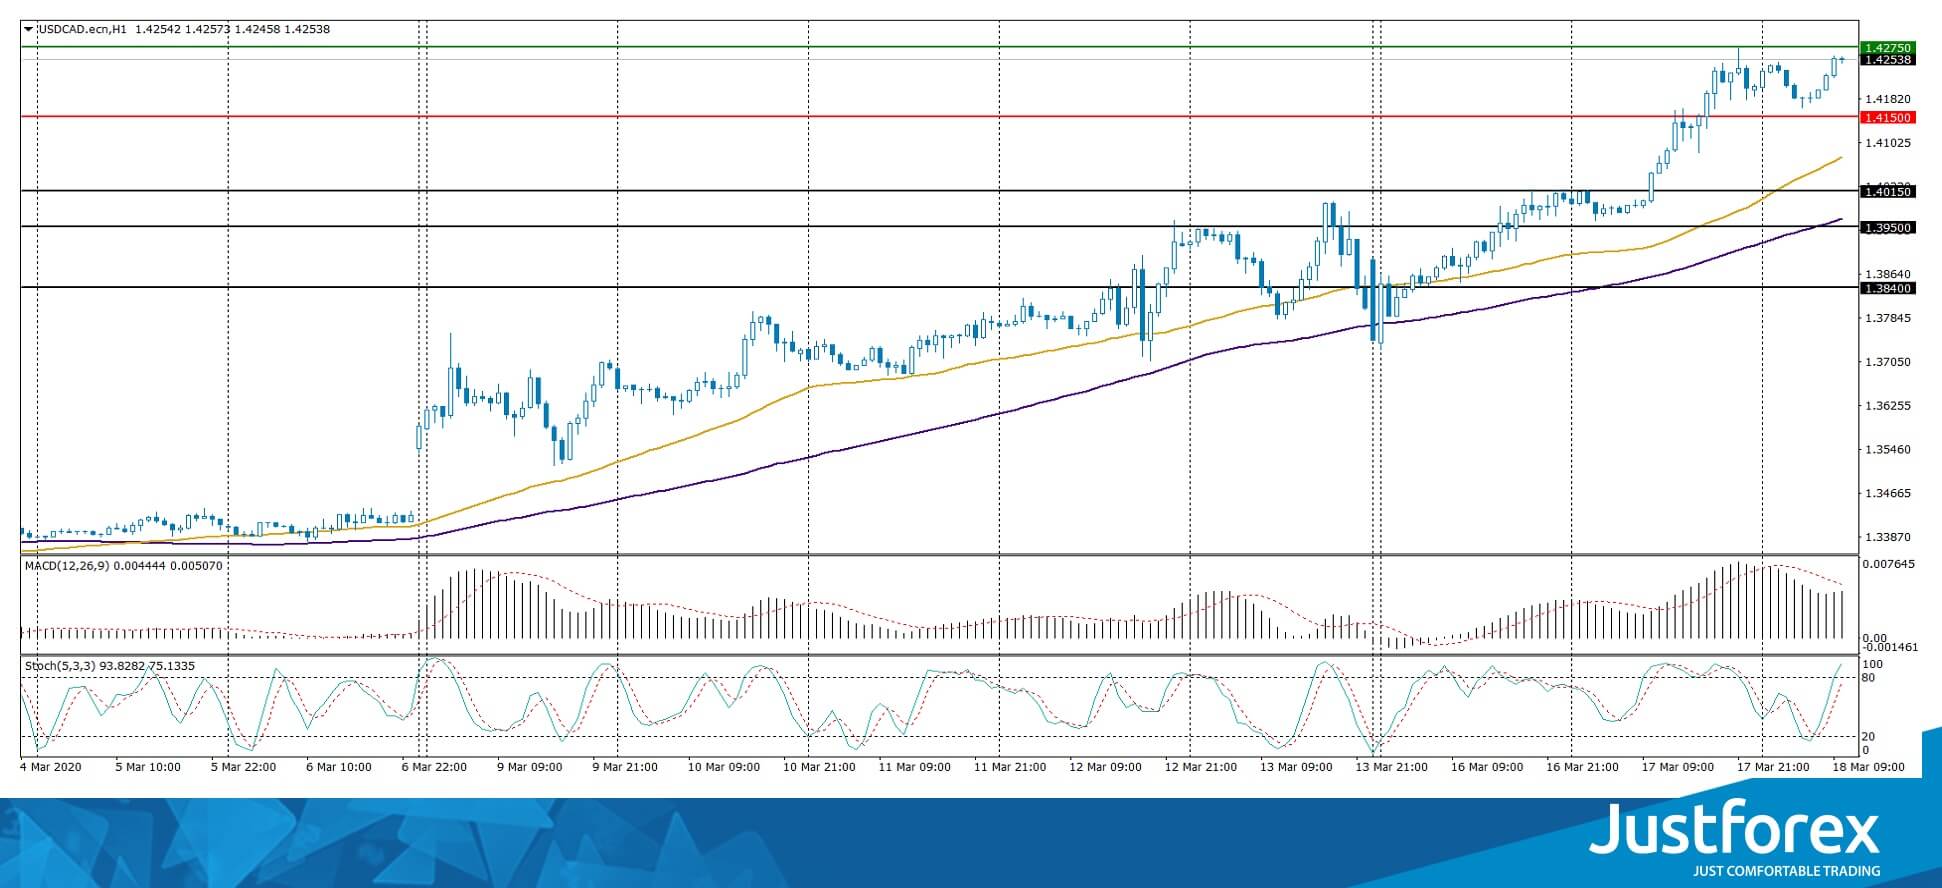
The indicators signal the power of buyers: the price has fixed above 50 MA and 100 MA.
The MACD histogram is in the positive zone, which indicates a bullish sentiment.
The Stochastic Oscillator is in the neutral zone, the %K line is above the %D line, which also gives a signal to buy USD/CAD.
Trading recommendations
Support levels: 1.41500, 1.40150, 1.39500
Resistance levels: 1.42750, 1.43500
If the price fixes above 1.42750, consider buying USD/CAD as the price moves toward 1.40500-1.39500.
Alternatively, the quotes could correct toward 1.40500-1.39500.
The USD/JPY currency pair
Technical indicators of the currency pair:
Prev Open: 105.887
Open: 107.604
% chg. over the last day: +1.44
Day’s range: 106.752 – 107.637
52 wk range: 101.19 – 112.41
The technical picture on USD/JPY currency pair is still ambiguous. The trading instrument is in sideways movement. Participants of financial markets are waiting for additional drivers. Demand for safe haven currencies remains at a high enough level. At the moment local support and resistance levels are at 106.500 and 107.850, respectively. It is recommended to open positions from key levels.
The Economic News Feed for 18.03.2020 is calm.
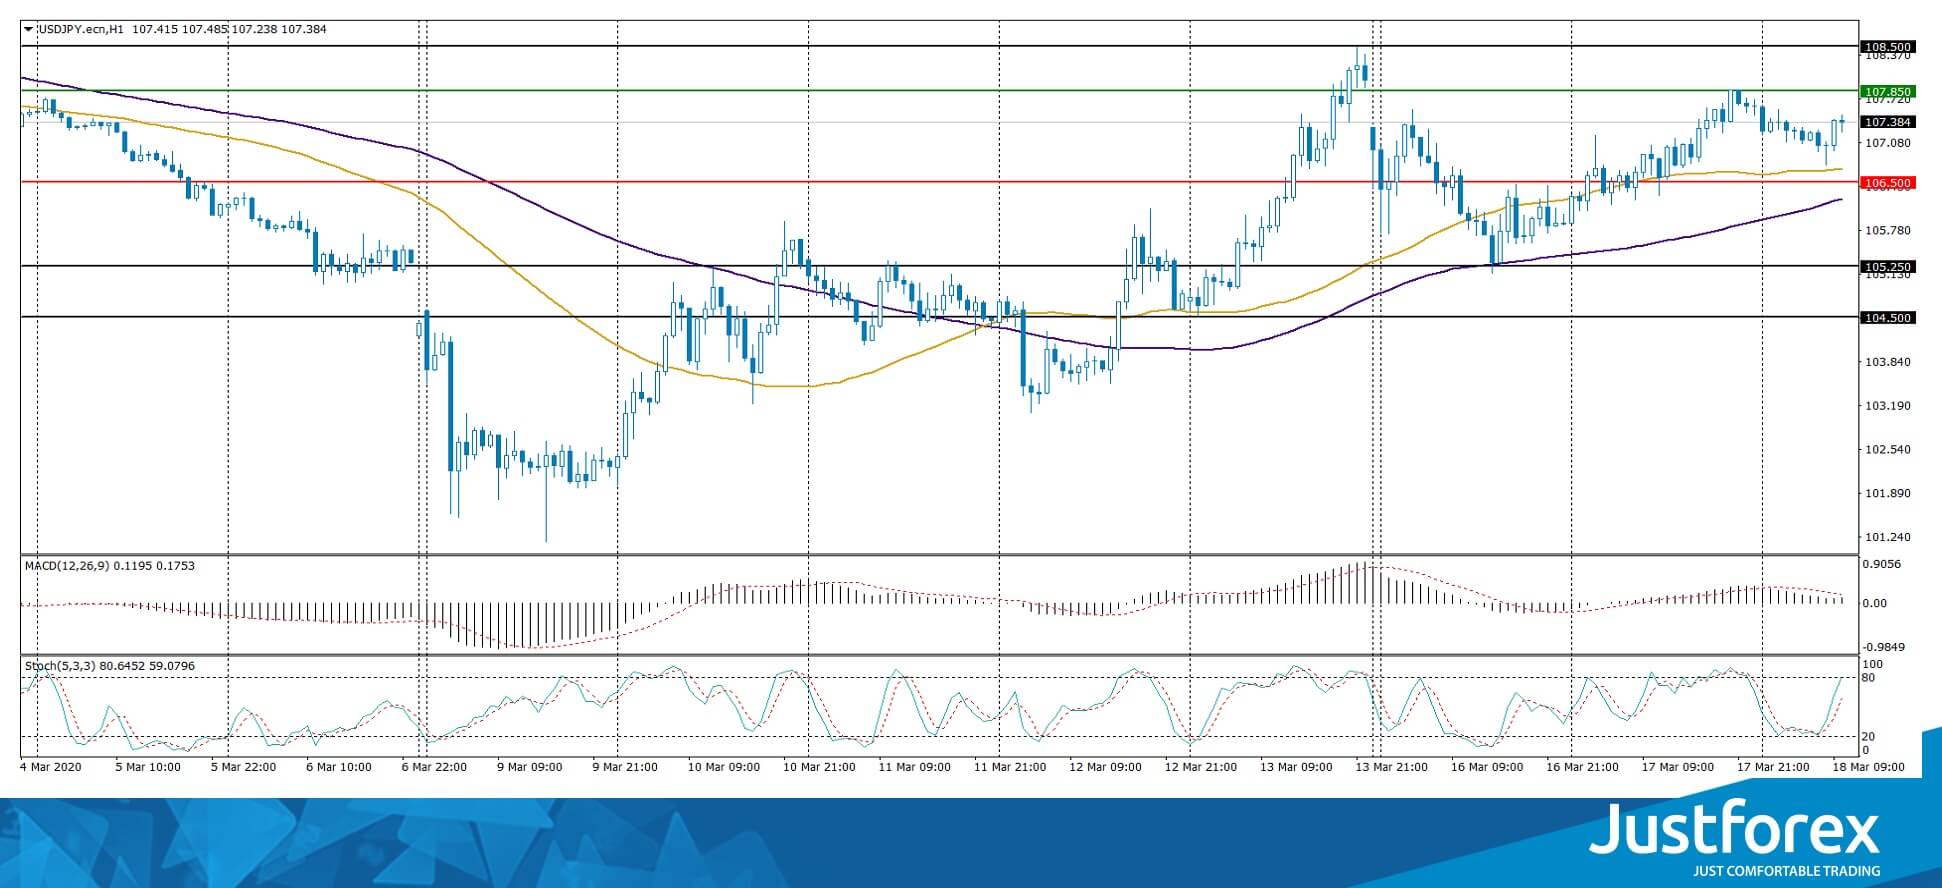
The indicators signal the power of buyers: the price has fixed above 50 MA and 100 MA.
The MACD histogram is in the positive zone, but below the signal line, which gives a weak signal to buy USD/JPY.
The Stochastic Oscillator is in the neutral zone, the %K line is above the %D line, which indicates a bullish sentiment.
Trading recommendations
Support levels: 106.500, 105.250, 104.500.
Resistance levels: 107.850, 108.500
If the price fixes above 107.850, expect the quotes to rise toward 107.850.
Alternatively, they could descend toward 105.700-105.000.


