
The EUR/USD currency pair
Technical indicators of the currency pair:
Prev Open: 1.07040
Open: 1.07280
% chg. over the last day: +0.32
Day’s range: 1.07260 – 1.08662
52 wk range: 1.0777 – 1.1494
The EUR/USD currency pair is still in sideways movement. There is no defined trend. At the moment, local support and resistance levels are acting: 1.07200 and 1.08600, respectively. The spread of the COVID-19 virus continues to put pressure on the financial markets. The US Federal Reserve introduced a new range of stimulus programs for large companies, households and small businesses. The current technical pattern signals a possible correction of the EUR after a significant fall. We recommend opening positions from key levels.
The Economic News Feed for 24.03.2020:
a number of indicators on business activity in Germany and the EU – 10:30, 11:00 (GMT+3:00);
Reports on business activity in the US (EU) – 15:45 (GMT+3:00);
New Home Sales (US) – 16:00 (GMT+3:00);
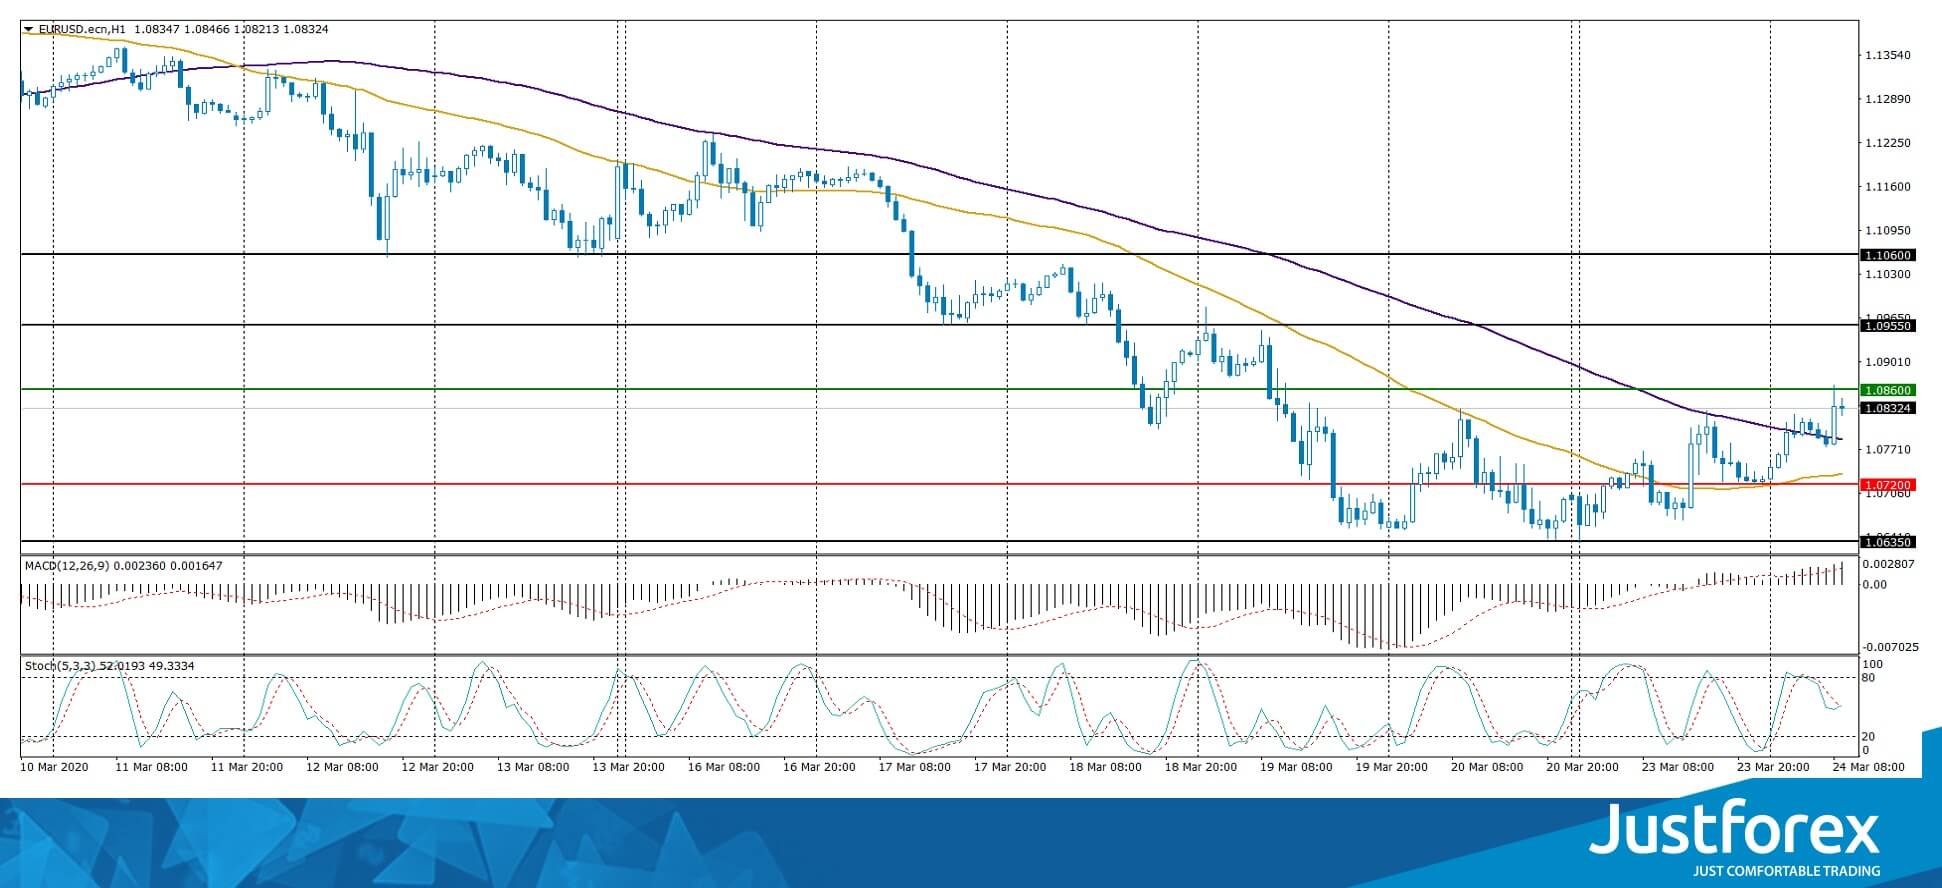
Indicators do not give accurate signals: the price has crossed 100 MA.
MACD histogram has moved to the positive zone, which indicates the recovery of EUR/USD quotes.
The Stochastic Oscillator is located in the neutral zone, the %K line has crossed the %D line. There are no signals at the moment.
Trading recommendations
Support levels: 1.07200, 1.06350
Resistance levels: 1.08600, 1.09550, 1.10600.
If the price fixes above 1.08600, the correction of the EUR/USD currency pair is expected toward 1.09400-1.10000.
Alternatively, the quotes will descend toward 1.06500-1.06000.
The GBP/USD currency pair
Technical indicators of the currency pair:
Prev Open: 1.16698
Open: 1.15087
% chg. over the last day: -0.62
Day’s range: 1.14857 – 1.16900
52 wk range: 1.1466 – 1.3516
The technical patterm on the GBP/USD currency pair is ambiguous. The pound is traded in a flat. There is no defined trend. The key support and resistance levels are: 1.14500 and 1.17200, respectively. British Prime Minister Boris Johnson introduced a strict quarantine in the country to stop the spread of the COVID-19 virus. Technical correction of the trading instrument is not ruled out in the nearest future. Open positions from key levels.
At 11:30 (GMT+2:00) the UK will publish a number of important indicators on business activity.
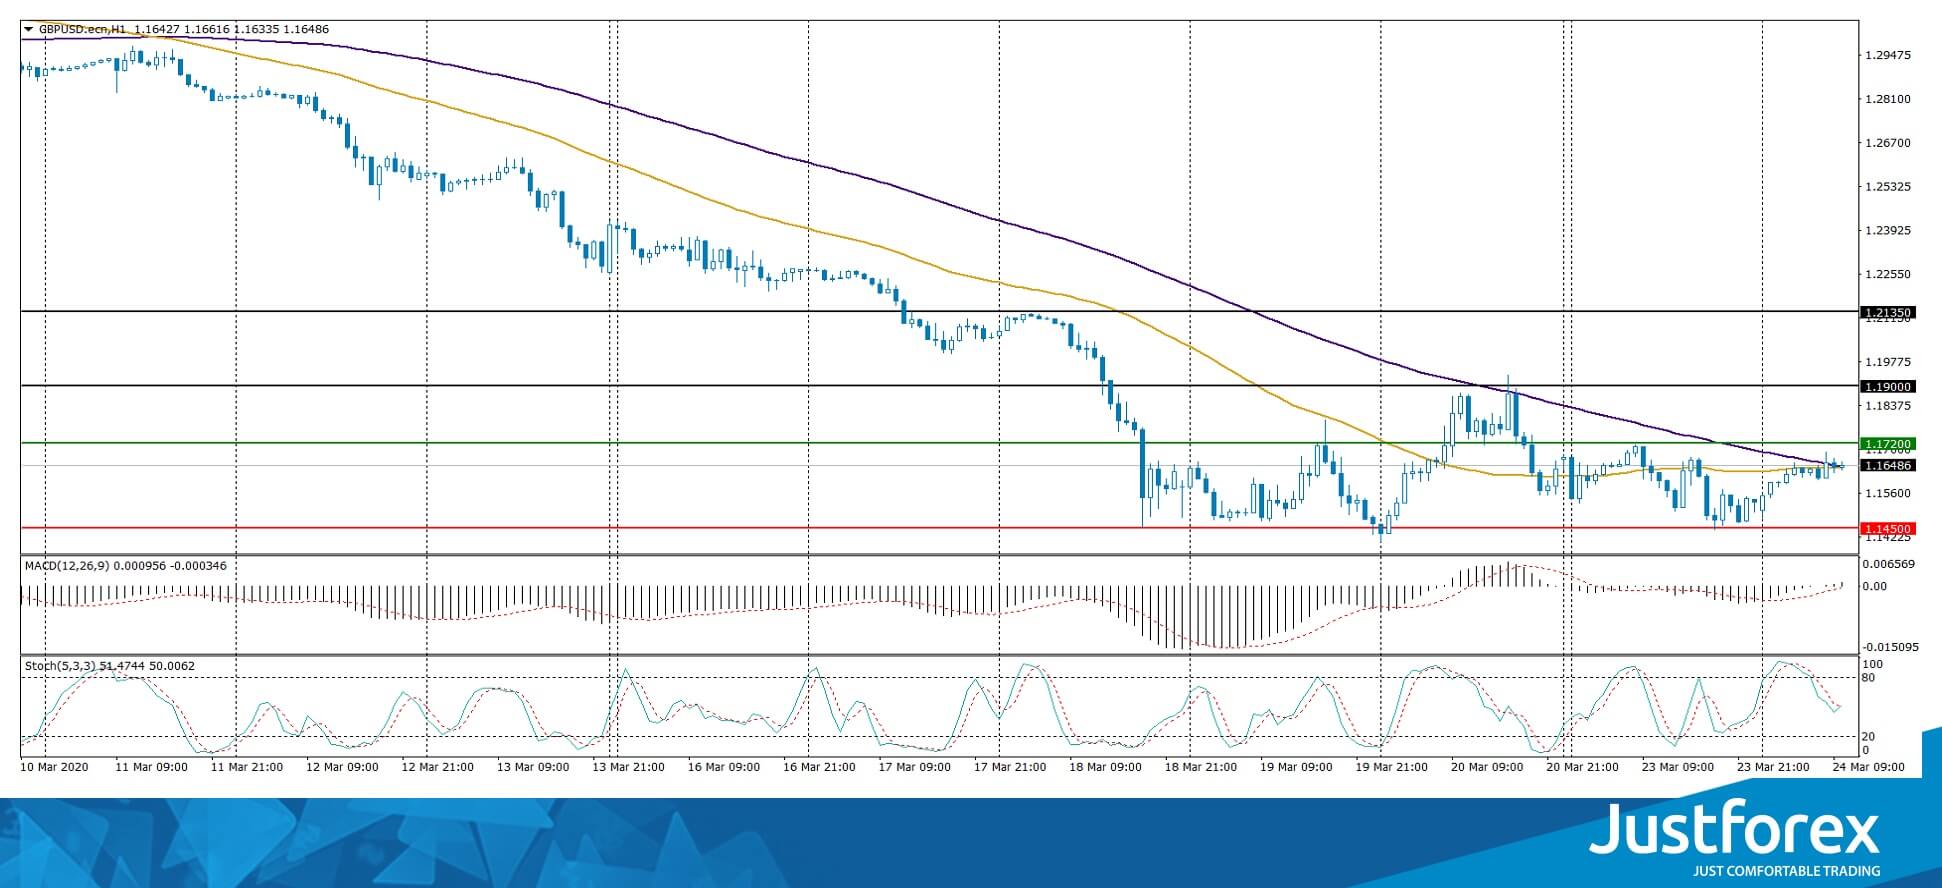
Indicators do not give an accurate signal: 50 MA crossed 100 MA.
MACD histogram is near the 0 mark.
The Stochastic Oscillator is located in the neutral zone, the %K line crossed the %D line. No signals at the moment.
Trading recommendations
Support levels: 1.14500
Resistance levels: 1.17200, 1.19000, 1.21350
If the price fixes above 1.17200, expect a correction toward 1.19000-1.20000.
Alternatively, thje quotes could descend toward 1.14000-1.13500.
The USD/CAD currency pair
Technical indicators of the currency pair:
Prev Open: 1.43566
Open: 1.45076
% chg. over the last day: +0.70
Day’s range: 1.43812 – 1.45076
52 wk range: 1.2949 – 1.4668
The CAD is in a flat. The technical picture is ambiguous. At the moment the following key support and resistance levels can be distinguished at 1.43600 and 1.45450, respectively. The correction of USD/CAD quotes after the prolonged rally is not excluded in the nearest future. We recommend you to pay attention to the dynamics of oil prices. Open positions from key levels.
The Economic News Feed for 24.03.2020 is calm.
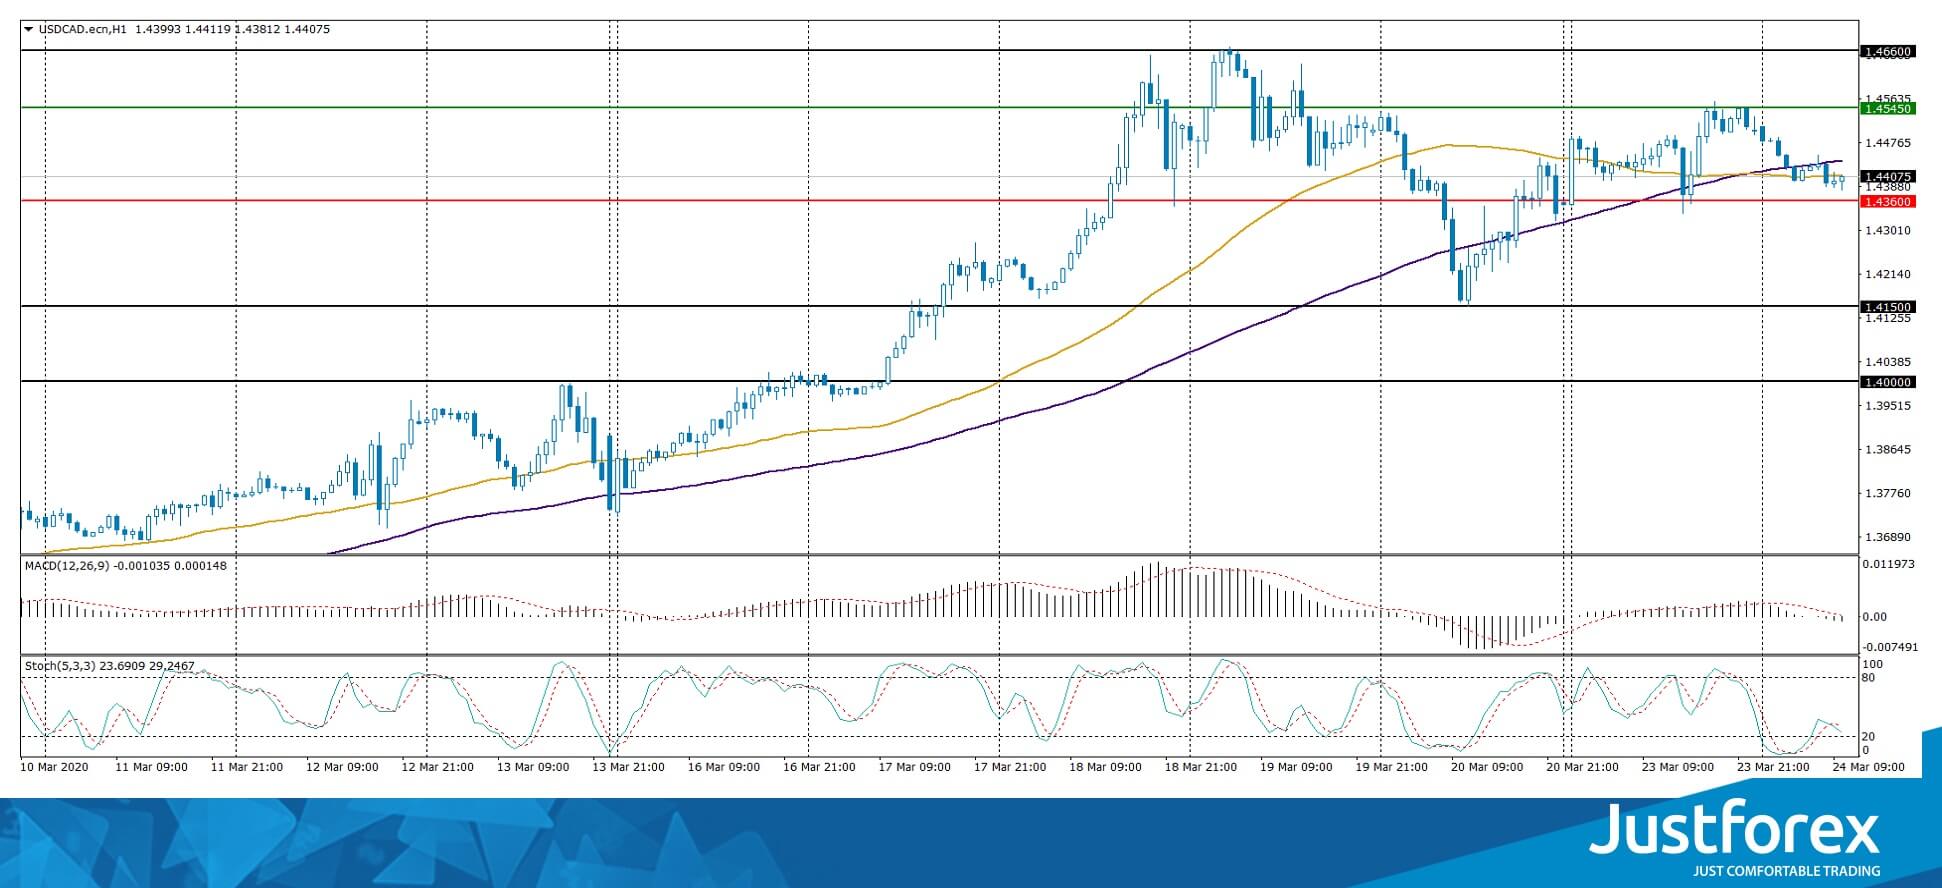
Indicators do not give accurate signals: the price has crossed 50 MA and 100 MA.
The MACD histogram began to decline, which indicates a bearish sentiment.
The Stochastic Oscillator is in a neutral zone, the %K line has crossed the %D line. There are no signals at the moment.
Trading recommendations
Support levels: 1.43600, 1.41500, 1.40000
Resistance levels: 1.45450, 1.46600
If the price fixes below 1.43600, expect a correction of USD/CAD currency to 1.42500-1.41500.
Alternatively, the quotes could grow toward 1.46500-1.47000.
The USD/JPY currency pair
Technical indicators of the currency pair:
Prev Open: 110.755
Open: 111.222
% chg. over the last day: +0.76
Day’s range: 110.086 – 111.239
52 wk range: 101.19 – 112.41
USD/JPY currency pair continues to trade in a flat. There is no defined trend. Investors are waiting for additional drivers. At the moment local support and resistance levels are at 110.200 and 111.450, respectively. Technical correction of the trading instrument is not ruled out in the nearest future. We recommend you to pay attention to the dynamics of US government securities yield. Open positions from key levels.
The Economic News Feed for 24.03.2020 is calm.
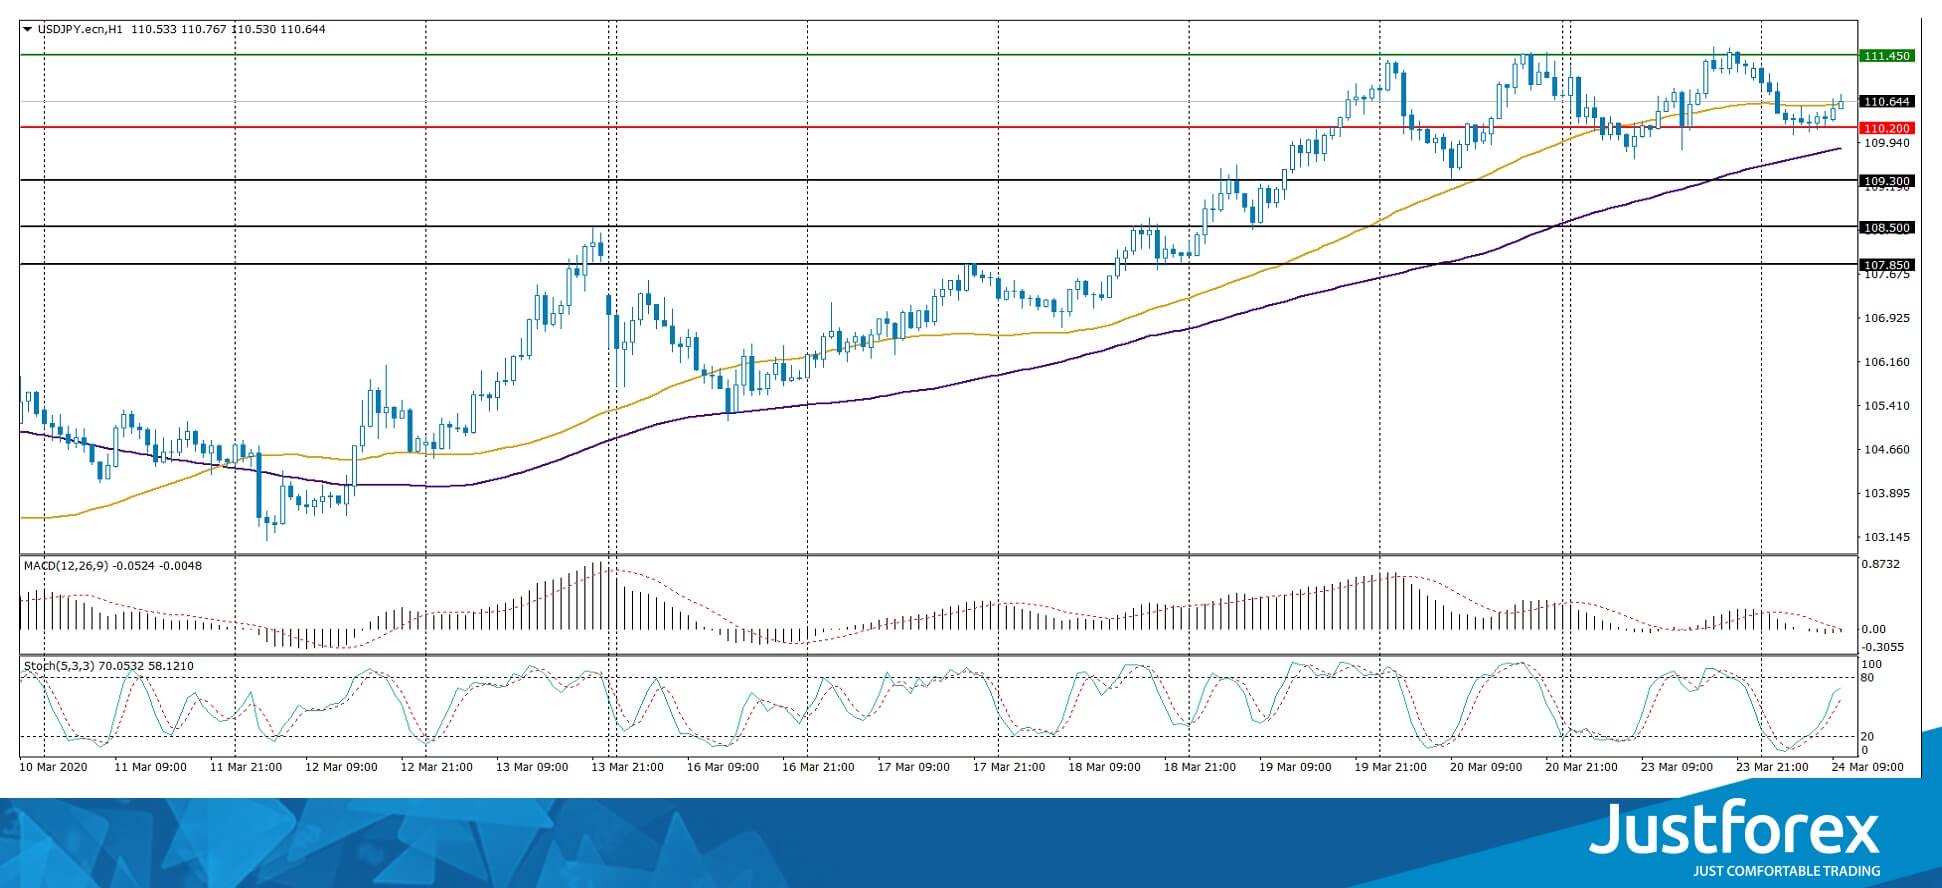
Indicators do not give accurate signals: the price has crossed 50 MA and 100 MA.
MACD histogram is near the 0 mark.
The Stochastic Oscillator is located in the neutral zone, the %K line is above the %D line, which indicates a bullish mood.
Trading recommendations
Support levels: 110.200, 109.300, 108.500.
Resistance levels: 111.450, 112.000
If the price fixes below 110.200, expect the quotes to correct toward 109.300-108.500.
Alternatively, the quotes could grow toward 112.000.


