
The EUR/USD currency pair
Technical indicators of the currency pair:
Prev Open: 1.09079
Open: 1.08325
% chg. over the last day: -0.46
Day’s range: 1.08325 – 1.08786
52 wk range: 1.0777 – 1.1494
The greenback continued its growth against a basket of world currencies despite the publication of weak economic releases. EUR/USD quotes have updated local lows. Investors continue to assess the risks of the further spread of the COVID-19 virus and its impact on the global economy. The ECB President, Christine Lagarde, said that the regulator was bracing for a “large contraction” in the Eurozone economy. At the moment, the key range is 1.0830-1.0875. A trading instrument has the potential for further decline. Positions should be opened from key levels.
The Economic News Feed for 17.04.2020
At 12:00 (GMT+3:00), a report on inflation will be published in the Eurozone.
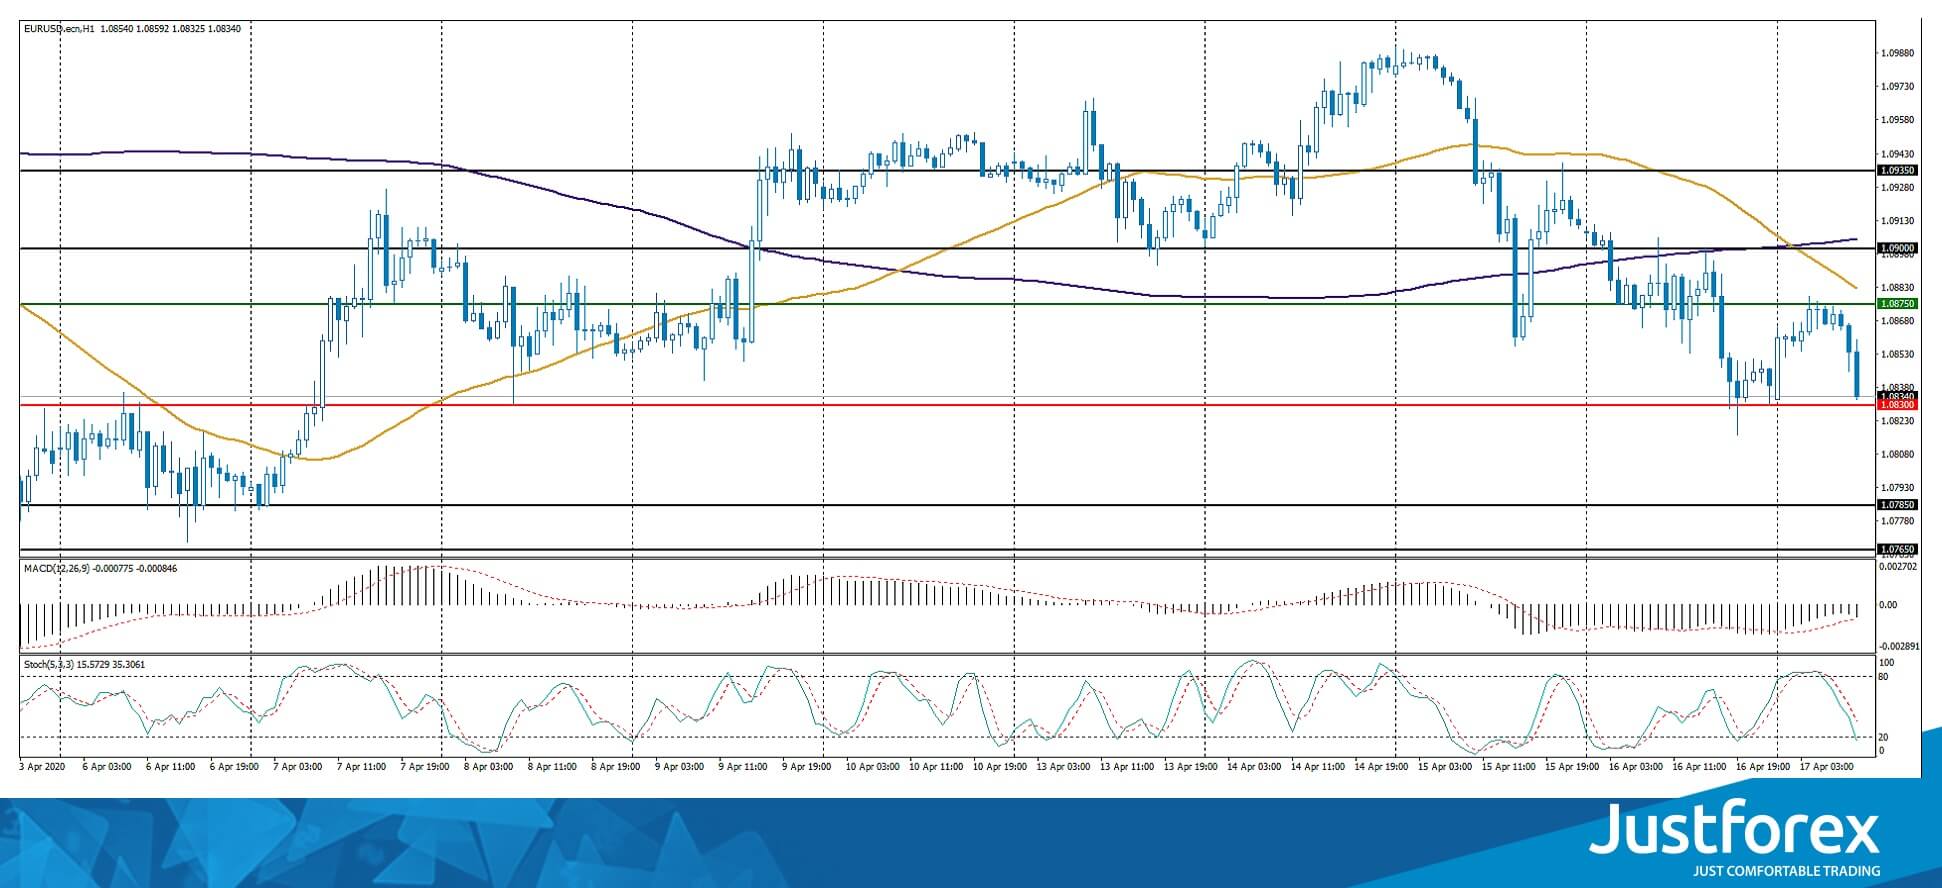
Indicators signal the power of sellers: the price has fixed below 50 MA and 100 MA.
The MACD histogram is in the negative zone and continues to decline, indicating the bearish sentiment.
Stochastic Oscillator is in the neutral zone, the %K line is below the %D line, which also gives a signal to sell EUR/USD.
Trading recommendations
Support levels: 1.0830, 1.0785, 1.0765
Resistance levels: 1.0875, 1.0900, 1.0935
If the price fixes below 1.0830, a further fall in the EUR/USD currency pair is expected. The movement is tending to 1.0790-1.0770.
An alternative could be the growth of EUR/USD quotes to 1.0900-1.0930.
The GBP/USD currency pair
Technical indicators of the currency pair:
Prev Open: 1.25095
Open: 1.24554
% chg. over the last day: -0.22
Day’s range: 1.24303 – 1.25222
52 wk range: 1.1466 – 1.3516
The GBP/USD currency pair is being traded in a flat. There is no defined trend. The British pound is testing the key support and resistance levels: 1.2420 and 1.2520, respectively. In the near future, the technical correction of GBP/USD quotes is not ruled out after a protracted rally. Financial market participants are still focused on the coronavirus pandemic. We recommend opening positions from key support and resistance levels.
The news feed on the UK economy is calm.
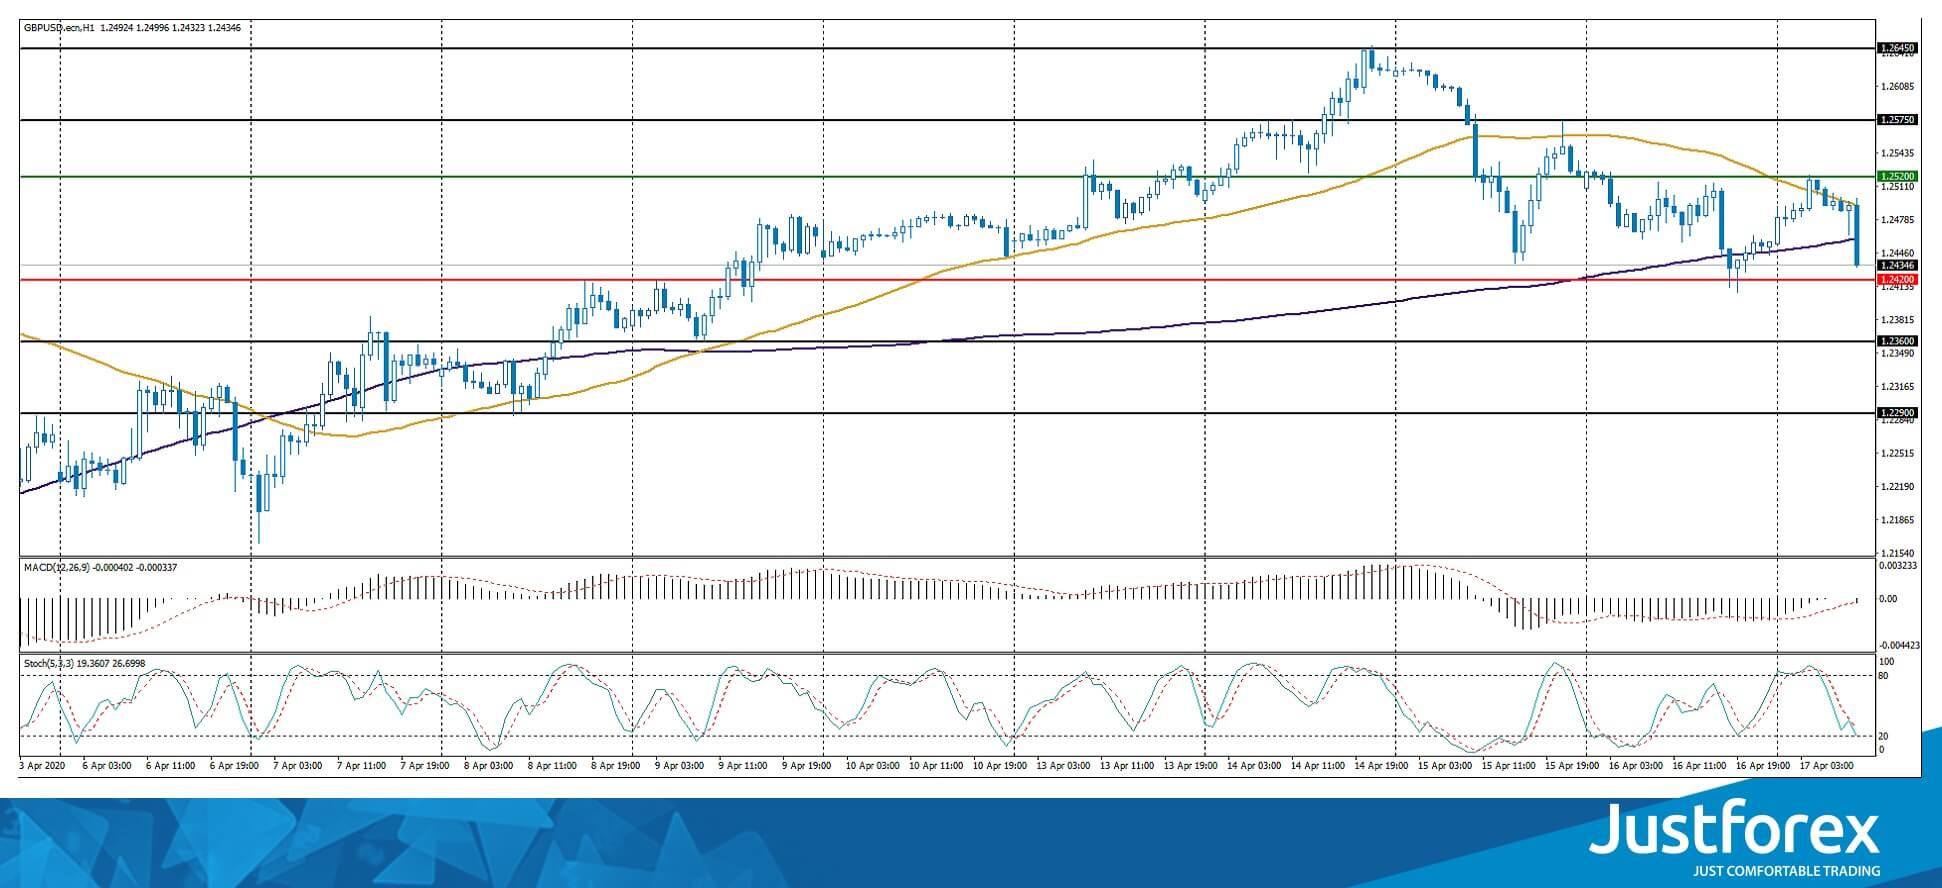
Indicators do not give accurate signals: the price has crossed 50 MA and 100 MA.
The MACD histogram is near the 0 mark.
Stochastic Oscillator is in the neutral zone, the %K line is below the %D line, which indicates the bearish sentiment.
Trading recommendations
Support levels: 1.2420, 1.2360, 1.2290
Resistance levels: 1.2520, 1.2575, 1.2645
If the price fixes below 1.2420, GBP/USD quotes are expected to fall. The movement is tending to 1.2370-1.2340.
An alternative could be the growth of the GBP/USD currency pair to 1.2570-1.2600.
The USD/CAD currency pair
Technical indicators of the currency pair:
Prev Open: 1.41074
Open: 1.40850
% chg. over the last day: -0.53
Day’s range: 1.40052 – 1.41082
52 wk range: 1.2949 – 1.4668
There is an ambiguous technical pattern on the USD/CAD currency pair. The loonie is consolidating. There is no defined trend. At the moment, the local support and resistance levels are 1.4050 and 1.4120, respectively. USD/CAD quotes are tending to grow. The Canadian dollar is under pressure due to aggressive sales in the “black gold” market. We recommend opening positions from key levels.
Today, the news feed on Canada’s economy is calm enough.
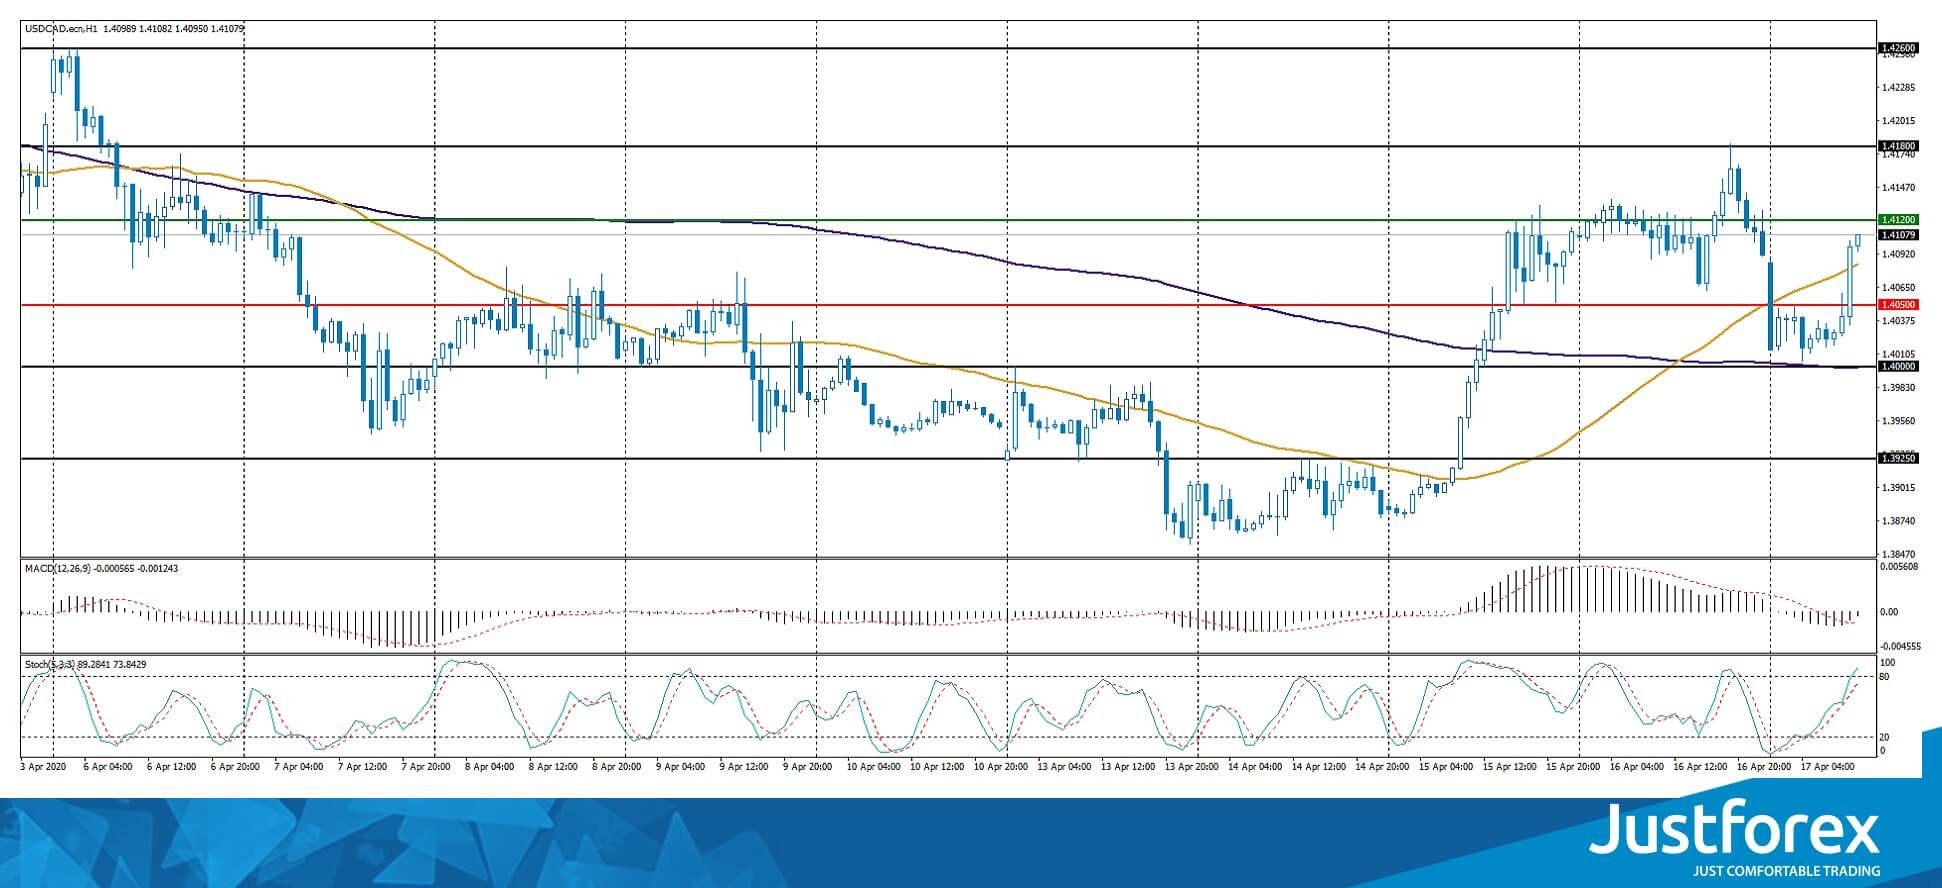
Indicators do not give accurate signals: the price has crossed 50 MA.
The MACD histogram is near the 0 mark.
Stochastic Oscillator is in the neutral zone, the %K line is above the %D line, which indicates the bullish sentiment.
Trading recommendations
Support levels: 1.4050, 1.4000, 1.3925
Resistance levels: 1.4120, 1.4180, 1.4260
If the price fixes above the resistance level of 1.4120, USD/CAD quotes are expected to grow. The movement is tending to 1.4170-1.4220.
An alternative could be a decrease in the USD/CAD currency pair to 1.4000-1.3980.
The USD/JPY currency pair
Technical indicators of the currency pair:
Prev Open: 107.378
Open: 107.941
% chg. over the last day: +0.42
Day’s range: 107.626 – 108.080
52 wk range: 101.19 – 112.41
The USD/JPY currency pair is in a sideways trend. The technical pattern is ambiguous. Financial markets participants expect additional drivers. At the moment, the local support and resistance levels are 107.60 and 108.00, respectively. We recommend paying attention to the dynamics of US government bonds yield. Positions should be opened from key levels.
A number of weak economic releases from Japan have been published during the Asian trading session.
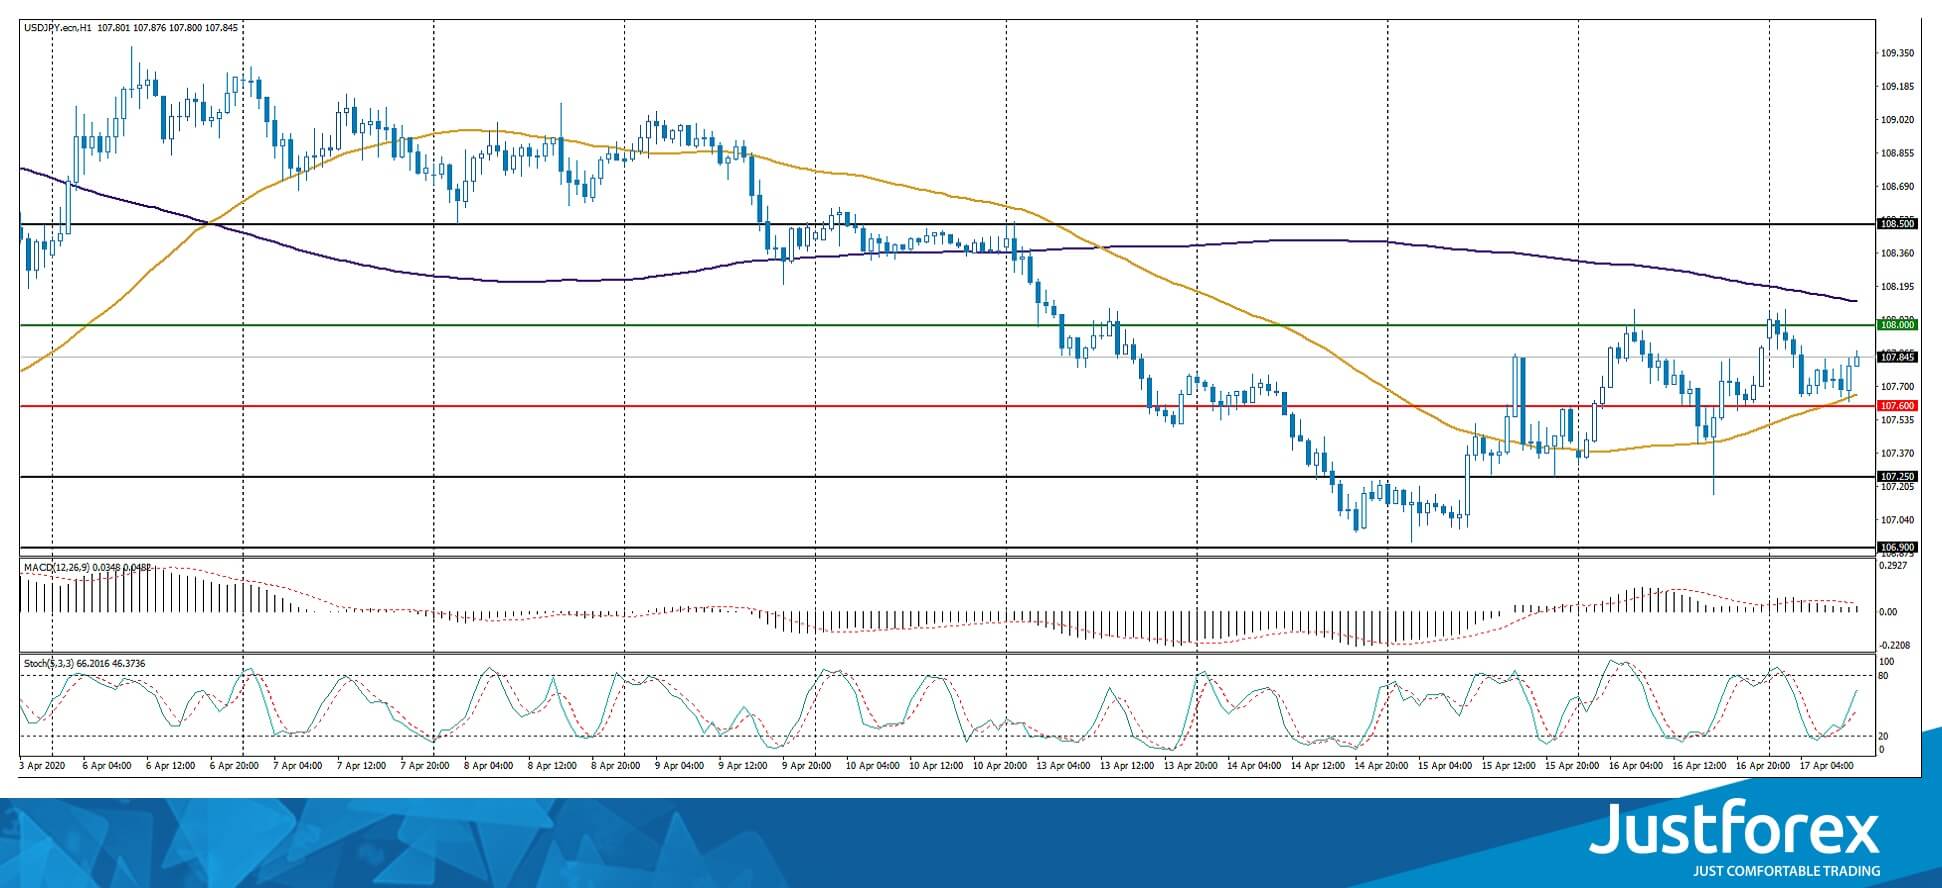
Indicators do not give accurate signals: the price has fixed between 50 MA and 100 MA.
The MACD histogram is in the positive zone, but below the signal line, which gives a weak signal to buy USD/JPY.
Stochastic Oscillator is in the neutral zone, the %K line is above the %D line, which indicates the bullish sentiment.
Trading recommendations
Support levels: 107.60, 107.25, 106.90
Resistance levels: 108.00, 108.50
If the price fixes above the round level of 108.00, USD/JPY quotes are expected to grow. The movement is tending to 108.30-108.50.
An alternative could be a decrease in the USD/JPY currency pair to 107.30-107.00.


