
The EUR/USD currency pair
Technical indicators of the currency pair:
Prev Open: 1.08209
Open: 1.07763
% chg. over the last day: -0.42
Day’s range: 1.07271 – 1.07849
52 wk range: 1.0777 – 1.1494
The single currency continues to lose ground relative to the greenback. EUR/USD quotes set new local lows. The euro is under pressure due to weak indicators of economic activity in Germany and the Eurozone. The US House of Representatives has approved a $480 billion COVID-19 stimulus bill. At the moment, the trading instrument is testing the support level of 1.0725. The 1.0775 mark is already a “mirror” resistance. We do not exclude a further drop in EUR/USD quotes. We recommend opening positions from key levels.
The Economic News Feed for 24.04.2020
German IFO business climate index at 11:00 (GMT+3:00);
Report on durable goods orders in the US at 15:30 (GMT+3:00).
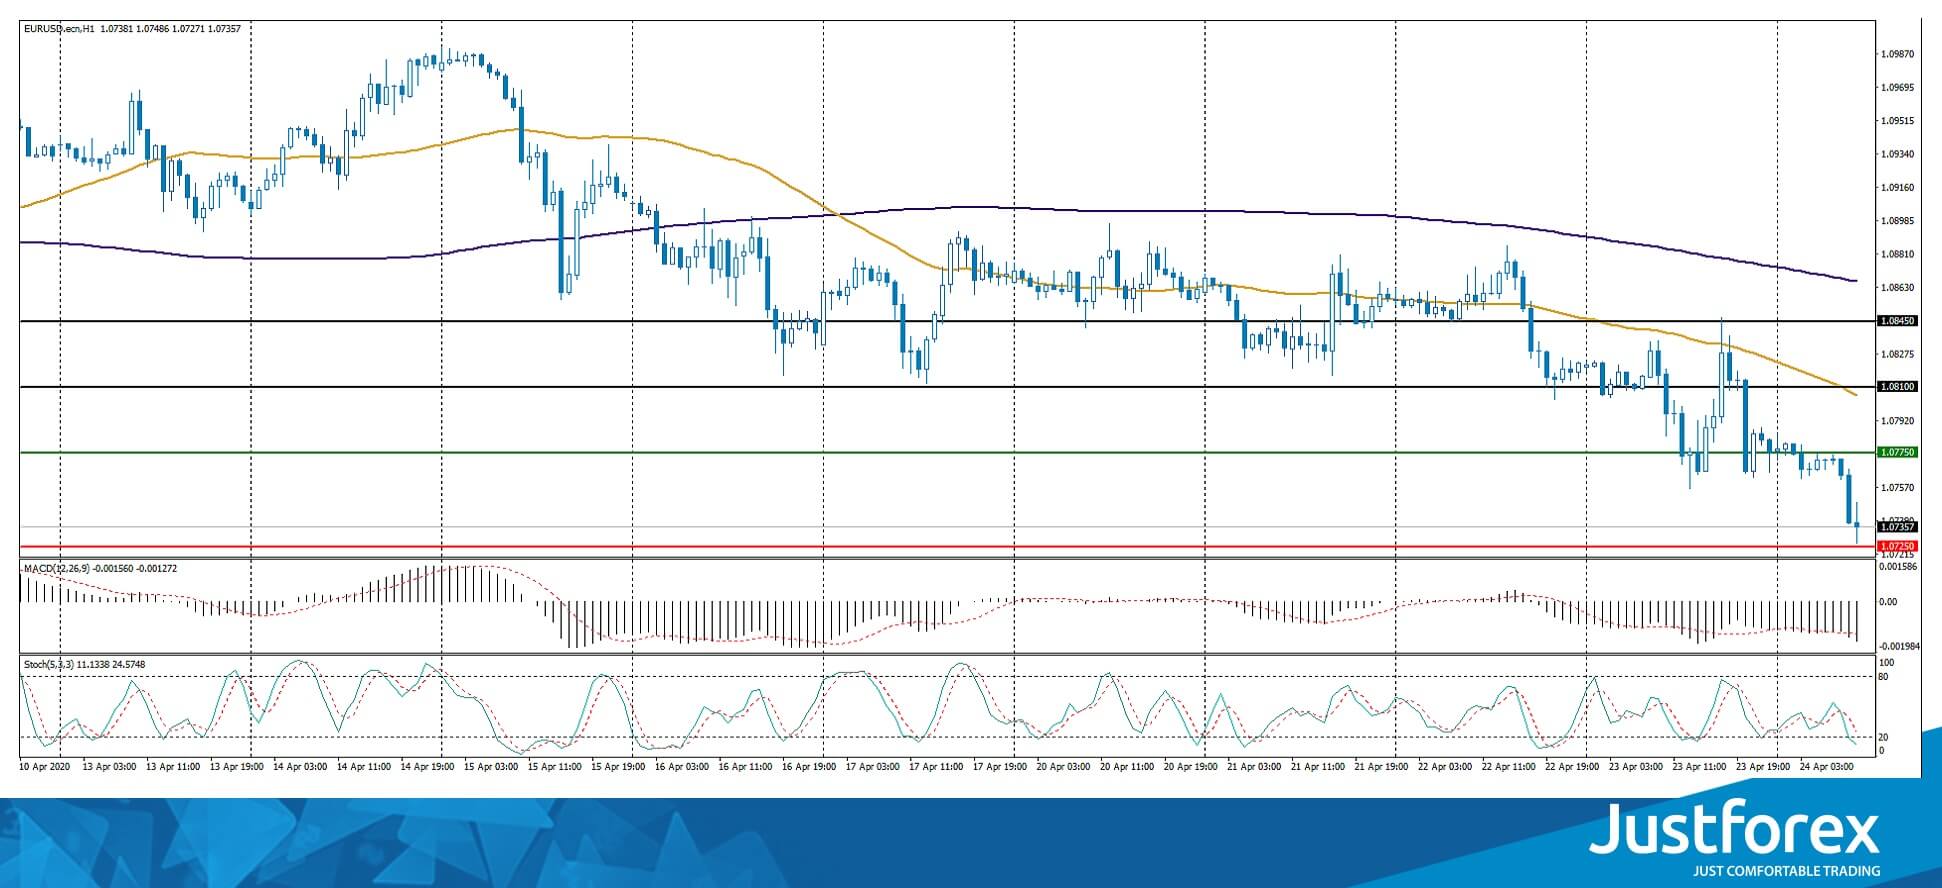
Indicators signal the power of sellers: the price has fixed below 50 MA and 100 MA.
The MACD histogram is in the negative zone and continues to decline, indicating the bearish sentiment.
Stochastic Oscillator is in the neutral zone, the %K line is below the %D line, which also gives a signal to sell EUR/USD.
Trading recommendations
Support levels: 1.0725, 1.0700
Resistance levels: 1.0775, 1.0810, 1.0845
If the price fixes below 1.0725, a further fall in the EUR/USD currency pair is expected. The movement is tending to 1.0700-1.0680.
An alternative could be the growth of EUR/USD quotes to 1.0800-1.0830.
The GBP/USD currency pair
Technical indicators of the currency pair:
Prev Open: 1.23312
Open: 1.23403
% chg. over the last day: +0.08
Day’s range: 1.23045 – 1.23605
52 wk range: 1.1466 – 1.3516
The GBP/USD currency pair is still being traded in a flat. There is no defined trend. GBP/USD quotes are testing the key support and resistance levels: 1.2300 and 1.2375, respectively. The British pound is under pressure amid weak economic releases from the UK. A trading instrument is tending to decline. We recommend opening positions from key support and resistance levels.
In March, retail sales in the UK fell by 5.1%, which is below market expectations at 4.0%.
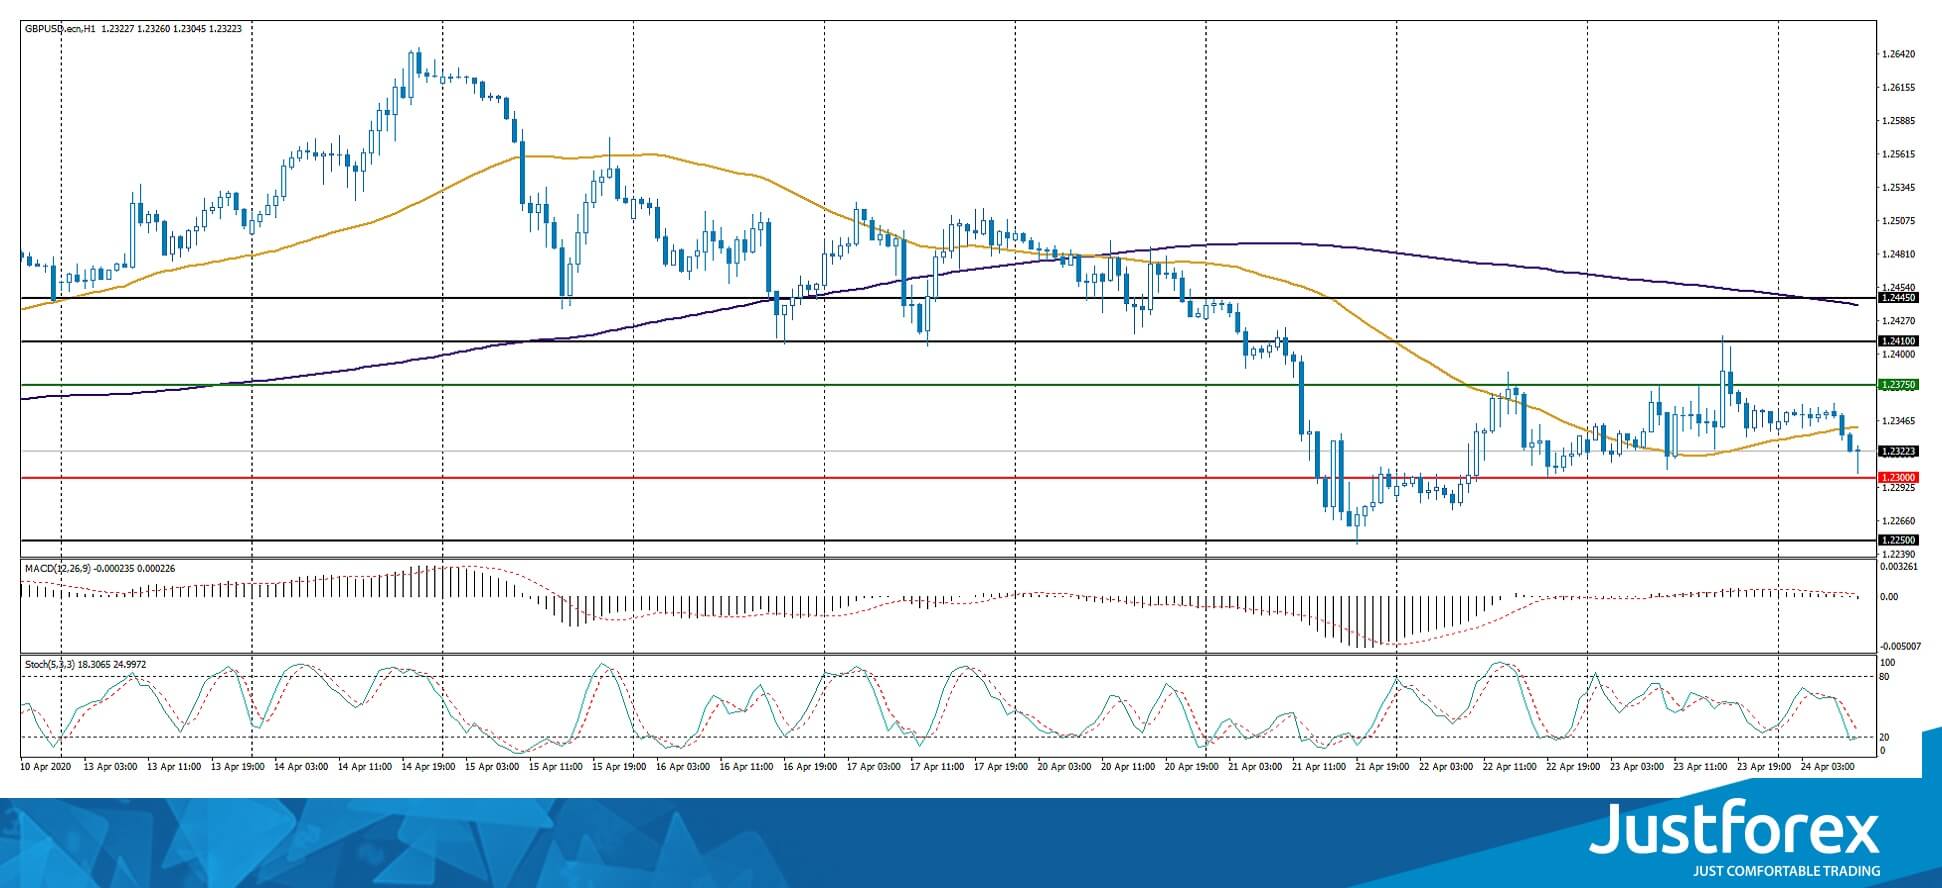
Indicators do not give accurate signals: the price has crossed 50 MA.
The MACD histogram is near the 0 mark.
Stochastic Oscillator is in the neutral zone, the %K line is below the %D line, which indicates the bearish sentiment.
Trading recommendations
Support levels: 1.2300, 1.2250
Resistance levels: 1.2375, 1.2410, 1.2445
If the price fixes below the round level of 1.2300, GBP/USD quotes are expected to fall. The movement is tending to 1.2260-1.2240.
An alternative could be the growth of the GBP/USD currency pair to 1.2410-1.2450.
The USD/CAD currency pair
Technical indicators of the currency pair:
Prev Open: 1.41612
Open: 1.40741
% chg. over the last day: -0.63
Day’s range: 1.40534 – 1.41094
52 wk range: 1.2949 – 1.4668
USD/CAD quotes have been declining. The trading instrument has updated local lows. The loonie is currently consolidating in the range of 1.4050-1.4120. The Canadian dollar is supported by the recovery of the “black gold” prices. We do not exclude further correction of the USD/CAD currency pair. Today we recommend paying attention to economic reports from the US. Positions should be opened from key levels.
The news feed on Canada’s economy is calm.
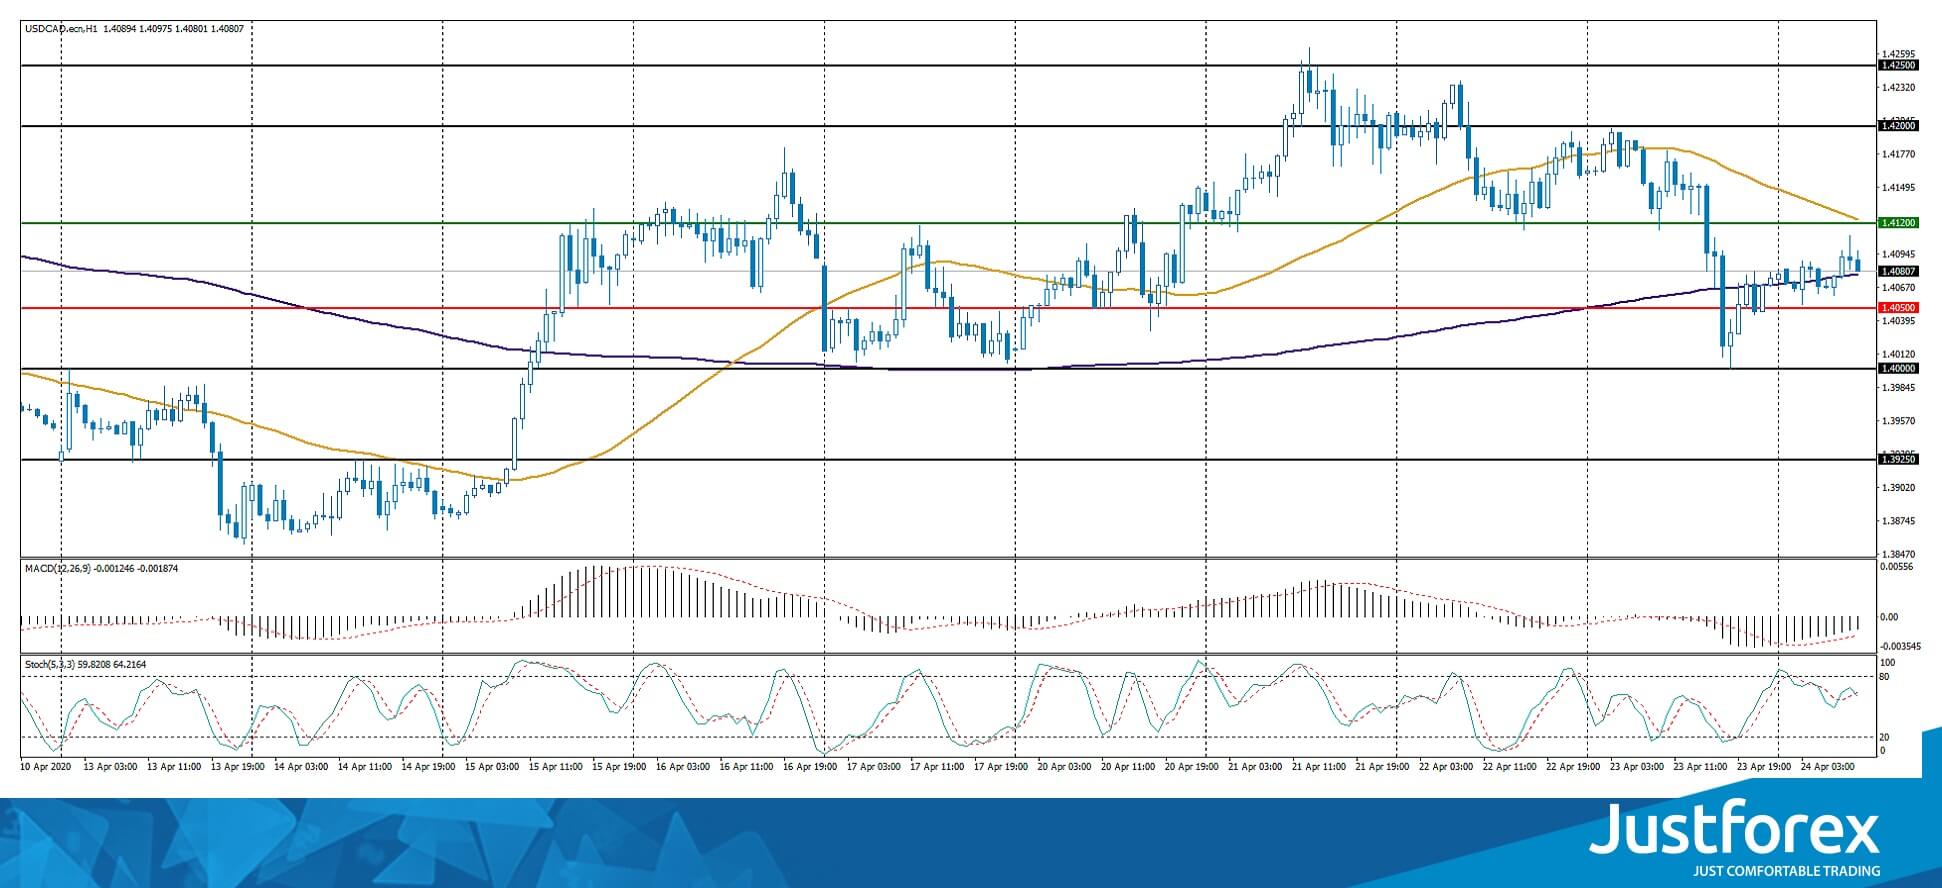
Indicators do not give accurate signals: the price has fixed between 50 MA and 200 MA.
The MACD histogram is in the negative zone, but above the signal line, which gives a weak signal to sell USD/CAD.
Stochastic Oscillator is in the neutral zone, the %K line has crossed the %D line. There are no signals at the moment.
Trading recommendations
Support levels: 1.4050, 1.4000, 1.3925
Resistance levels: 1.4120, 1.4200, 1.4250
If the price fixes below the support level of 1.4050, a further drop in USD/CAD quotes is expected. The movement is tending to 1.4000-1.3970.
An alternative could be the growth of the USD/CAD currency pair to 1.4150-1.4180.
The USD/JPY currency pair
Technical indicators of the currency pair:
Prev Open: 107.778
Open: 107.559
% chg. over the last day: -0.14
Day’s range: 107.538 – 107.760
52 wk range: 101.19 – 112.41
The USD/JPY currency pair is still being traded in a prolonged flat. There is no defined trend. Local support and resistance levels are 107.50 and 107.85, respectively. Financial markets participants expect additional drivers. Today, investors will assess statistics from the US. We also recommend paying attention to the dynamics of US government bonds yield. Positions should be opened from key levels.
The news feed on Japan’s economy is calm enough.
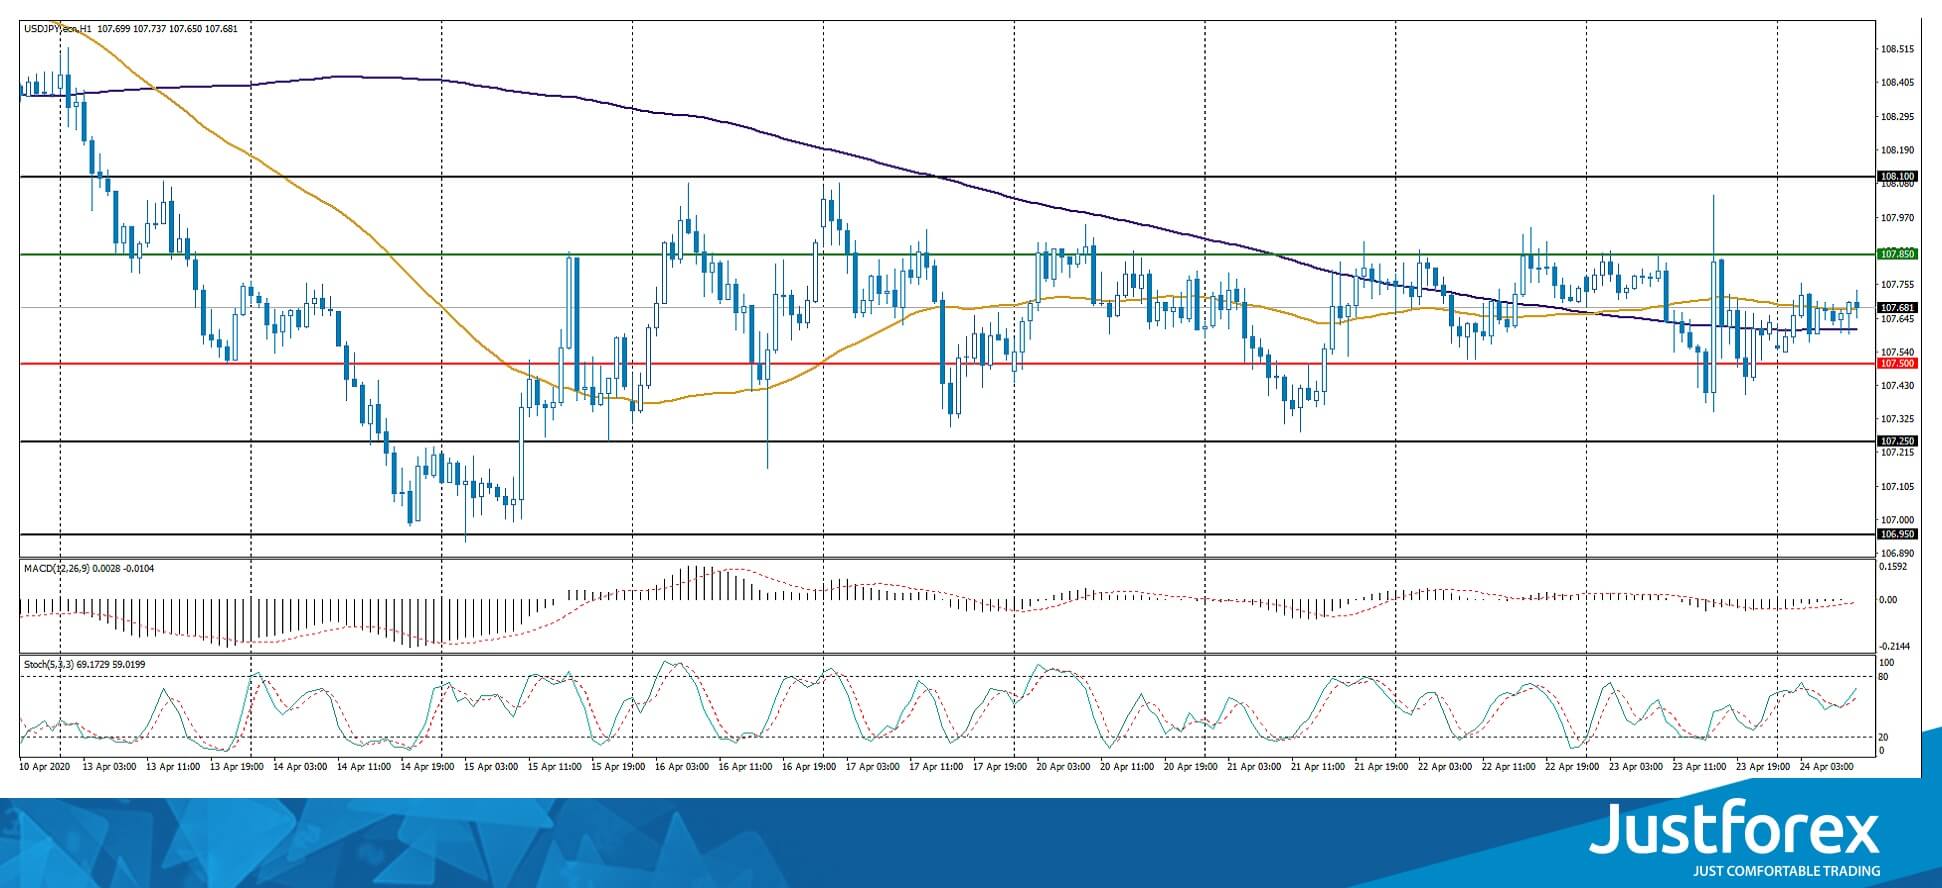
Indicators do not give accurate signals: the price has crossed 50 MA and 100 MA.
The MACD histogram is near the 0 mark.
Stochastic Oscillator is in the neutral zone, the %K line is above the %D line, which indicates the bullish sentiment.
Trading recommendations
Support levels: 107.50, 107.25, 106.95
Resistance levels: 107.85, 108.10
If the price fixes below the support level of 107.50, USD/JPY quotes are expected to fall. The movement is tending to 107.20-107.00.
An alternative could be the growth of the USD/JPY currency pair to 108.10-108.30.


