
The EUR/USD currency pair
Technical indicators of the currency pair:
Prev Open: 1.08216
Open: 1.08277
% chg. over the last day: +0.08
Day’s range: 1.08101 – 1.08361
52 wk range: 1.0777 – 1.1494
There is an ambiguous technical pattern on the EUR/USD currency pair. Quotes are currently consolidating. The local support and resistance levels are 1.0810-1.0835. Demand for risky assets has started resuming amid reduced restrictions in most countries of the world. Investors expect the Fed and the ECB meetings which will be held this week. The single currency is tending to grow. We recommend opening positions from key levels.
At 17:00 (GMT+3:00), CB consumer confidence index will be published.
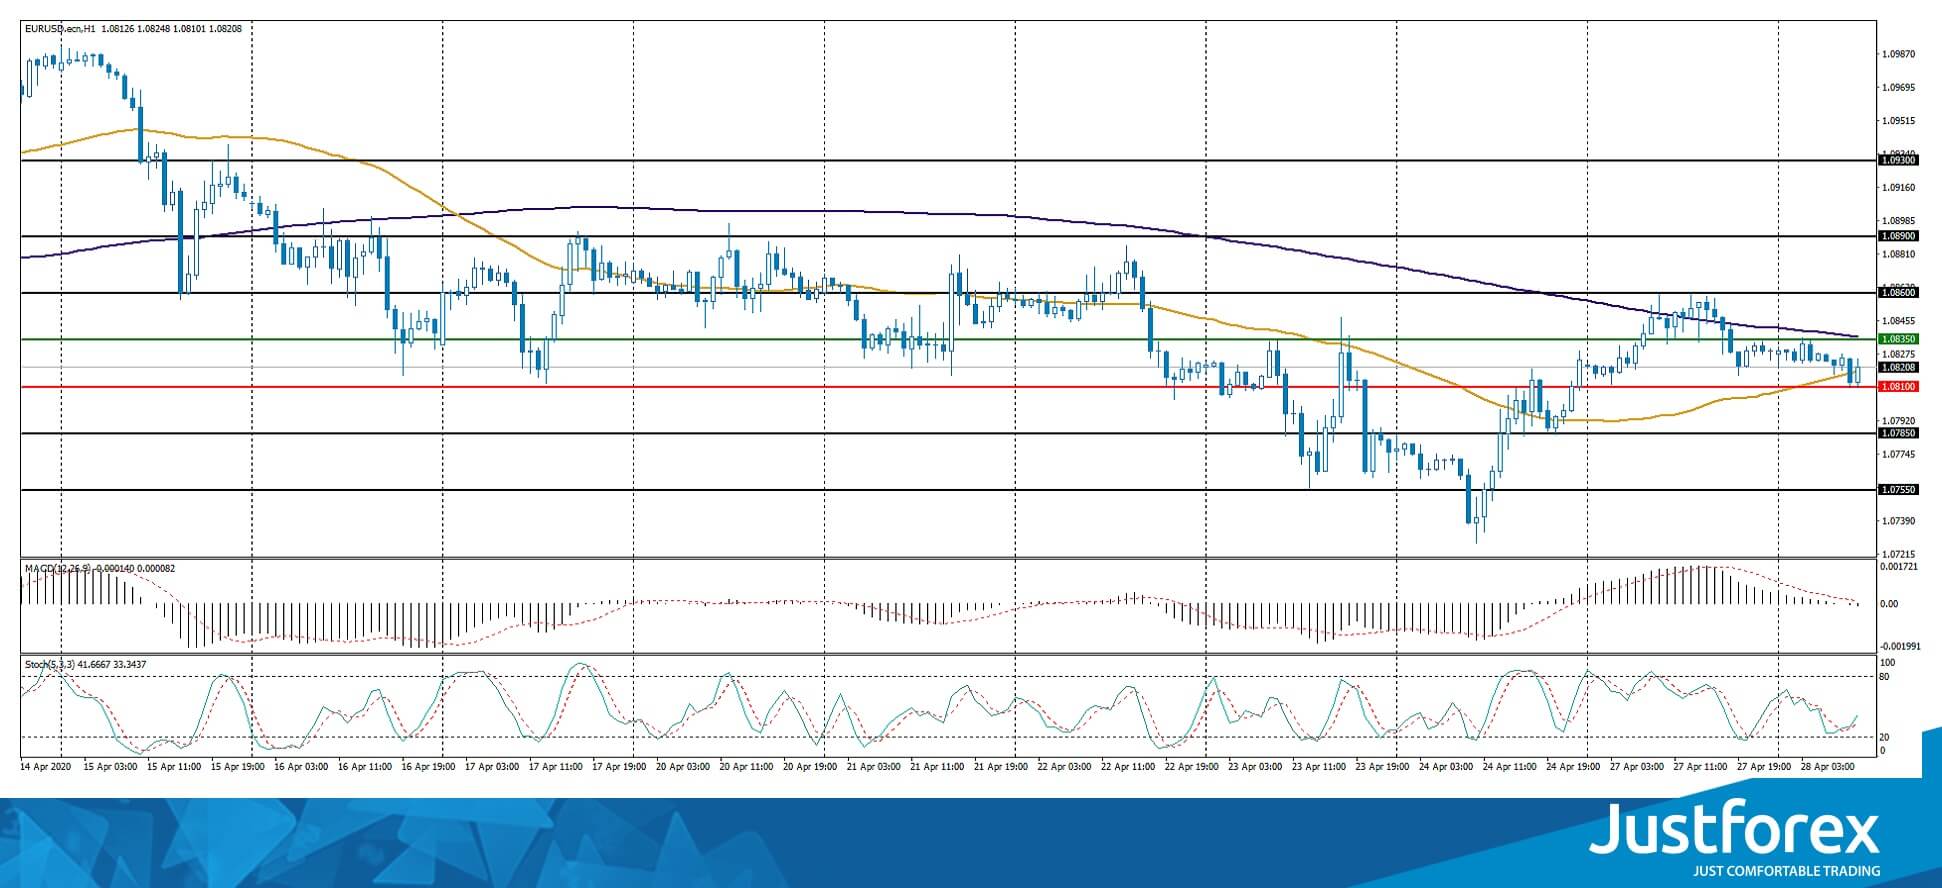
Indicators do not give accurate signals: the price has crossed 50 MA and 100 MA.
The MACD histogram is near the 0 mark.
Stochastic Oscillator is in the neutral zone, the %K line is above the %D line, which indicates the bullish sentiment.
Trading recommendations
Support levels: 1.0810, 1.0785, 1.0755
Resistance levels: 1.0835, 1.0860, 1.0890
If the price fixes above 1.0835, the EUR/USD currency pair is expected to grow. The movement is tending to 1.0870-1.0900.
An alternative could be a decrease in the EUR/USD quotes to 1.0780-1.0750.
The GBP/USD currency pair
Technical indicators of the currency pair:
Prev Open: 1.23626
Open: 1.24281
% chg. over the last day: +0.51
Day’s range: 1.24041 – 1.24375
52 wk range: 1.1466 – 1.3516
The GBP/USD currency pair is consolidating. There is no defined trend. GBP/USD quotes are testing local support and resistance levels: 1.2400 and 1.2450, respectively. The technical pattern signals a possible growth of the trading instrument. We expect statistics from the US. We recommend opening positions from key support and resistance levels.
The news feed on the UK economy is calm.
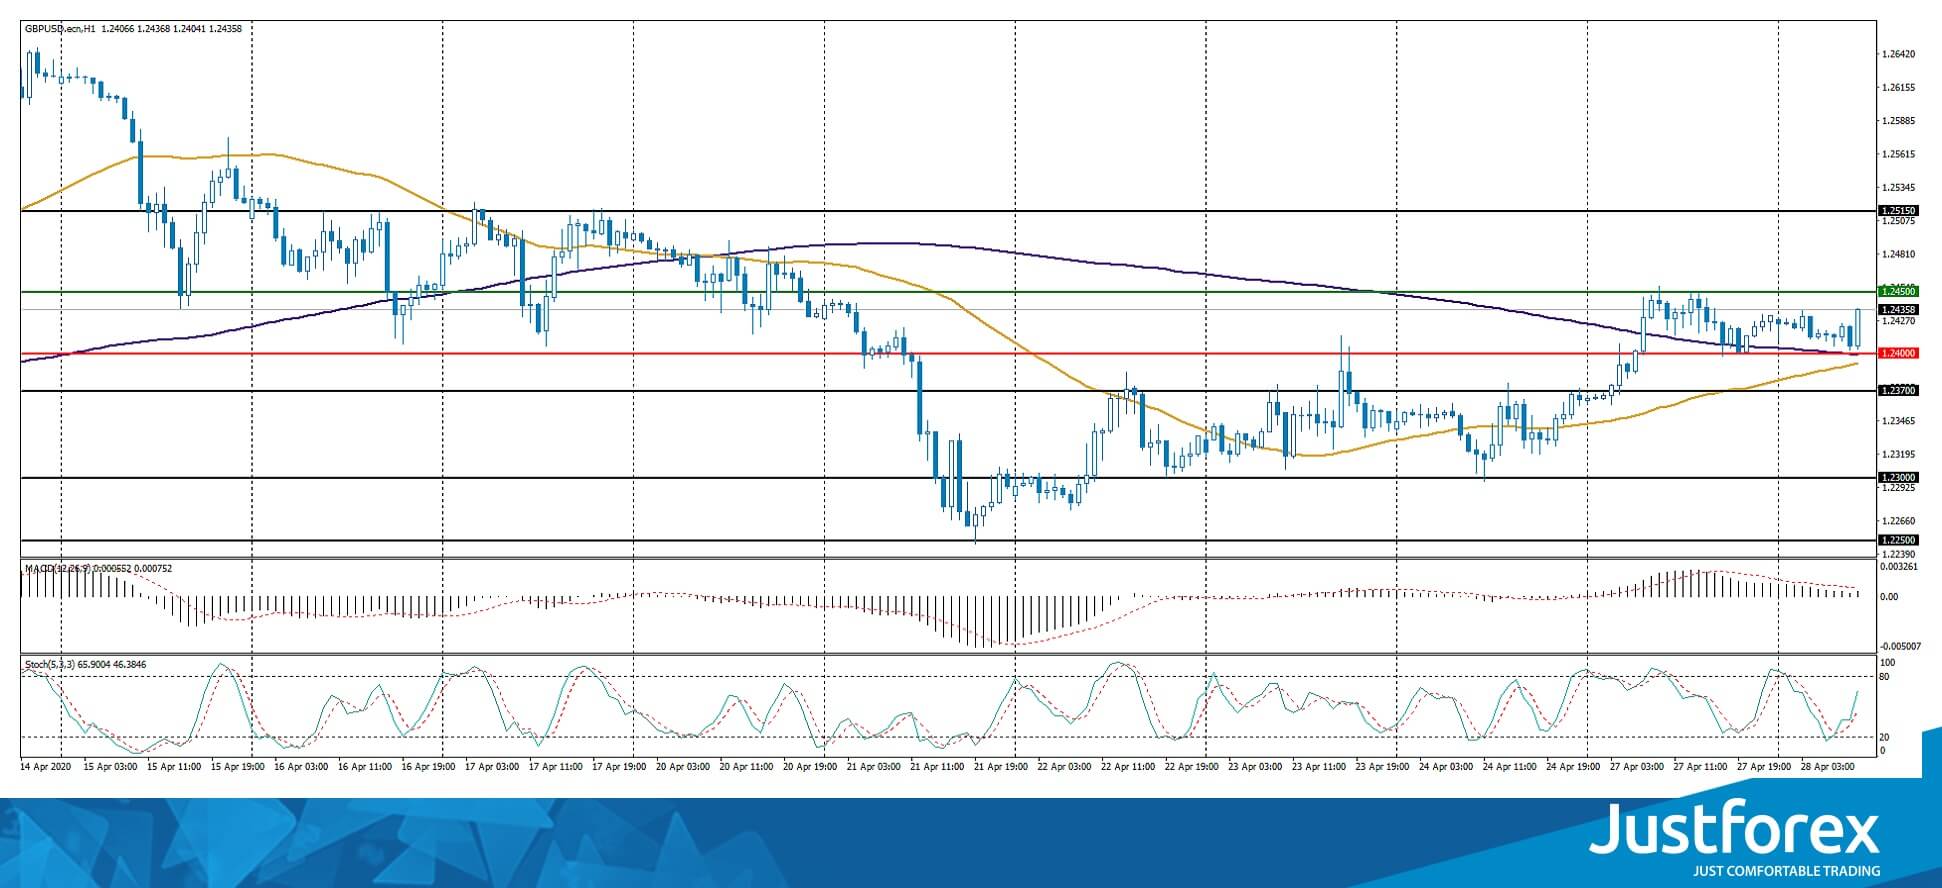
Indicators do not give accurate signals: 50 MA has started crossing 200 MA.
The MACD histogram is rising again, which indicates the growth of the GBP/USD currency pair.
Stochastic Oscillator is in the neutral zone, the %K line is above the %D line, which also gives a signal to buy GBP/USD.
Trading recommendations
Support levels: 1.2400, 1.2370, 1.2300
Resistance levels: 1.2450, 1.2515
If the price fixes above the resistance level of 1.2450, further growth of GBP/USD quotes is expected. The movement is tending to 1.2500-1.2525.
An alternative could be a decrease in the GBP/USD currency pair to 1.2350-1.2330.
The USD/CAD currency pair
Technical indicators of the currency pair:
Prev Open: 1.40948
Open: 1.40330
% chg. over the last day: -0.56
Day’s range: 1.40138 – 1.40727
52 wk range: 1.2949 – 1.4668
The loonie is still being traded in a flat. There is no defined trend. At the moment, the local support and resistance levels are 1.4020 and 1.4070, respectively. USD/CAD quotes are tending to decline. Today, investors will assess economic reports from the US. We also recommend paying attention to the dynamics of “black gold” prices. Positions should be opened from key levels.
The news feed on Canada’s economy is calm.
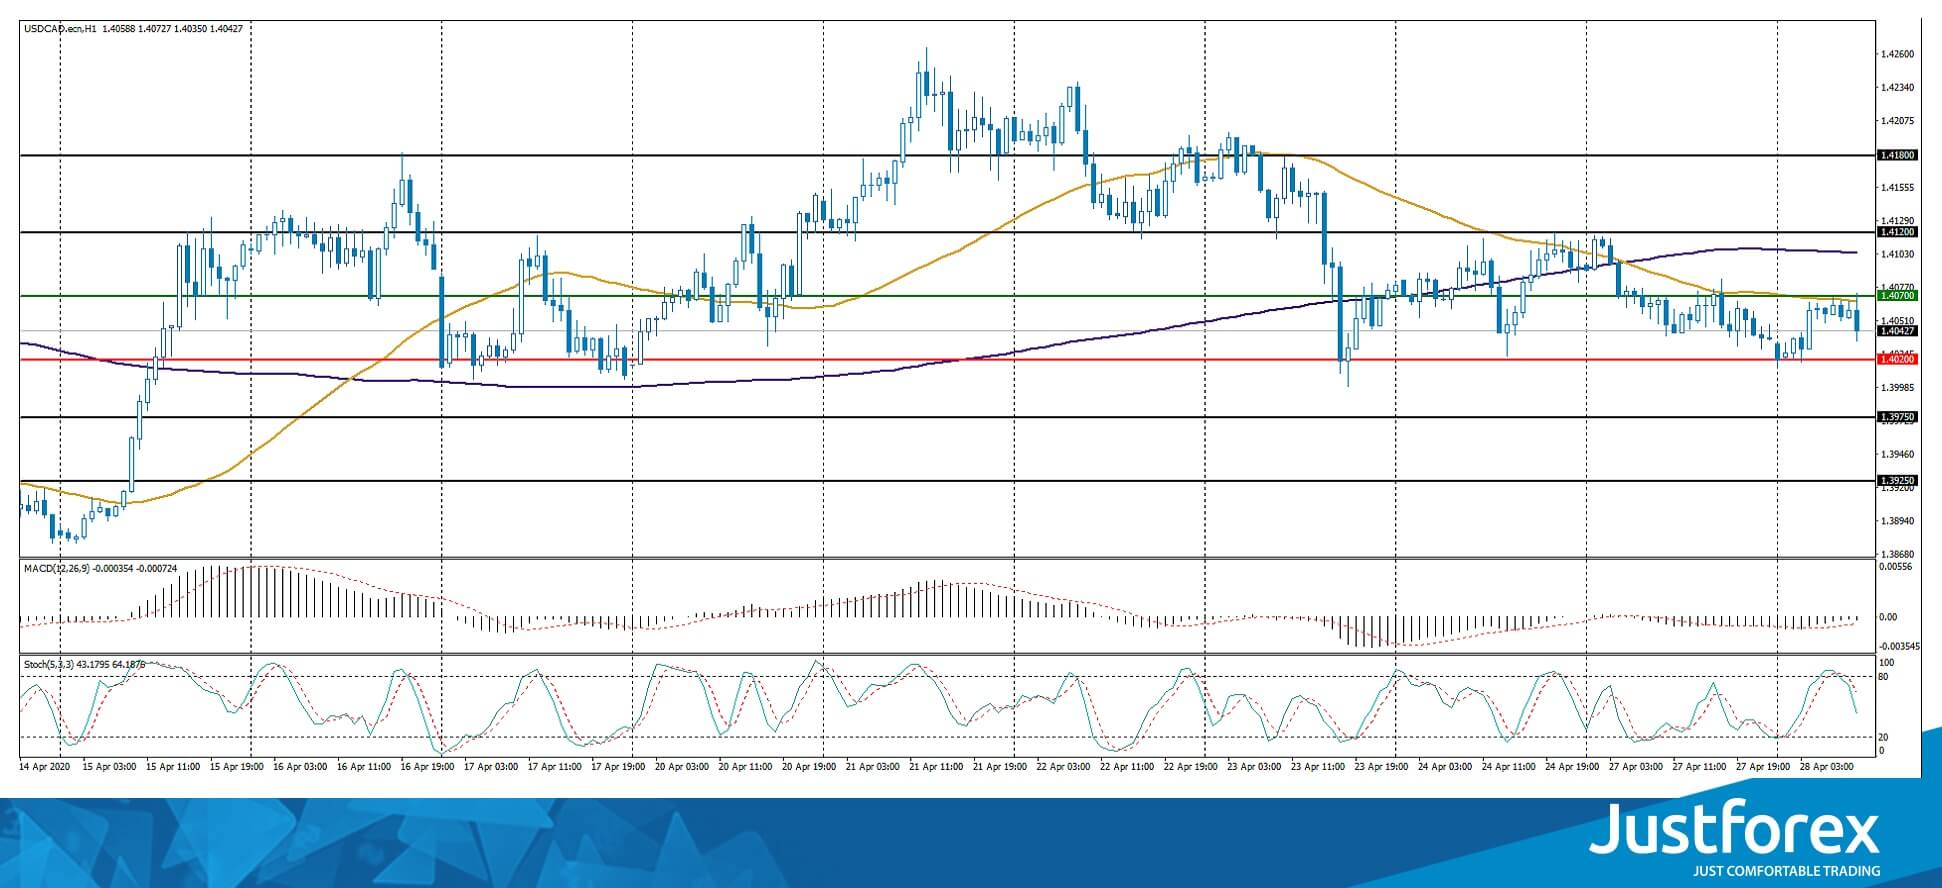
Indicators do not give accurate signals: the price has crossed 50 MA.
The MACD histogram is near the 0 mark.
Stochastic Oscillator is in the neutral zone, the %K line is below the %D line, which indicates the bearish sentiment.
Trading recommendations
Support levels: 1.4020, 1.3975, 1.3925
Resistance levels: 1.4070, 1.4120, 1.4180
If the price fixes below the support level of 1.4020, USD/CAD quotes are expected to fall. The movement is tending to 1.3980-1.3960.
An alternative could be the growth of the USD/CAD currency pair to 1.4120-1.4150.
The USD/JPY currency pair
Technical indicators of the currency pair:
Prev Open: 107.543
Open: 107.243
% chg. over the last day: -0.26
Day’s range: 107.043 – 107.338
52 wk range: 101.19 – 112.41
The USD/JPY currency pair is in a sideways trend. There is no defined trend. At the moment, USD/JPY quotes are testing a round level of 107.00. The 107.35 mark is the key resistance. A trading instrument is tending to decline. Today we recommend paying attention to economic reports, as well as to the dynamics of US government bonds yield. Positions should be opened from key levels.
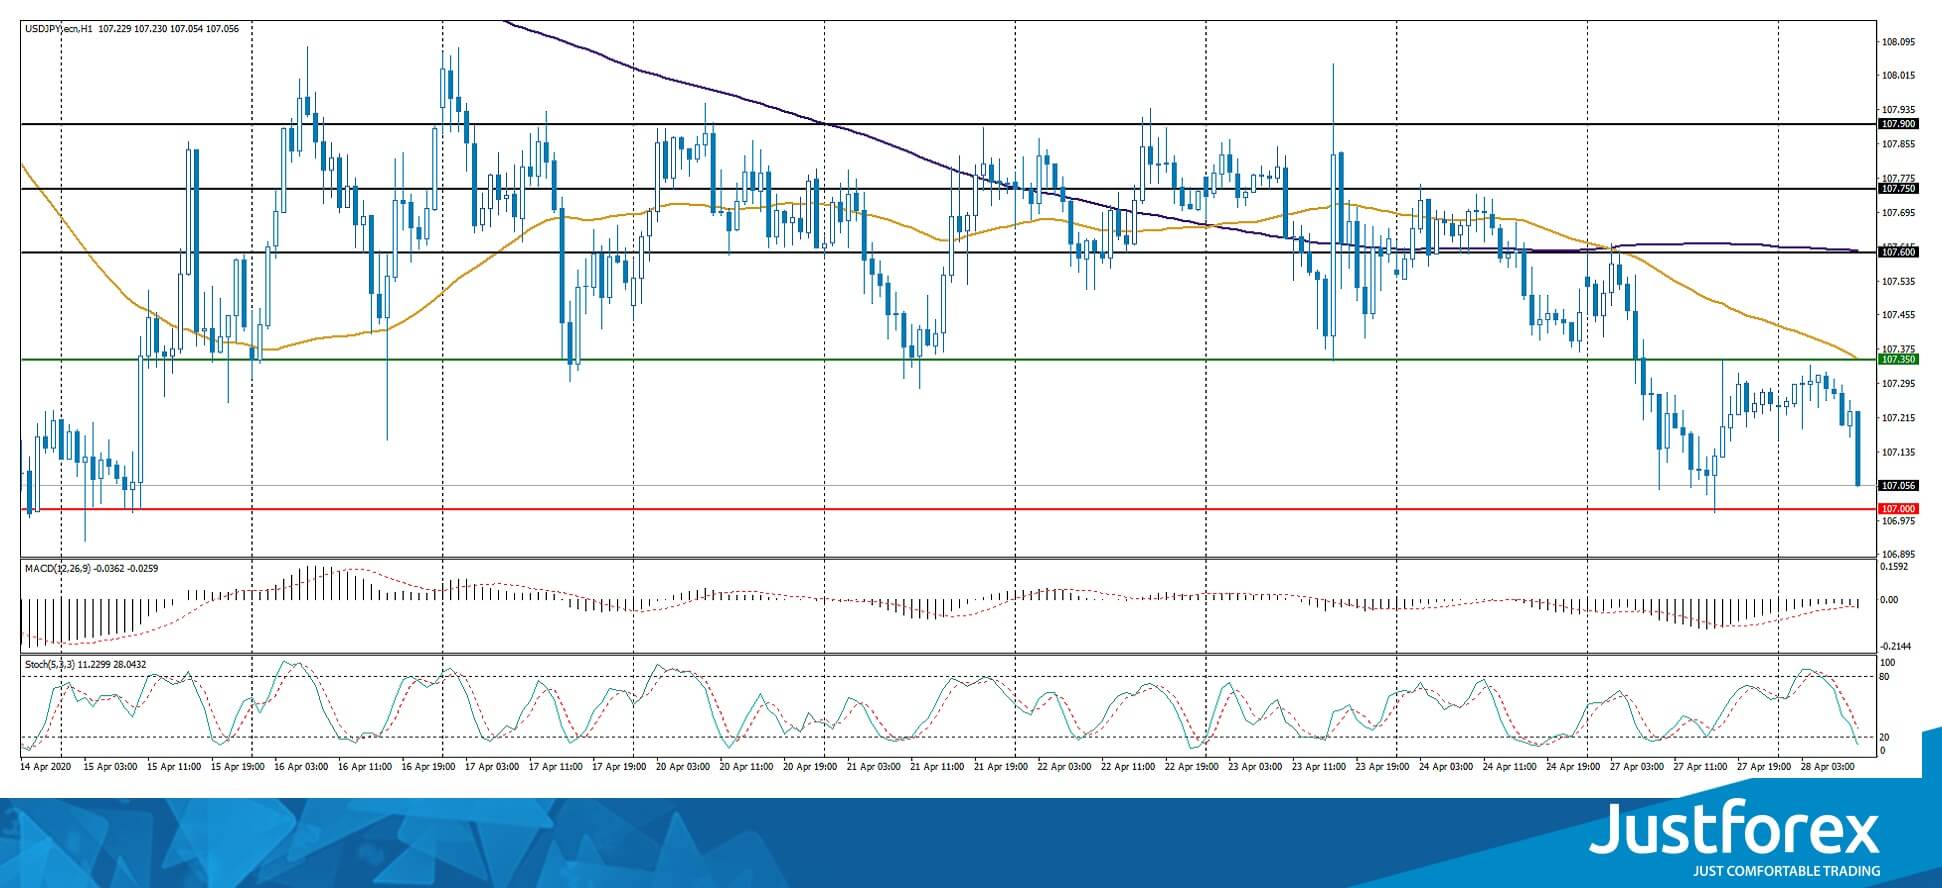
Indicators signal the power of sellers: the price has fixed below 50 MA and 100 MA.
The MACD histogram has started declining again, indicating the bearish sentiment.
Stochastic Oscillator is in the neutral zone, the %K line is below the %D line, which also gives a signal to sell USD/JPY.
Trading recommendations
Support levels: 107.00, 106.50
Resistance levels: 107.35, 107.60, 107.75
If the price fixes below the support level of 107.00, USD/JPY quotes are expected to fall. The movement is tending to 106.70-106.50.
An alternative could be the growth of the USD/JPY currency pair to 107.50-107.70.


