
The EUR/USD currency pair
Technical indicators of the currency pair:
Prev Open: 1.08034
Open: 1.08159
% chg. over the last day: +0.10
Day’s range: 1.08077 – 1.08284
52 wk range: 1.0777 – 1.1494
The technical pattern is still ambiguous on the EUR/USD currency pair. A trading instrument is consolidating. Currently, the local support and resistance levels are 1.0800 and 1.0825, respectively. The conflict between Washington and Beijing has escalated again after White House trade adviser, Peter Navarro, said that China hid the COVID-19 virus from the world for two months. Fed Chairman, Jerome Powell, said the US economy could decrease to 30% in the second quarter. We recommend opening positions from key levels.
Today, the publication of important economic releases is not expected.
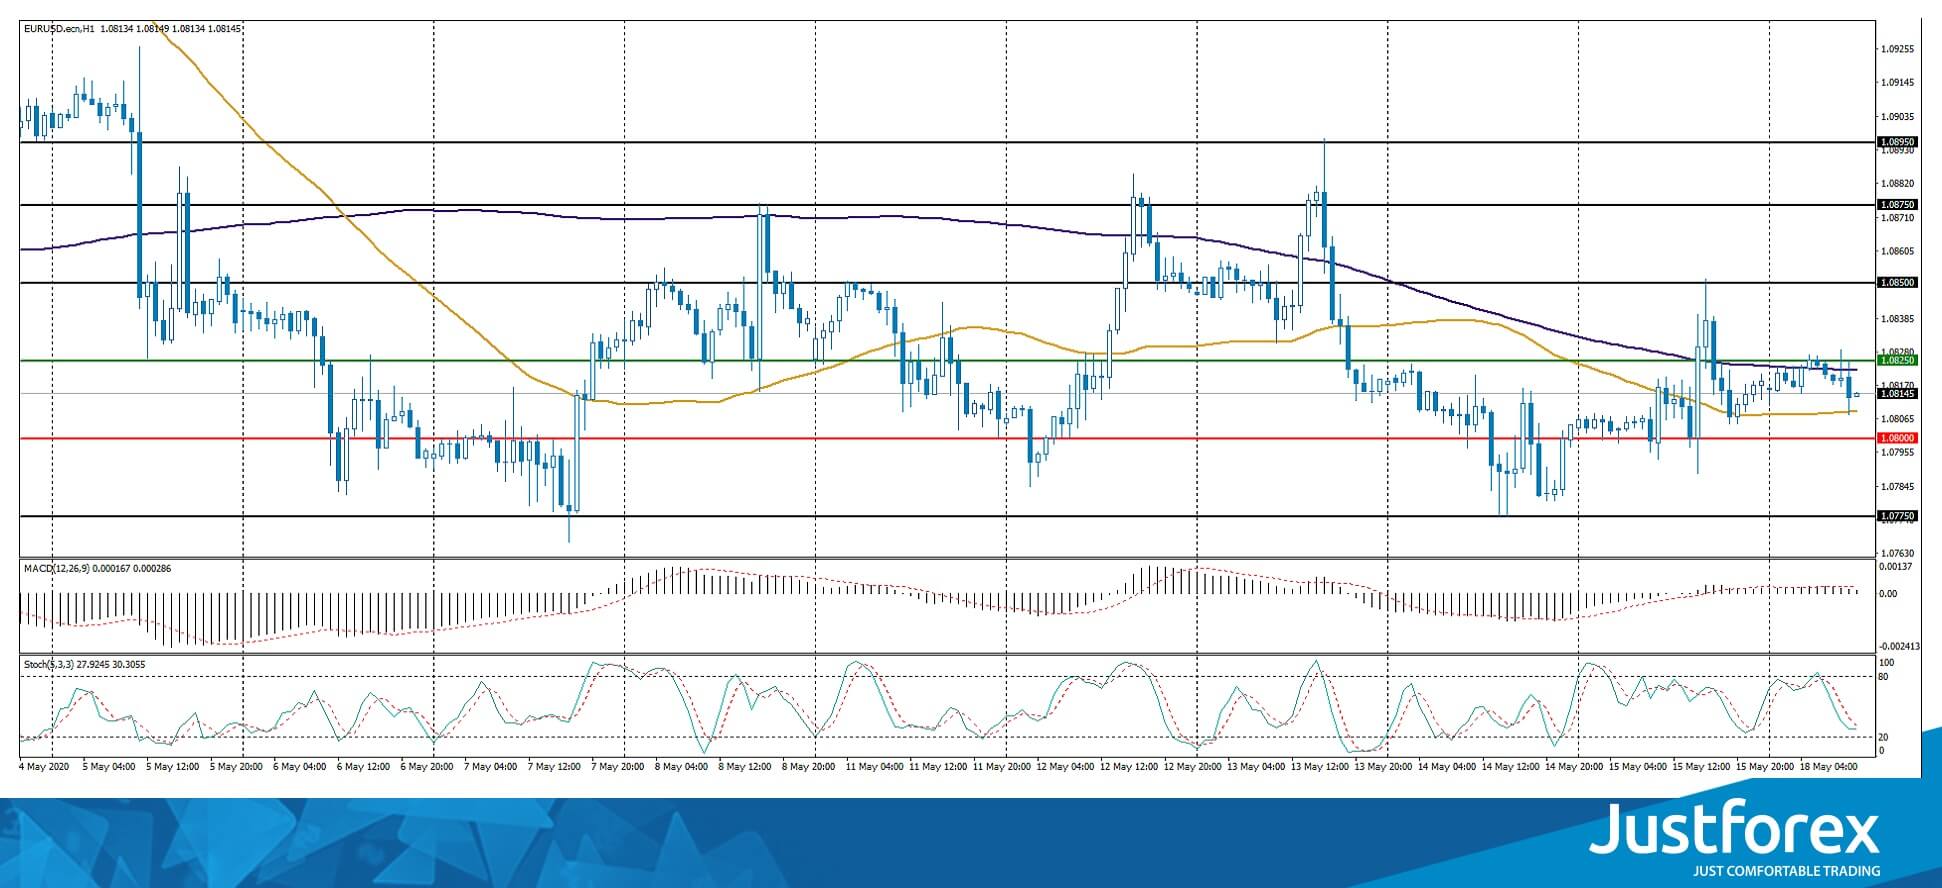
Indicators do not give accurate signals: the price has crossed 50 MA and 100 MA.
The MACD histogram is near the 0 mark.
Stochastic Oscillator is in the neutral zone, the %K line is below the %D line, which indicates the bearish sentiment.
Trading recommendations
Support levels: 1.0800, 1.0775
Resistance levels: 1.0825, 1.0850, 1.0875
If the price fixes below 1.0800, the EUR/USD currency pair is expected to fall. The movement is tending to 1.0775-1.0750.
An alternative could be the growth of EUR/USD quotes to 1.0850-1.0870.
The GBP/USD currency pair
Technical indicators of the currency pair:
Prev Open: 1.22215
Open: 1.20756
% chg. over the last day: -0.17
Day’s range: 1.20751 – 1.21254
52 wk range: 1.1466 – 1.3516
GBP/USD quotes continue to show a negative trend. The British pound has updated local lows again. The trading instrument is currently consolidating. The local support and resistance levels are 1.2075 and 1.2135, respectively. The British pound has the potential for further decline relative to the greenback. We recommend opening positions from key levels.
The news feed on the UK economy is calm.
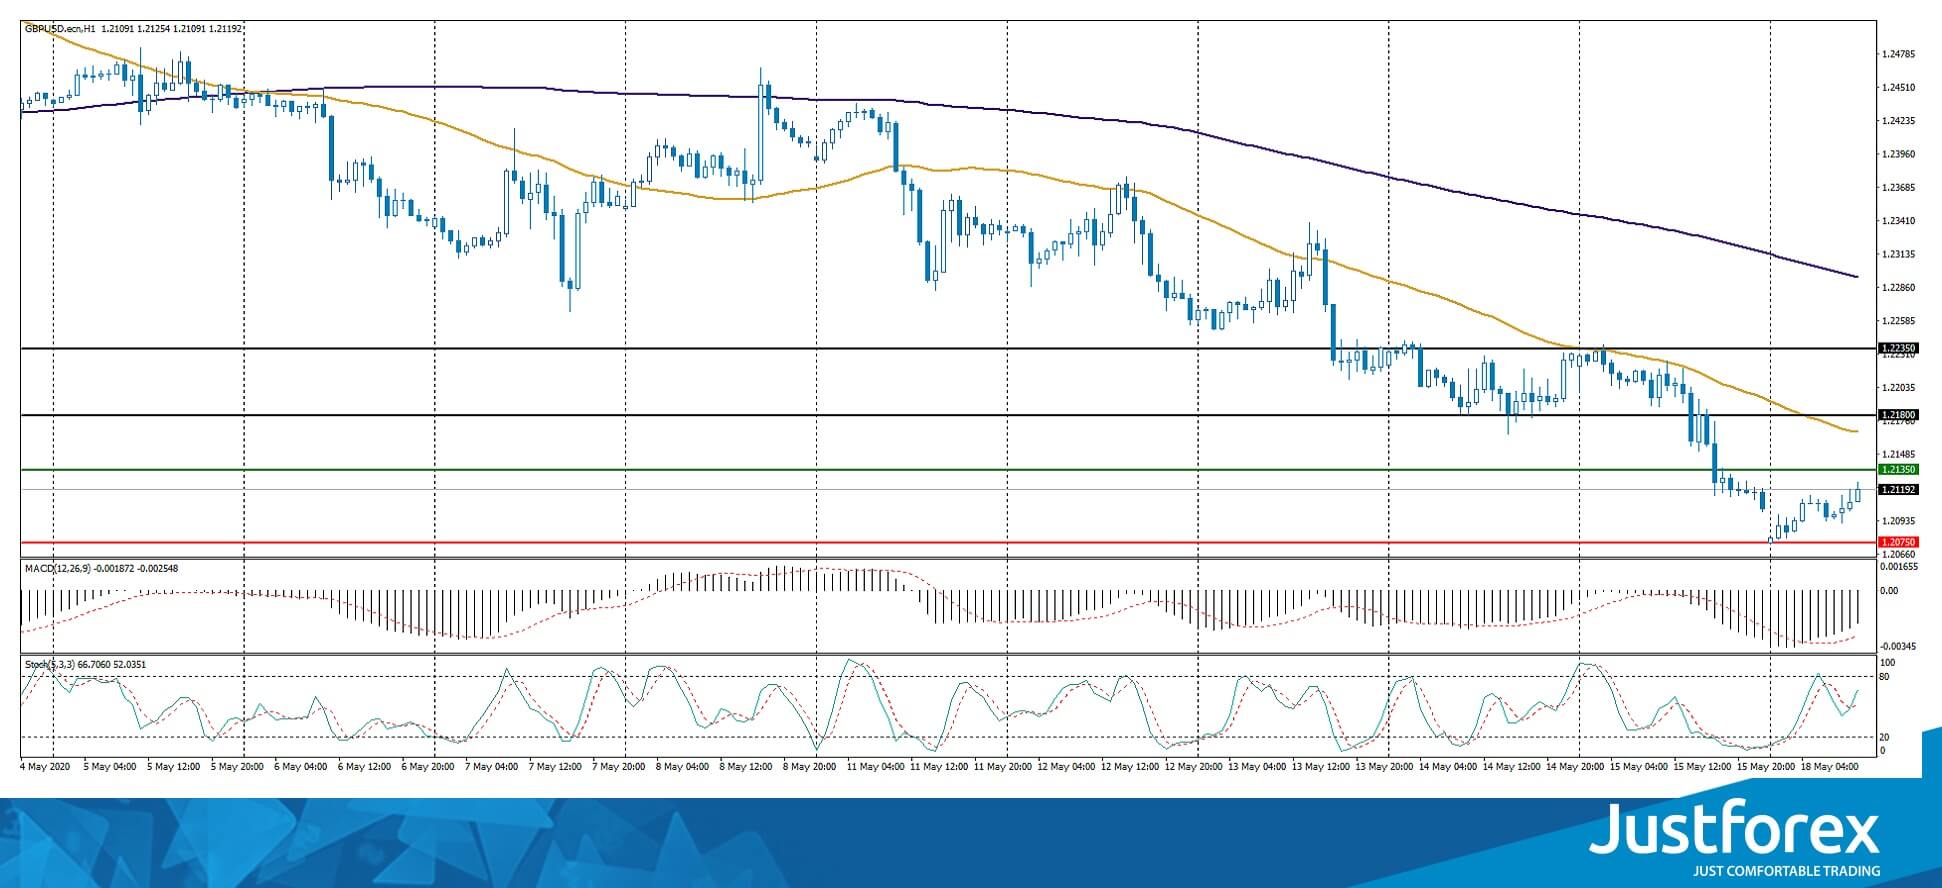
Indicators do not give accurate signals: the price has fixed below 50 MA and 100 MA.
The MACD histogram is in the negative zone, but above the signal line, which gives a weak signal to sell GBP/USD.
Stochastic Oscillator is in the neutral zone, the %K line has crossed the %D line. There are no signals at the moment.
Trading recommendations
Support levels: 1.2075, 1.2040
Resistance levels: 1.2135, 1.2180, 1.2235
If the price fixes below 1.2075, a further drop in GBP/USD quotes is expected. The movement is tending to 1.2040-1.2020.
An alternative could be the growth of the GBP/USD currency pair to 1.2180-1.2220.
The USD/CAD currency pair
Technical indicators of the currency pair:
Prev Open: 1.40430
Open: 1.41067
% chg. over the last day: +0.43
Day’s range: 1.40597 – 1.41117
52 wk range: 1.2949 – 1.4668
There is an ambiguous technical pattern on the USD/CAD currency pair. The loonie is in a sideways trend. At the moment, USD/CAD quotes are testing the support level of 1.4065. The 1.4115 mark is the key resistance. The Canadian dollar is supported by the recovery of “black gold” prices. A trading instrument is tending to decline. Positions should be opened from key levels.
The publication of important economic releases from Canada is not planned.
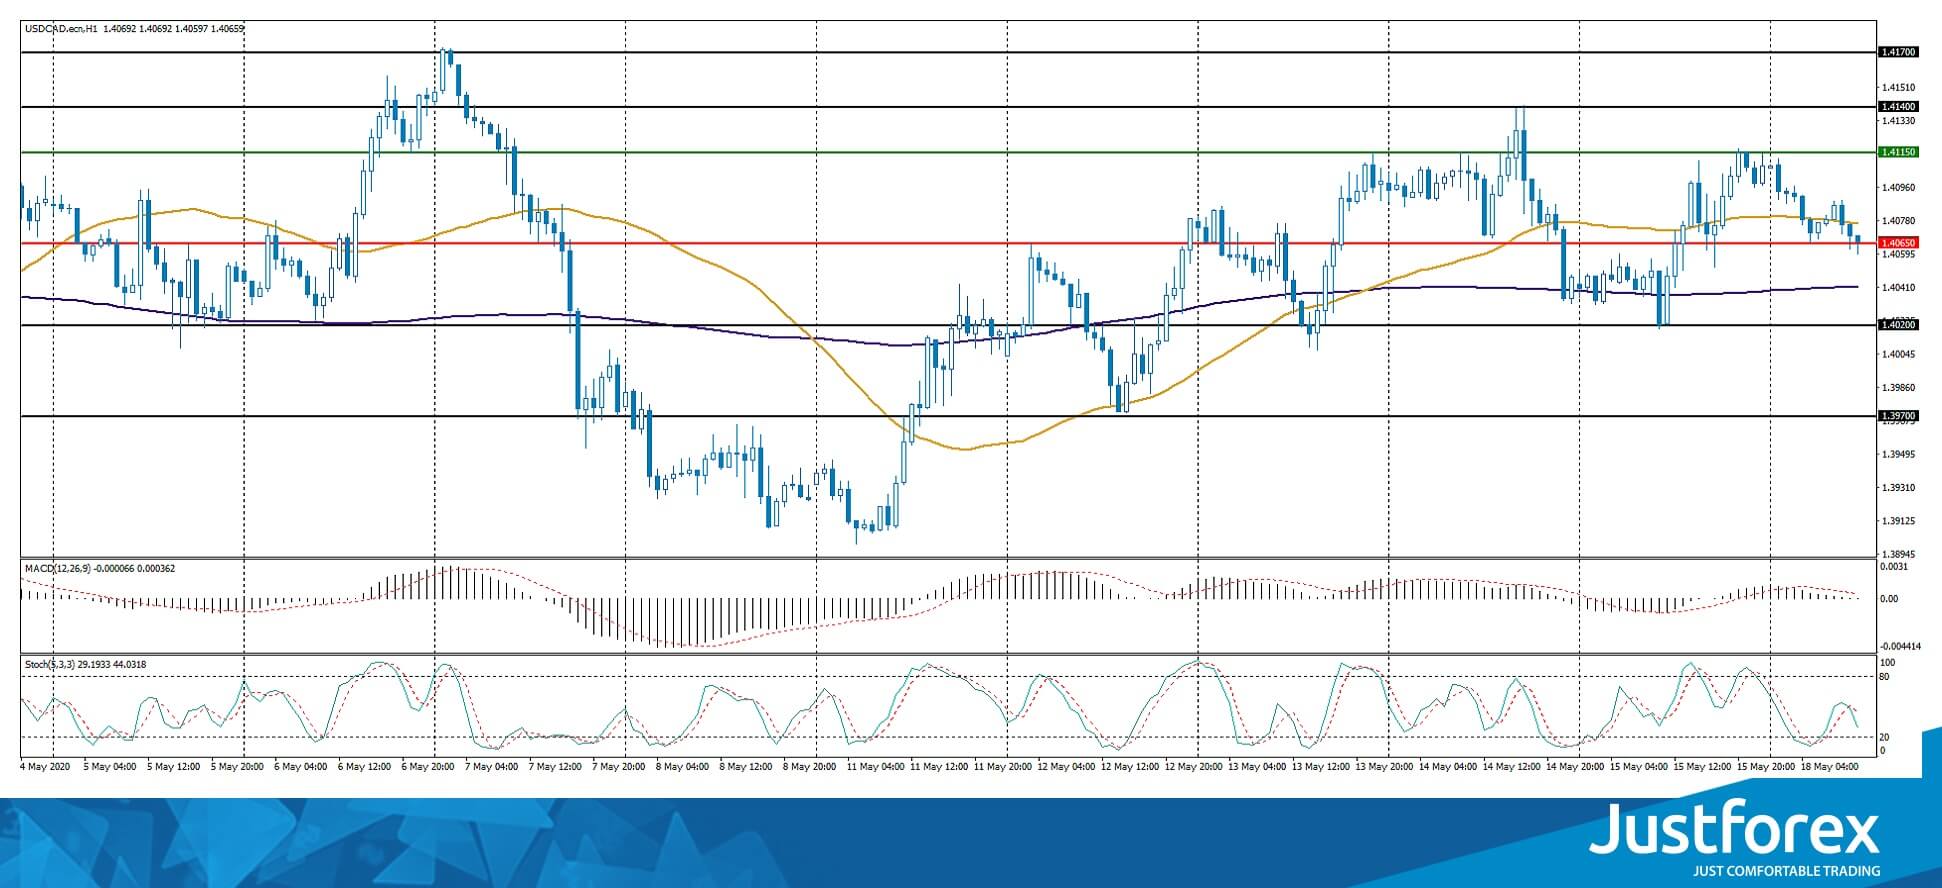
Indicators do not give accurate signals: the price has crossed 50 MA.
The MACD histogram is near the 0 mark.
Stochastic Oscillator is in the neutral zone, the %K line is below the %D line, which indicates the bearish sentiment.
Trading recommendations
Support levels: 1.4065, 1.4020, 1.3970
Resistance levels: 1.4115, 1.4140, 1.4170
If the price below the support level of 1.4065, a drop in USD/CAD quotes is expected. The movement is tending to 1.4030-1.4000.
An alternative could be the growth of the USD/CAD currency pair to 1.4140-1.4170.
The USD/JPY currency pair
Technical indicators of the currency pair:
Prev Open: 107.250
Open: 107.078
% chg. over the last day: -0.21
Day’s range: 107.068 – 107.309
52 wk range: 101.19 – 112.41
The USD/JPY currency pair is being traded in a flat. There is no defined trend. Financial market participants expect additional drivers. USD/JPY quotes are testing the following key support and resistance levels: 107.05 and 107.40, respectively. We recommend paying attention to the dynamics of US government bonds yield. Positions should be opened from key levels.
According to preliminary data, Japan’s GDP fell by 0.9% (q/q) in the first quarter. Experts expected a decrease by 1.2%.
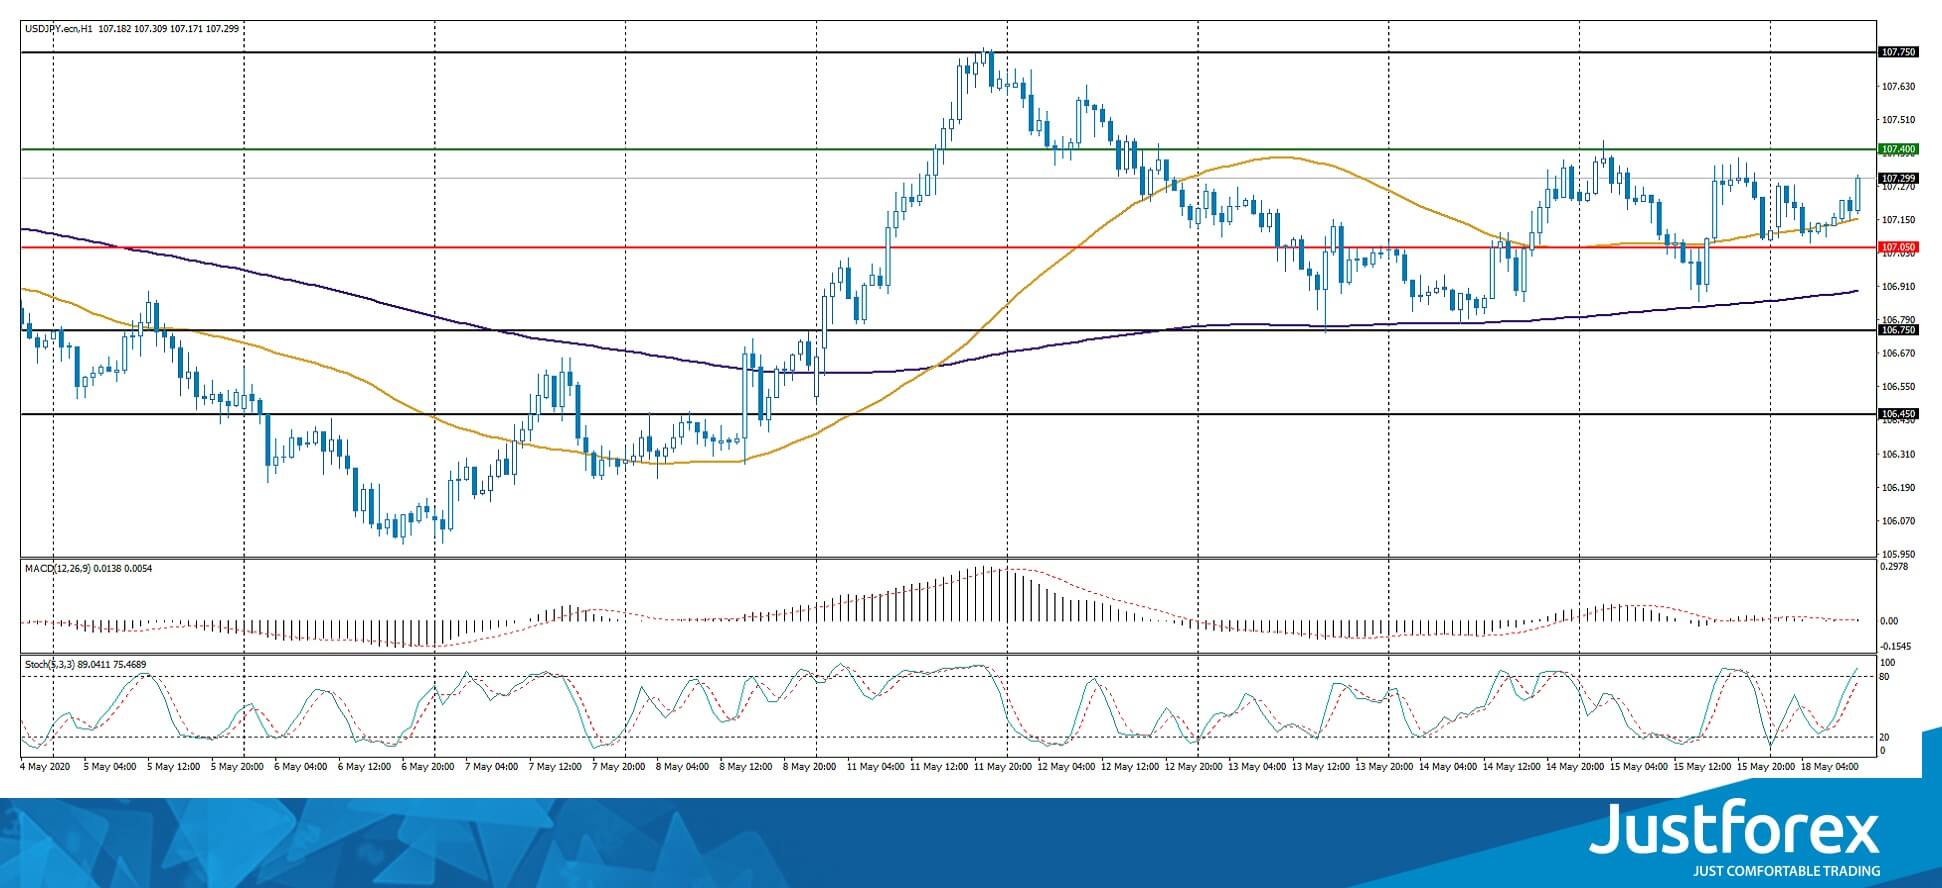
Indicators do not give accurate signals: the price has crossed 50 MA.
The MACD histogram is near the 0 mark.
Stochastic Oscillator is in the neutral zone, the %K line is above the %D line, which indicates the bullish sentiment.
Trading recommendations
Support levels: 107.05, 106.75, 106.45
Resistance levels: 107.40, 107.75
If the price fixes above the resistance level of 107.40, USD/JPY quotes are expected to rise. The movement is tending to 107.70-108.00.
An alternative could be a decrease in the USD/JPY currency pair to 106.80-106.60.


