
The EUR/USD currency pair
Technical indicators of the currency pair:
Prev Open: 1.11148
Open: 1.11349
% chg. over the last day: +0.16
Day’s range: 1.11153 – 1.11385
52 wk range: 1.0777 – 1.1494
The EUR/USD currency pair has become stable after prolonged growth. Quotes are currently consolidating. The local support and resistance levels are 1.1100 and 1.1150, respectively. The demand for risky assets is still high amid hopes of a recovery in the global economy. Investors continue to monitor the conflict between Washington and Beijing, as well as mass protests throughout the United States. Positions should be opened from key levels.
Today, the publication of important economic releases is not expected.
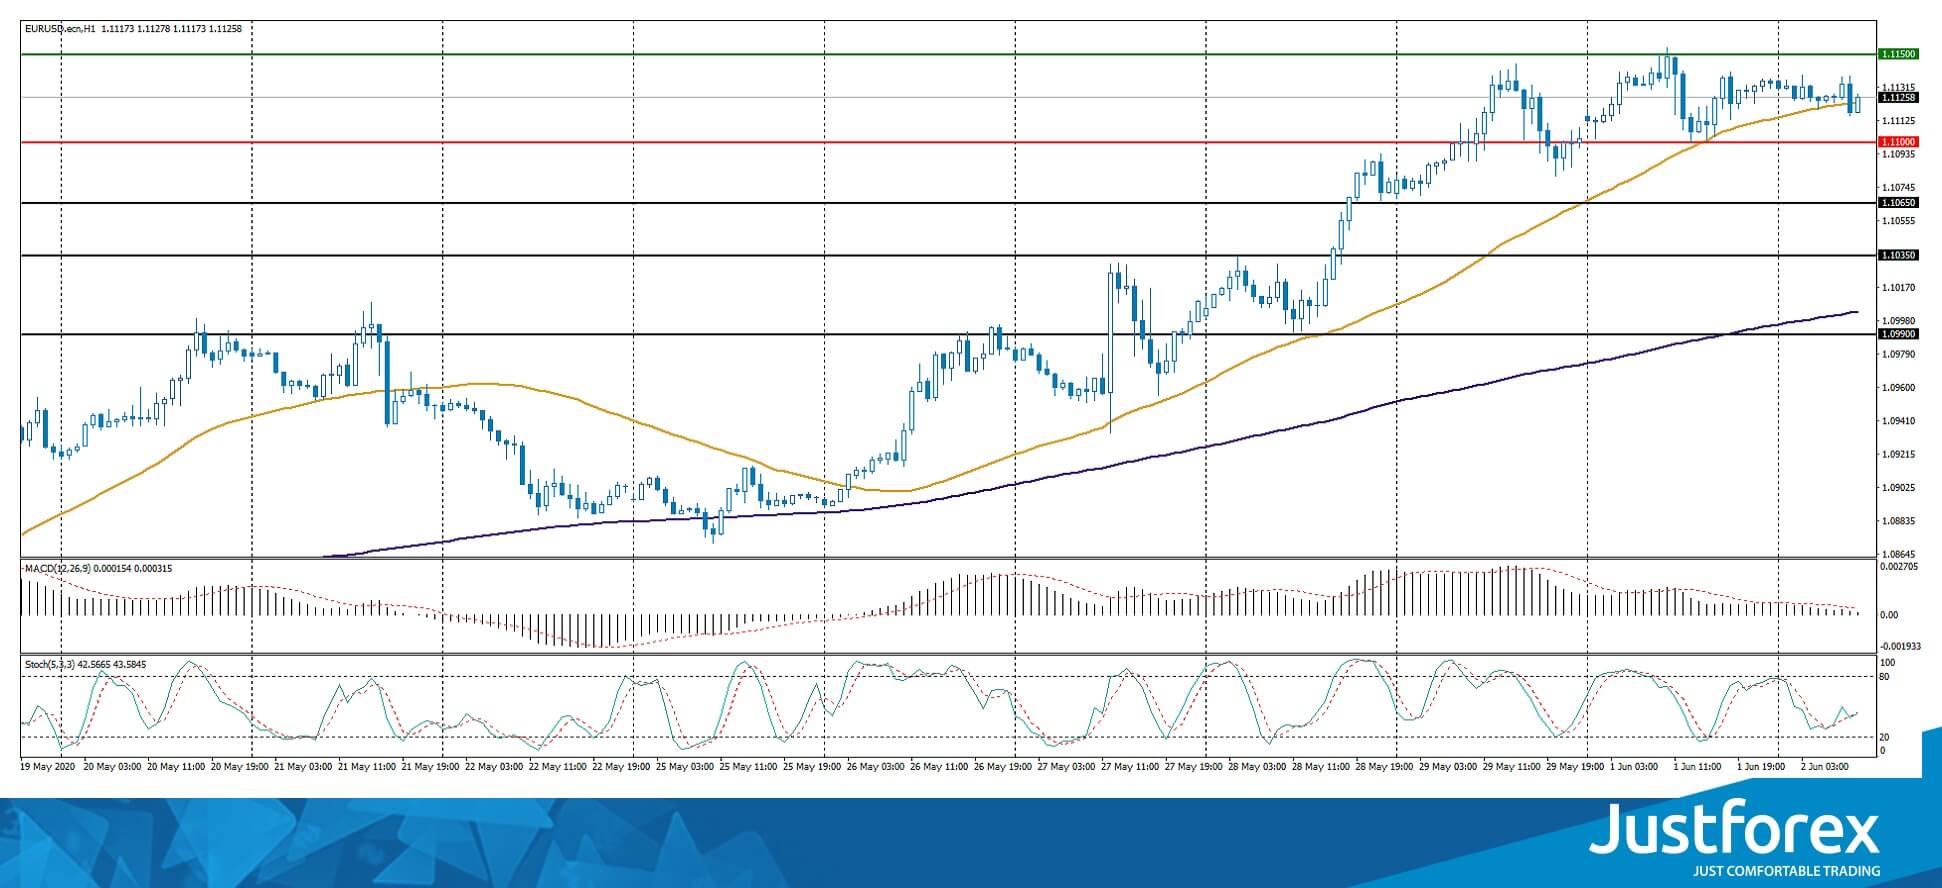
Indicators do not give accurate signals: the price has crossed 50 MA.
The MACD histogram is near the 0 mark.
Stochastic Oscillator is in the neutral zone, the %K line has crossed the %D line. There are no signals at the moment.
Trading recommendations
Support levels: 1.1100, 1.1065, 1.1035
Resistance levels: 1.1150, 1.1180, 1.1200
If the price fixes above 1.1150, further growth of EUR/USD quotes is expected. The movement is tending to the round level of 1.1200.
An alternative could be a decrease in the EUR/USD currency pair to 1.1070-1.1050.
The GBP/USD currency pair
Technical indicators of the currency pair:
Prev Open: 1.23235
Open: 1.24889
% chg. over the last day: +1.20
Day’s range: 1.24784 – 1.25543
52 wk range: 1.1466 – 1.3516
There are aggressive purchases on the GBP/USD currency pair. During yesterday’s and today’s trading sessions, the growth of quotes exceeded 200 points. The British pound has reached 4-week highs. The trading instrument is currently consolidating. The key range is 1.2480-1.2550. The demand for risky assets is still high. The British pound has the potential for further growth. We recommend opening positions from key levels.
The news feed on the UK economy is calm.
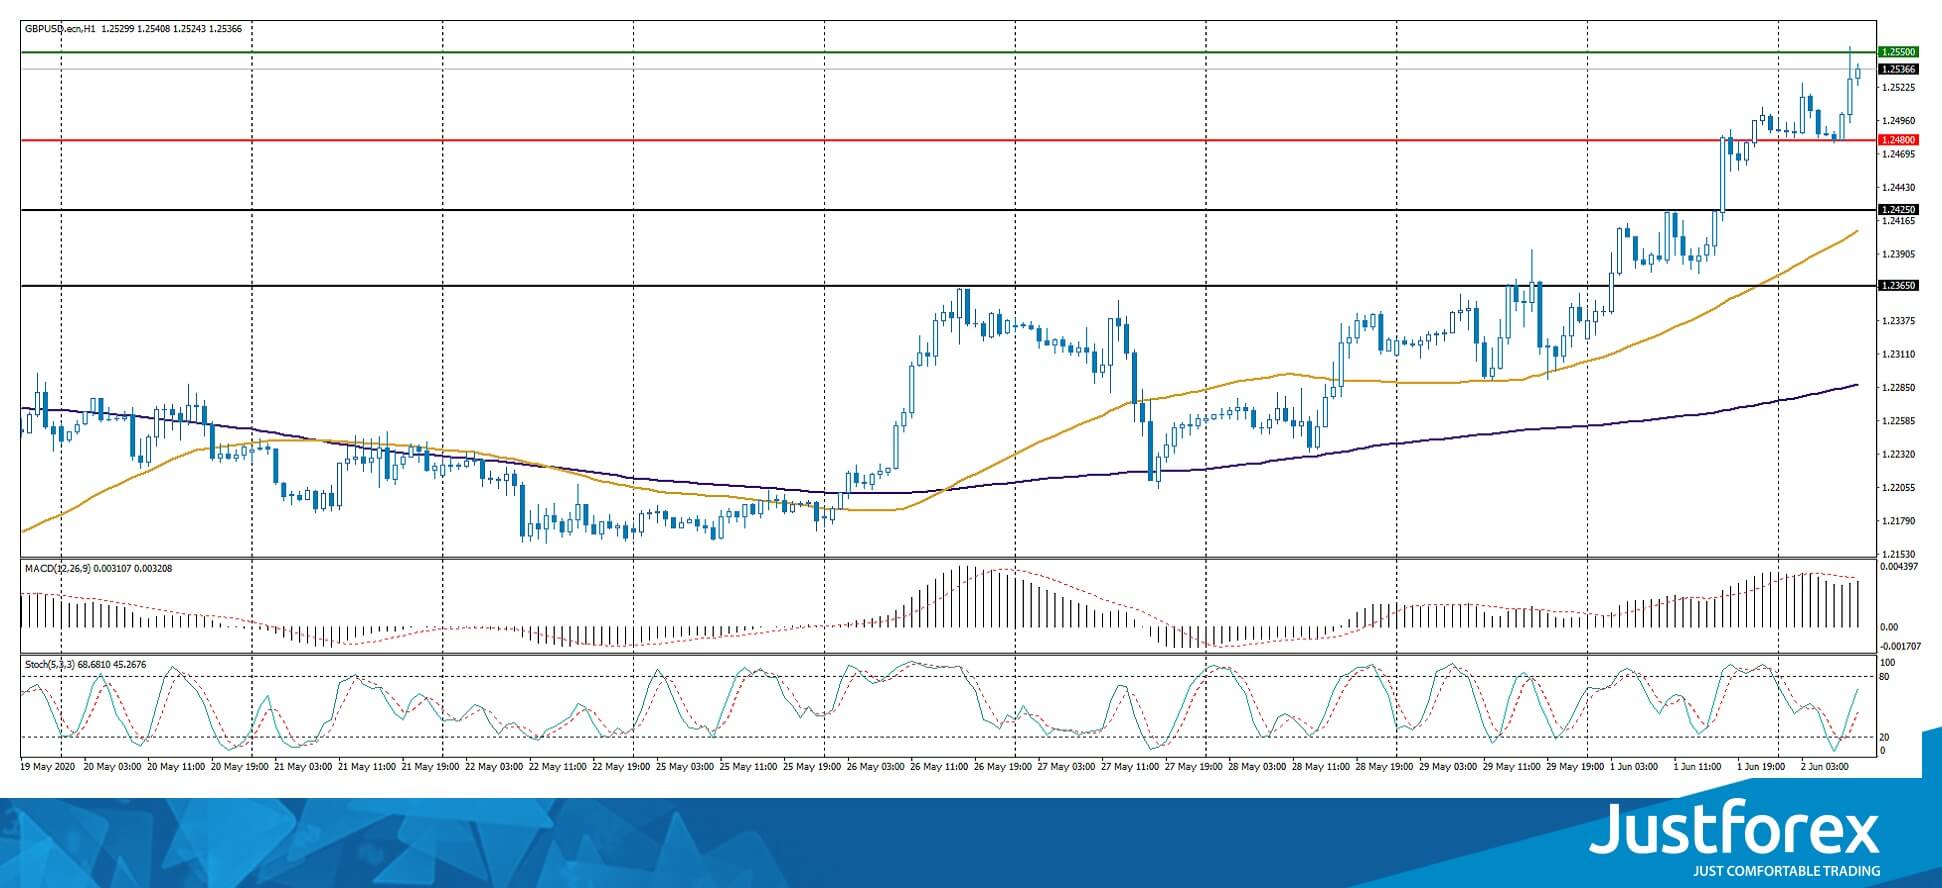
Indicators signal the power of buyers: the price has fixed above 50 MA and 100 MA.
The MACD histogram is in the positive zone and continues to rise, which gives a strong signal to buy GBP/USD.
Stochastic Oscillator is in the neutral zone, the %K line is above the %D line, which also indicates the bullish sentiment.
Trading recommendations
Support levels: 1.2480, 1.2425, 1.2365
Resistance levels: 1.2550, 1.2600
If the price fixes above 1.2550, further growth of GBP/USD quotes is expected. The movement is tending to 1.2600-1.2630.
An alternative could be a decrease in the GBP/USD currency pair to 1.2440-1.2400.
The USD/CAD currency pair
Technical indicators of the currency pair:
Prev Open: 1.37748
Open: 1.35745
% chg. over the last day: -1.49
Day’s range: 1.35297 – 1.35852
52 wk range: 1.2949 – 1.4668
USD/CAD quotes show a steady downtrend. During yesterday’s and today’s trading sessions, the drop in quotes exceeded 240 points. The recovery of “black gold” prices supports the loonie. The trading instrument is currently consolidating. The local support and resistance levels are 1.3530 and 1.3585, respectively. USD/CAD quotes have the potential for further decline. Positions should be opened from key levels.
The news feed on Canada’s economy is calm.
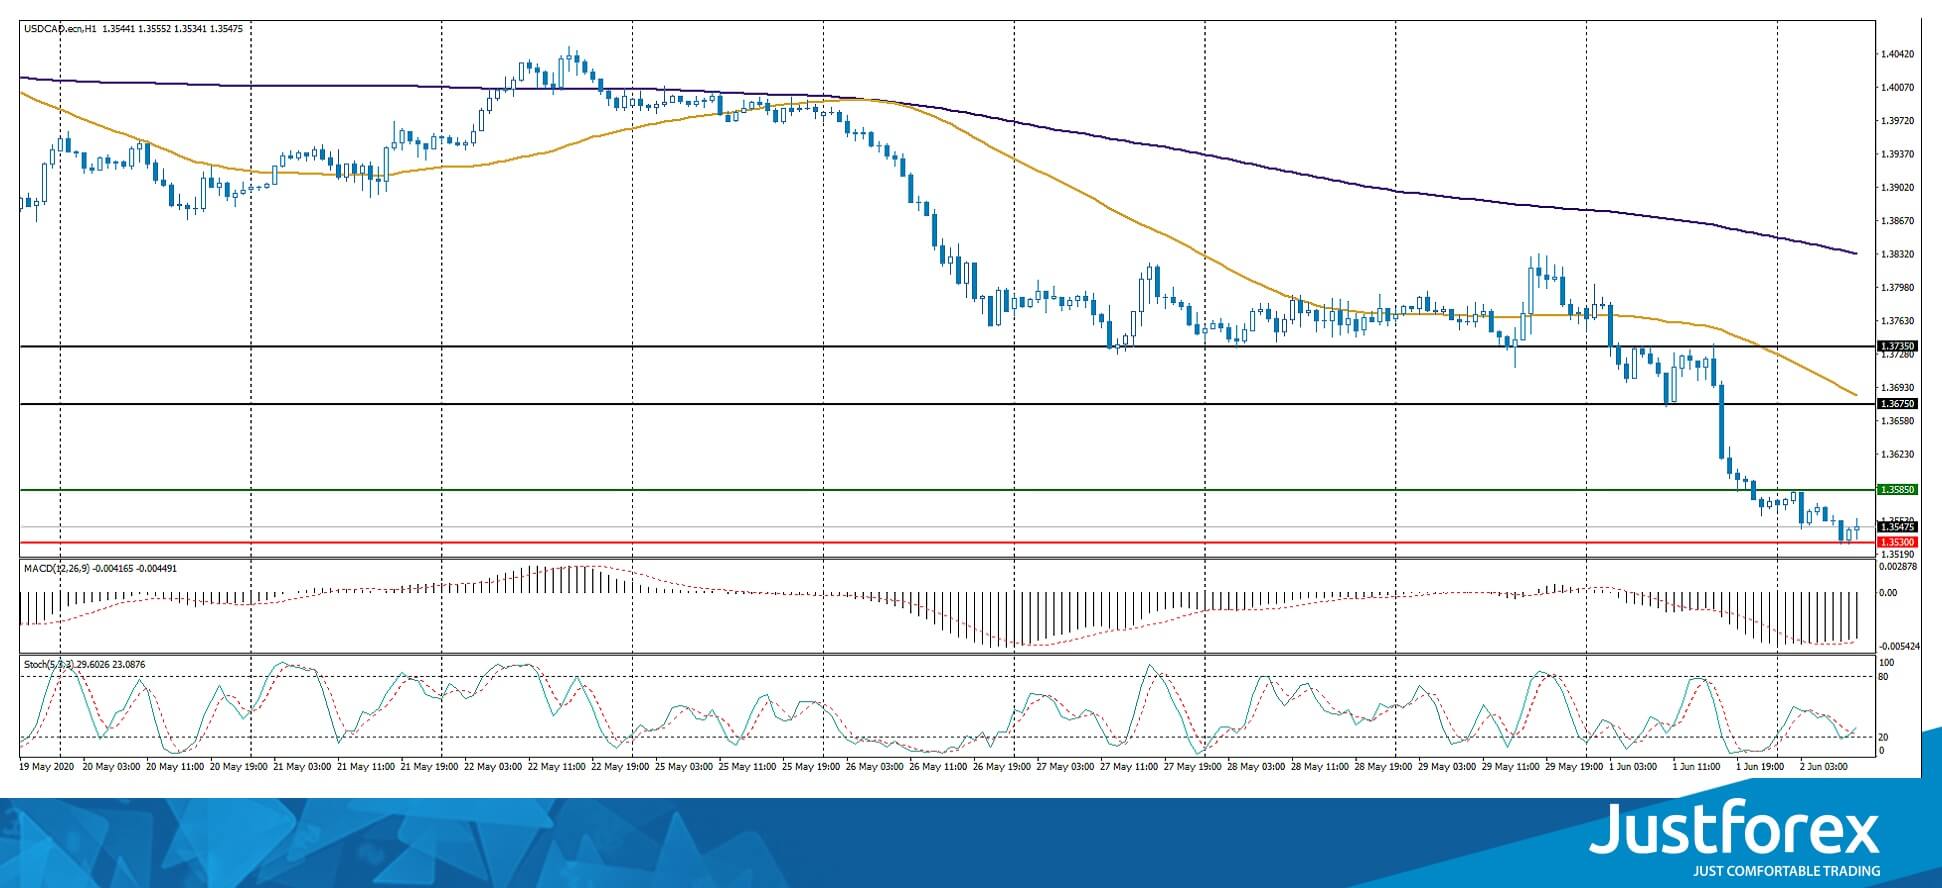
Indicators signal the power of sellers: the price has fixed below 50 MA and 100 MA.
The MACD histogram is in the negative zone, indicating the bearish sentiment.
Stochastic Oscillator is in the neutral zone, the %K line has crossed the %D line. There are no signals at the moment.
Trading recommendations
Support levels: 1.3530, 1.3450
Resistance levels: 1.3585, 1.3675, 1.3735
If the price fixes below 1.3530, a further drop in USD/CAD quotes is expected. The movement is tending to 1.3460-1.3420.
An alternative could be the growth of the USD/CAD currency pair to 1.3640-1.3660.
The USD/JPY currency pair
Technical indicators of the currency pair:
Prev Open: 107.679
Open: 107.584
% chg. over the last day: -0.12
Day’s range: 107.513 – 107.835
52 wk range: 101.19 – 112.41
The technical pattern is still ambiguous on the USD/JPY currency pair. The trading instrument is in a sideways trend. At the moment, the local support and resistance levels are 107.65 and 107.90, respectively. Investors expect additional drivers. We recommend paying attention to the dynamics of US government bonds yield. Positions should be opened from key levels.
The news feed on Japan’s economy is calm.
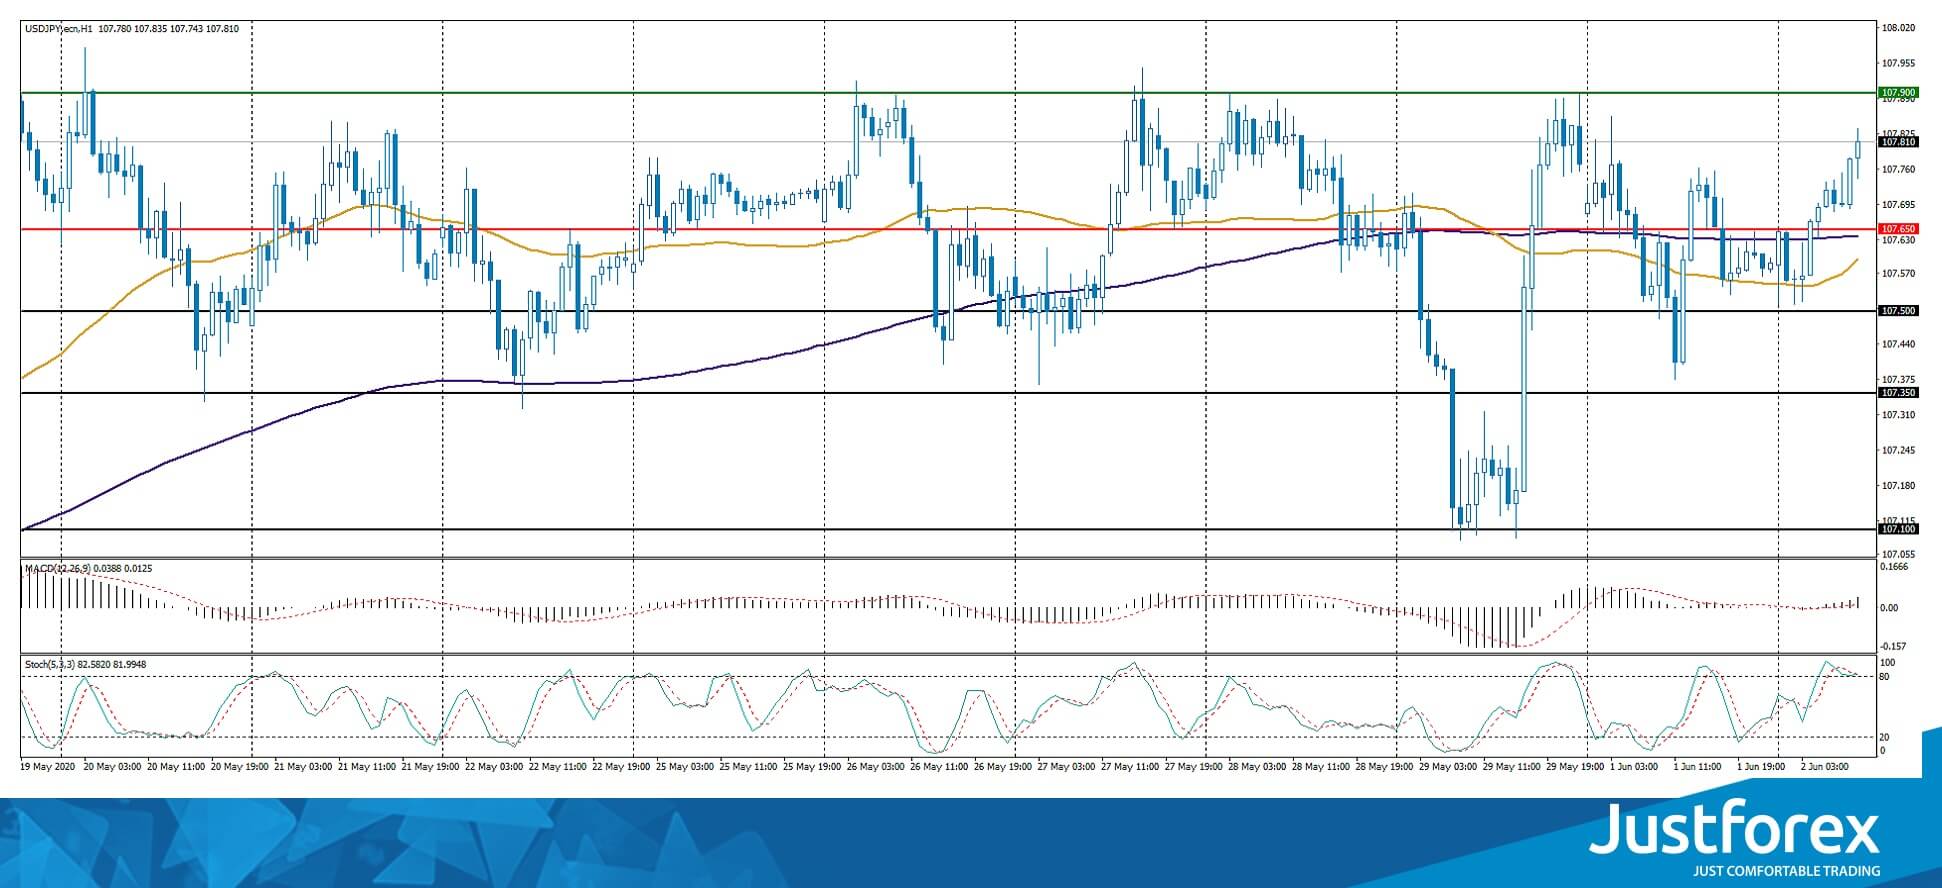
Indicators do not give accurate signals: 50 MA has started crossing 100 MA.
The MACD histogram is in the positive zone, indicating the bullish sentiment.
Stochastic Oscillator is in the overbought zone, the %K line has crossed the %D line. There are no signals at the moment.
Trading recommendations
Support levels: 107.65, 107.50, 107.35
Resistance levels: 107.90, 108.30, 108.60
If the price fixes below 107.65, USD/JPY quotes are expected to fall. The movement is tending to 107.50-107.20.
An alternative could be the growth of the USD/JPY currency pair to 108.20-108.50.


