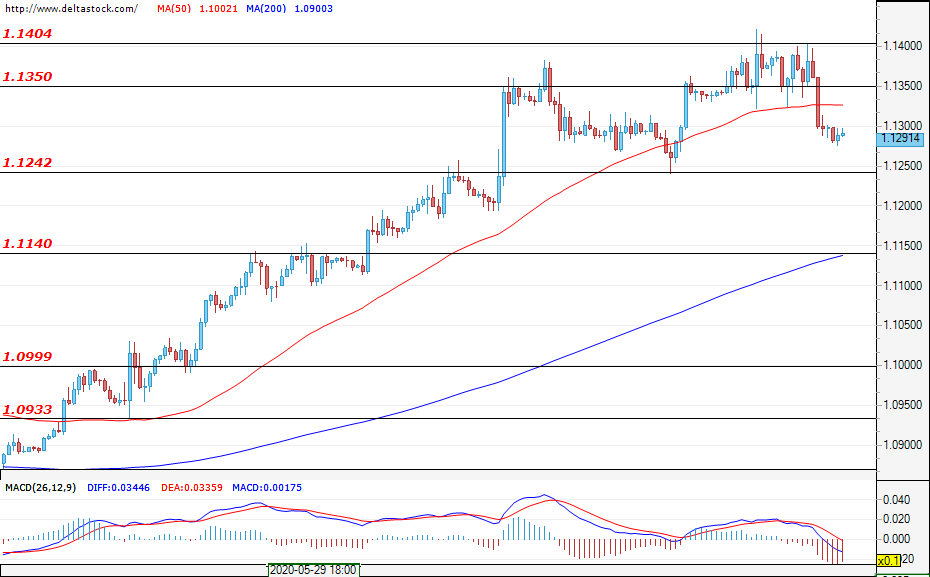
EUR/USD
Current level – 1.1291
For the past week the pair is in a complex pullback and bulls failed to overtake the 1.1400 level after the FED announced its gloomy outlook for the US economy’s recovery. At these levels, a couple of scenarios are possible for the EUR/USD. If the euro is favoured by investors, bulls might look for a better entry at the current levels or between 1.1240 and 1.1200. Buyers will have to be able to take prices higher than 1.1400 and even above 1.1500 in order to keep the uptrend momentum intact. If bulls fail, bears could manage to breach the 1.1240 support zone and try to attack the next one at 1.1140. Expectations are rather neutral at the moment, but if prices test 1.1350 and then get smacked down, that would indicate a bearish rejection of the level and might be a sign for a reversal of the ongoing move. In the last trading day of the week there are no expected significant economic events.
| Resistance | Support | ||
| intraday | intraweek | intraday | intraweek |
| 1.1350 | 1.1500 | 1.1240 | 1.1140 |
| 1.1400 | 1.1570 | 1.1200 | 1.1100 |
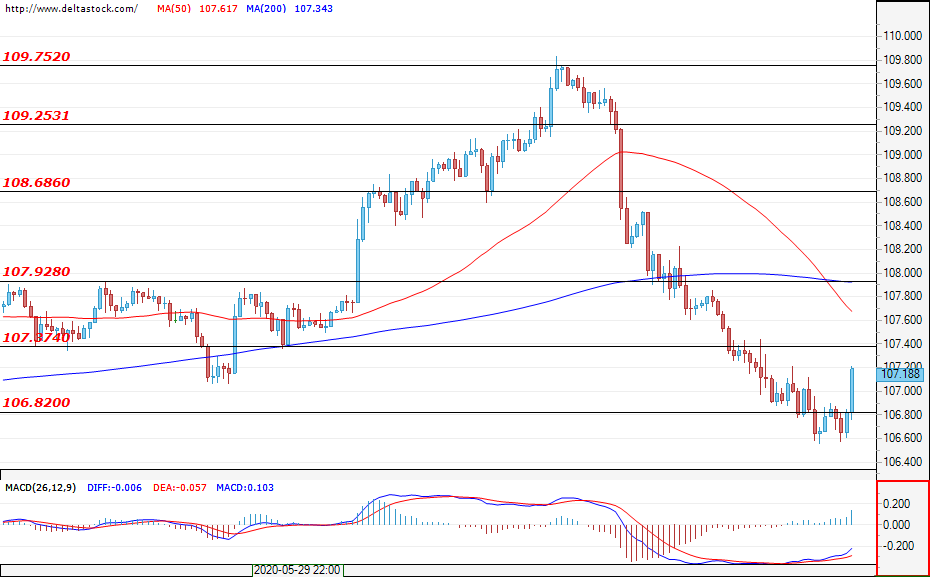
USD/JPY
Current level – 107.18
The safe-haven Japanese yen gained on worries of prolonged economic recovery and a global surge in new COVID-19 infections. The pair easily breached the support zones at 107.37 and 106.80. A retracement towards the 107.37 resistance level is a possibility that, should it happen, could confirm the breach of the zone and enhance the bearish scenario. Next support zones down the line can be found around 106.40 and 106.00. However, if the turmoil observed with riskier assets exacerbates, there could be a significant spike in volatility and USD/JPY could go even lower, towards 105.00 or 103.20. A bullish picture can be expected only if prices hold above the resistance level of 107.90.
| Resistance | Support | ||
| intraday | intraweek | intraday | intraweek |
| 107.40 | 108.70 | 106.80 | 106.00 |
| 107.90 | 109.75 | 106.00 | 105.00 |
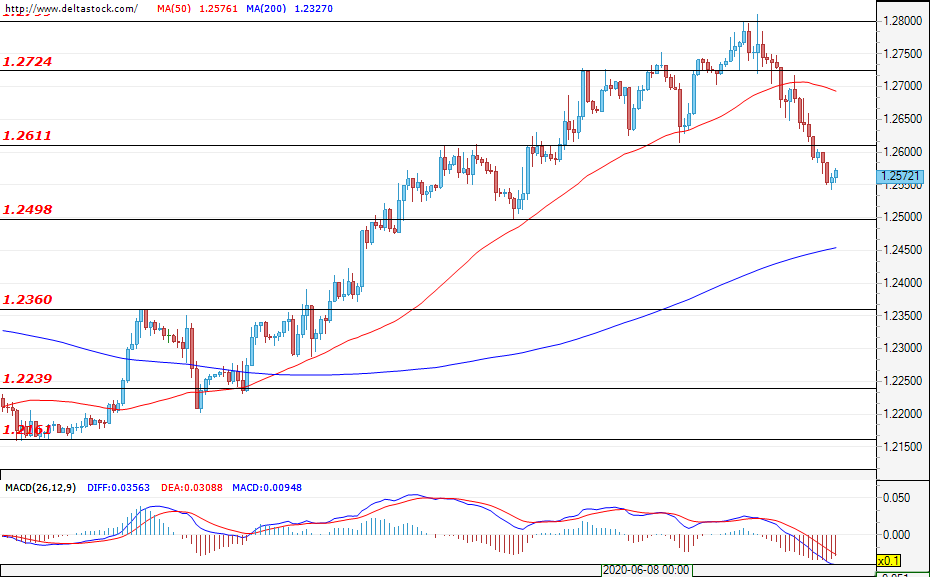
GBP/USD
Current level – 1.2572
Here, the uptrend is quickly losing momentum as bears are entering the market. The pair managed to breach the support at 1.2610 and now prices are headed towards the next support zone at 1.2500. The fact that 1.2610 couldn’t resist the bearish pressure might be a red flag for a potential trend reversal. There could be a pullback towards 1.2600-1.2630 that could slow down the sell-off, but as we saw in March, sell-offs can be swift and violent and prices could easily go as low as 1.2360 and 1.2240. The support at 1.2500 is coming from the higher time frames and whether it holds or is violated, would be of key importance for the near-term development of the market. Today we expect a series of news about industrial production, manufacturing and GDP coming from the UK at 06:00 GMT that could spark market activity.
| Resistance | Support | ||
| intraday | intraweek | intraday | intraweek |
| 1.2610 | 1.2800 | 1.2500 | 1.2240 |
| 1.2725 | 1.2880 | 1.2360 | 1.2160 |