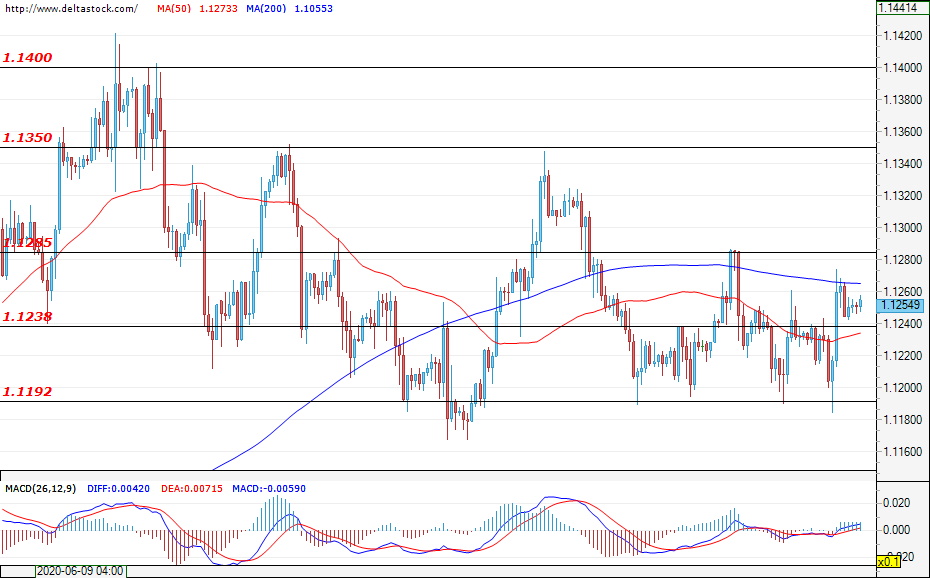
EUR/USD
Current level – 1.1254
The currency pair continues to trade in the narrow range 1.1190 – 1.1285, as neither the bulls, nor the bears manage to prevail. Today, the market participants will mainly monitor the data on the nonfarm payrolls change in the United States, the data on the unemployment rate in the US and the data for the Initial jobless claims in the US (12:30 GMT). The forecasts are for high volatility, as a break of any of the boundaries of the mentioned channel could determine a clearer direction for the currency pair. In the event of a break in the upward direction, it is possible for the EUR/USD to reach and test the next important resistance at 1.1350.
| Resistance | Support | ||
| intraday | intraweek | intraday | intraweek |
| 1.1285 | 1.1400 | 1.1238 | 1.1140 |
| 1.1350 | 1.1500 | 1.1192 | 1.0980 |
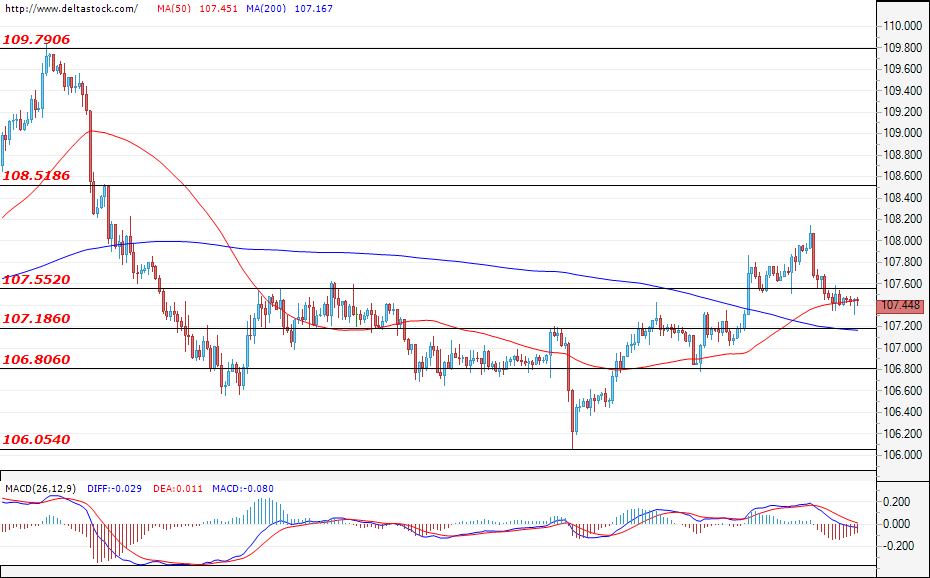
USD/JPY
Current level – 107.44
The break of the 107.55 resistance level from the beginning of the week was fleeting, as the dollar started to lose positions against the yen once again. The sentiment is rather negative – for reaching and testing the support zone at 106.80. An unsuccessful test at the mentioned level could lead to a range-bound movement in the narrow channel of 106.80 – 107.55 once again.
| Resistance | Support | ||
| intraday | intraweek | intraday | intraweek |
| 107.55 | 108.50 | 107.20 | 106.00 |
| 108.00 | 109.25 | 106.80 | 105.00 |
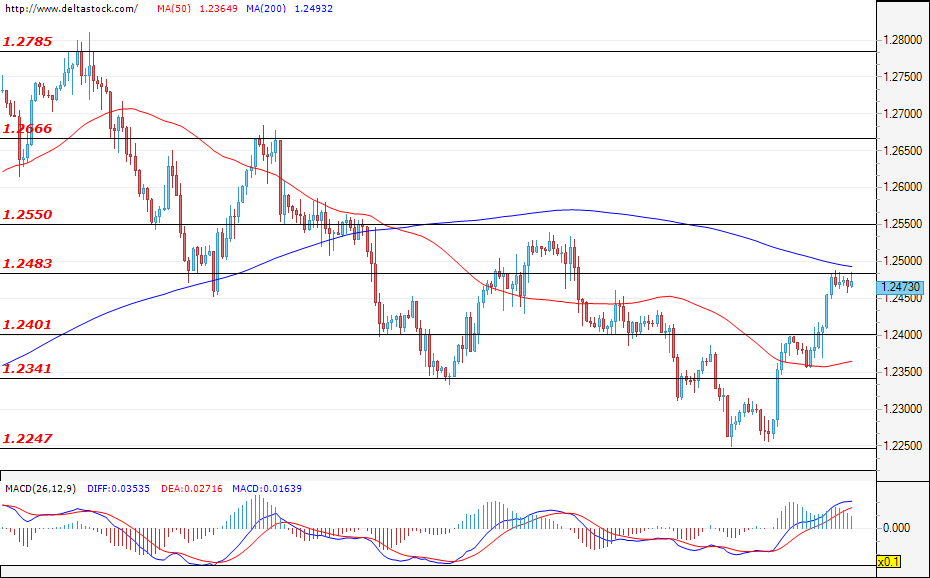
GBP/USD
Current level – 1.2473
The movement of the currency pair is located just before a test of the resistance zone at 1.2480. The positive sentiments during the past few days have gained momentum, as a successful break of the mentioned level would push the price to the test of the next significant resistance at 1.2550.
| Resistance | Support | ||
| intraday | intraweek | intraday | intraweek |
| 1.2480 | 1.2665 | 1.2400 | 1.2250 |
| 1.2550 | 1.2665 | 1.2340 | 1.2160 |