
The EUR/USD currency pair
Technical indicators of the currency pair:
Prev Open: 1.18134
Open: 1.18381
% chg. over the last day: +0.25
Day’s range: 1.18292 – 1.18680
52 wk range: 1.0777 – 1.1781
The greenback has been declining again relative to a basket of world currencies. American currency is still under pressure due to uncertainty concerning the adoption of a new package of measures to support the US economy. Financial market participants expect the FOMC minutes, which will be published later this week. At the moment, EUR/USD quotes are consolidating in the range of 1.1825-1.1865. The trading instrument has the potential for further growth. Positions should be opened from key levels.
Today, the news feed is quite calm.
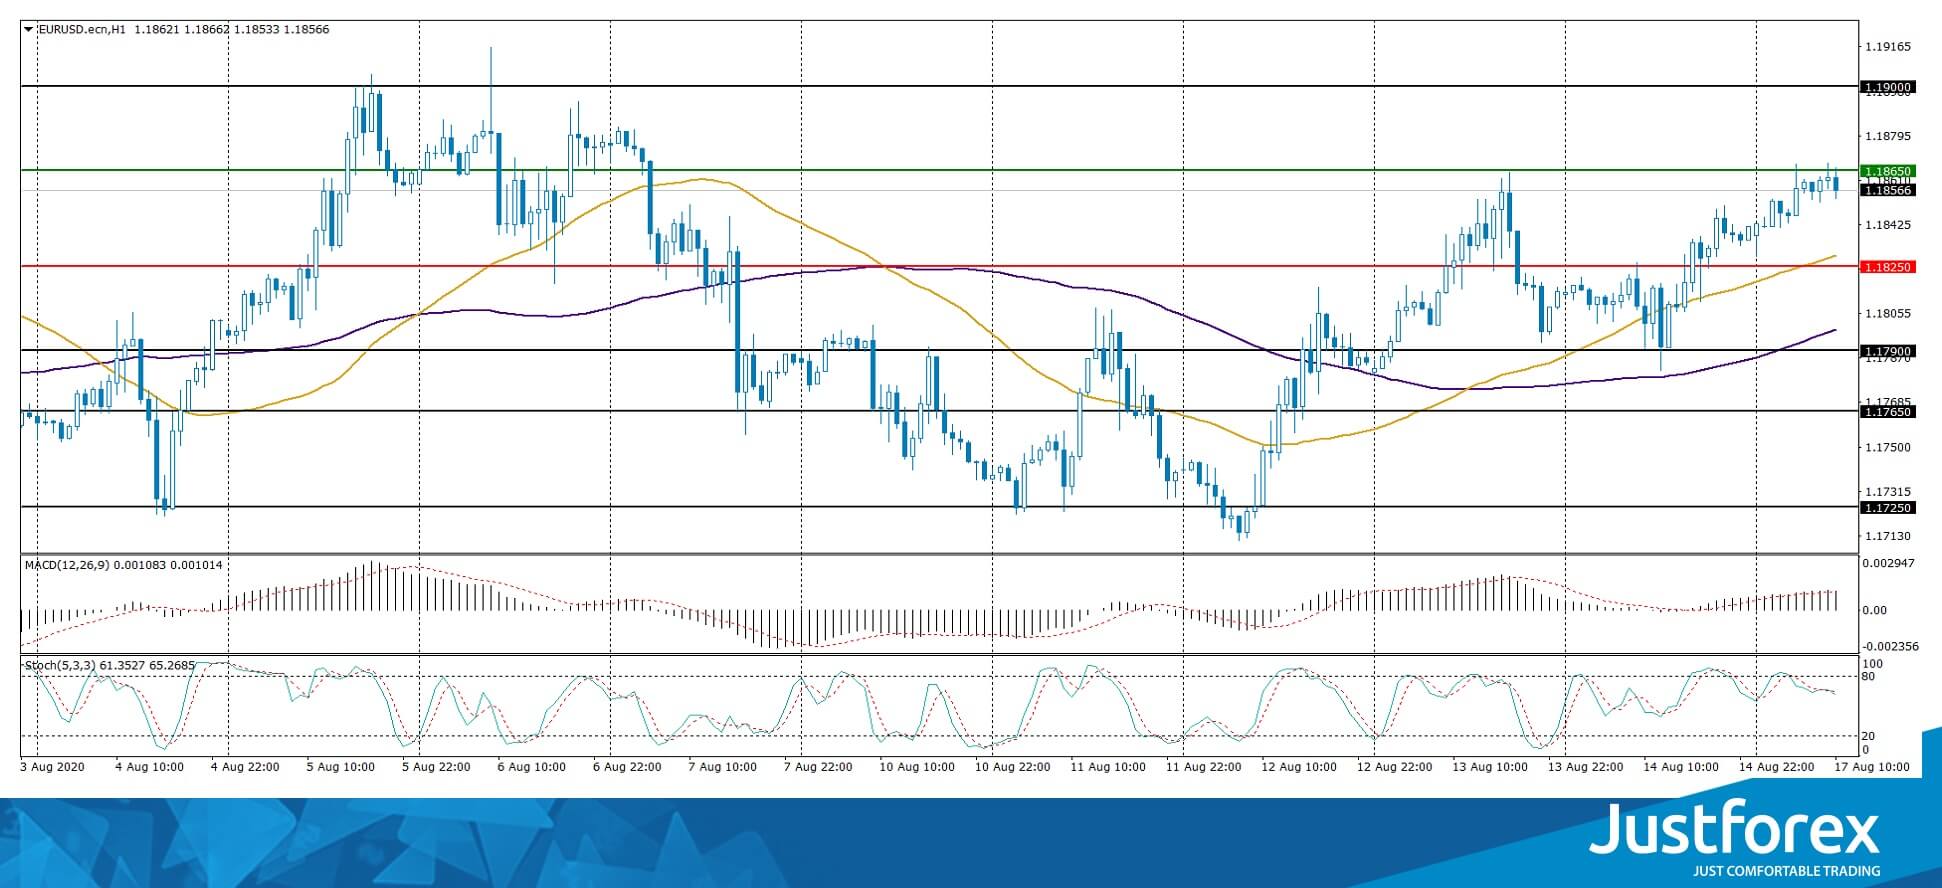
Indicators signal the power of buyers: the price has fixed above 50 MA and 100 MA.
The MACD histogram is in the positive zone, which indicates the bullish sentiment.
Stochastic Oscillator is in the neutral zone, the %K line has crossed the %D line. There are no signals at the moment.
Trading recommendations
Support levels: 1.1825, 1.1790, 1.1765
Resistance levels: 1.1865, 1.1900
If the price fixes above 1.1865, further growth of EUR/USD quotes is expected. The movement is tending to 1.1900-1.1920.
An alternative could be a decline in the EUR/USD currency pair to 1.1790-1.1770.
The GBP/USD currency pair
Technical indicators of the currency pair:
Prev Open: 1.30513
Open: 1.30910
% chg. over the last day: +0.16
Day’s range: 1.30843 – 1.31218
52 wk range: 1.1466 – 1.3516
The British pound is still being traded in a flat. There is no defined trend. Financial market participants expect additional drivers. At the moment, the local support and resistance levels are 1.3080 and 1.3120, respectively. GBP/USD quotes are tending to grow. Positions should be opened from key levels.
The publication of important UK economic reports is not planned.
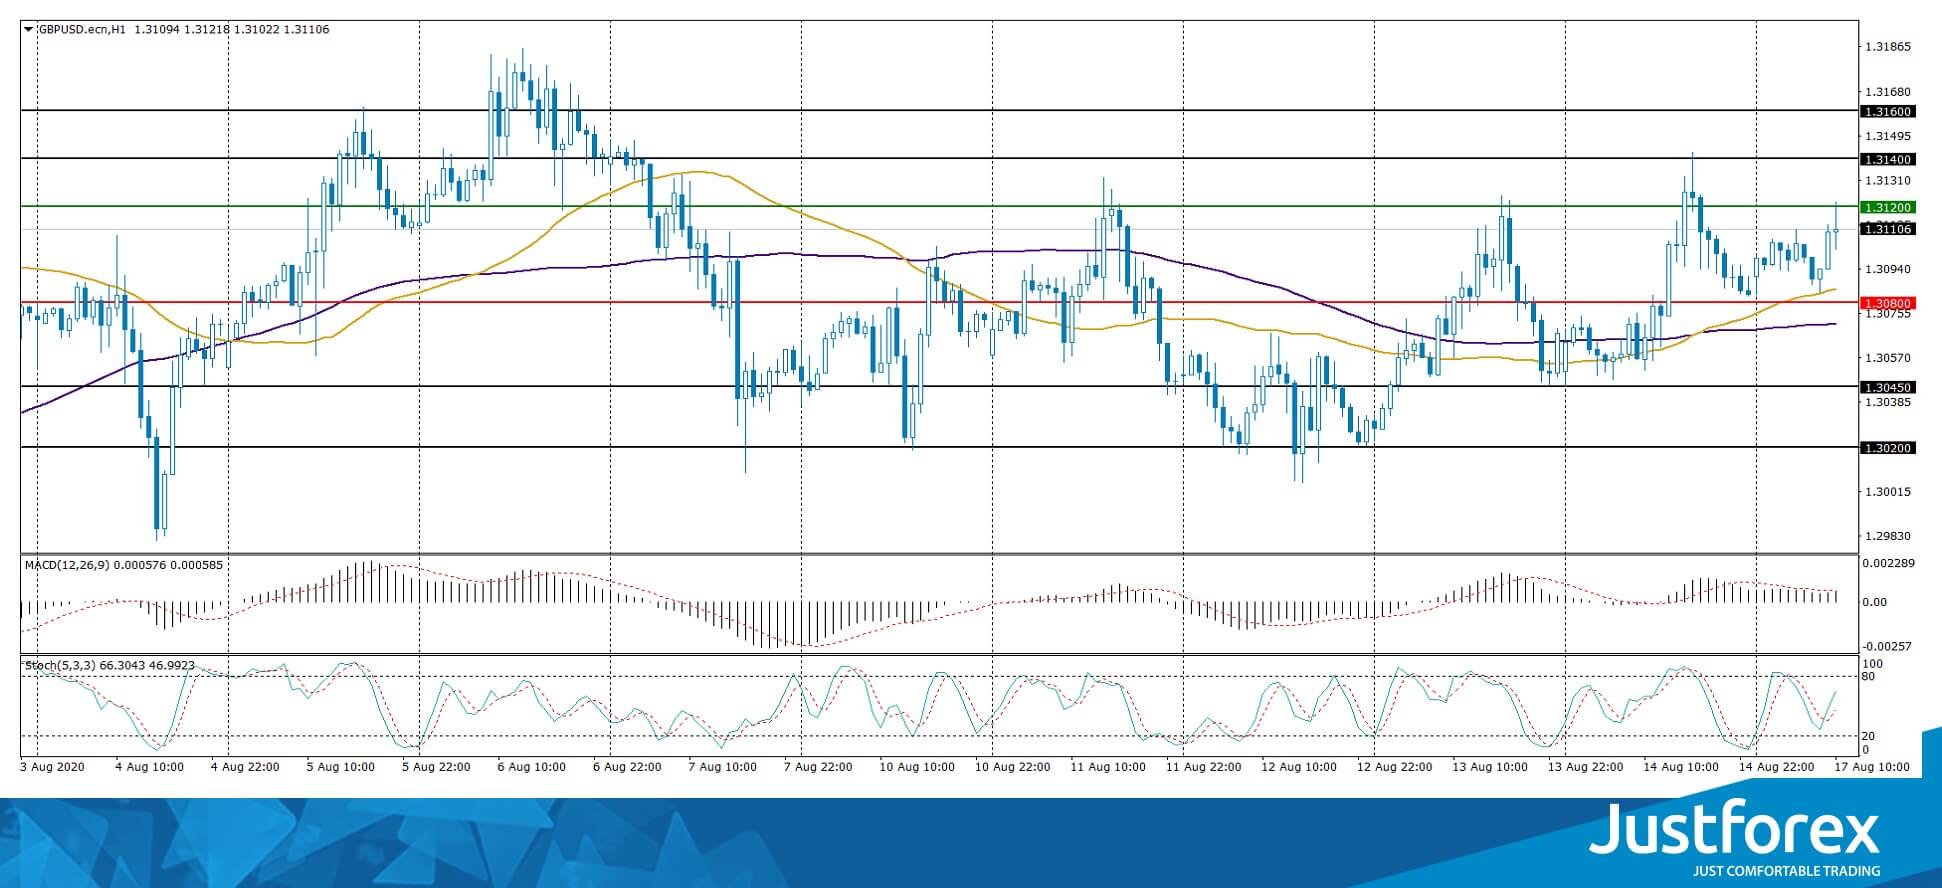
Indicators point to the power of buyers: the price has fixed above 50 MA and 100 MA.
The MACD histogram is in the positive zone, which indicates the bullish sentiment.
Stochastic Oscillator is in the neutral zone, the %K line is above the %D line, which gives a signal to buy GBP/USD.
Trading recommendations
Support levels: 1.3080, 1.3045, 1.3020
Resistance levels: 1.3120, 1.3140, 1.3160
If the price fixes above 1.3120, GBP/USD quotes are expected to grow. The movement is tending to 1.3150-1.3180.
An alternative could be a decline in the GBP/USD currency pair to 1.3050-1.3030.
The USD/CAD currency pair
Technical indicators of the currency pair:
Prev Open: 1.32139
Open: 1.32438
% chg. over the last day: +0.35
Day’s range: 1.32287 – 1.32627
52 wk range: 1.2949 – 1.4668
The USD/CAD currency pair is in a sideways trend. There is no defined trend. At the moment, the local support and resistance levels are 1.3230 and 1.3270, respectively. USD/CAD quotes are tending to decline. We recommend paying attention to the dynamics of the “black gold” prices. Positions should be opened from key levels.
The news feed on Canada’s economy is calm.
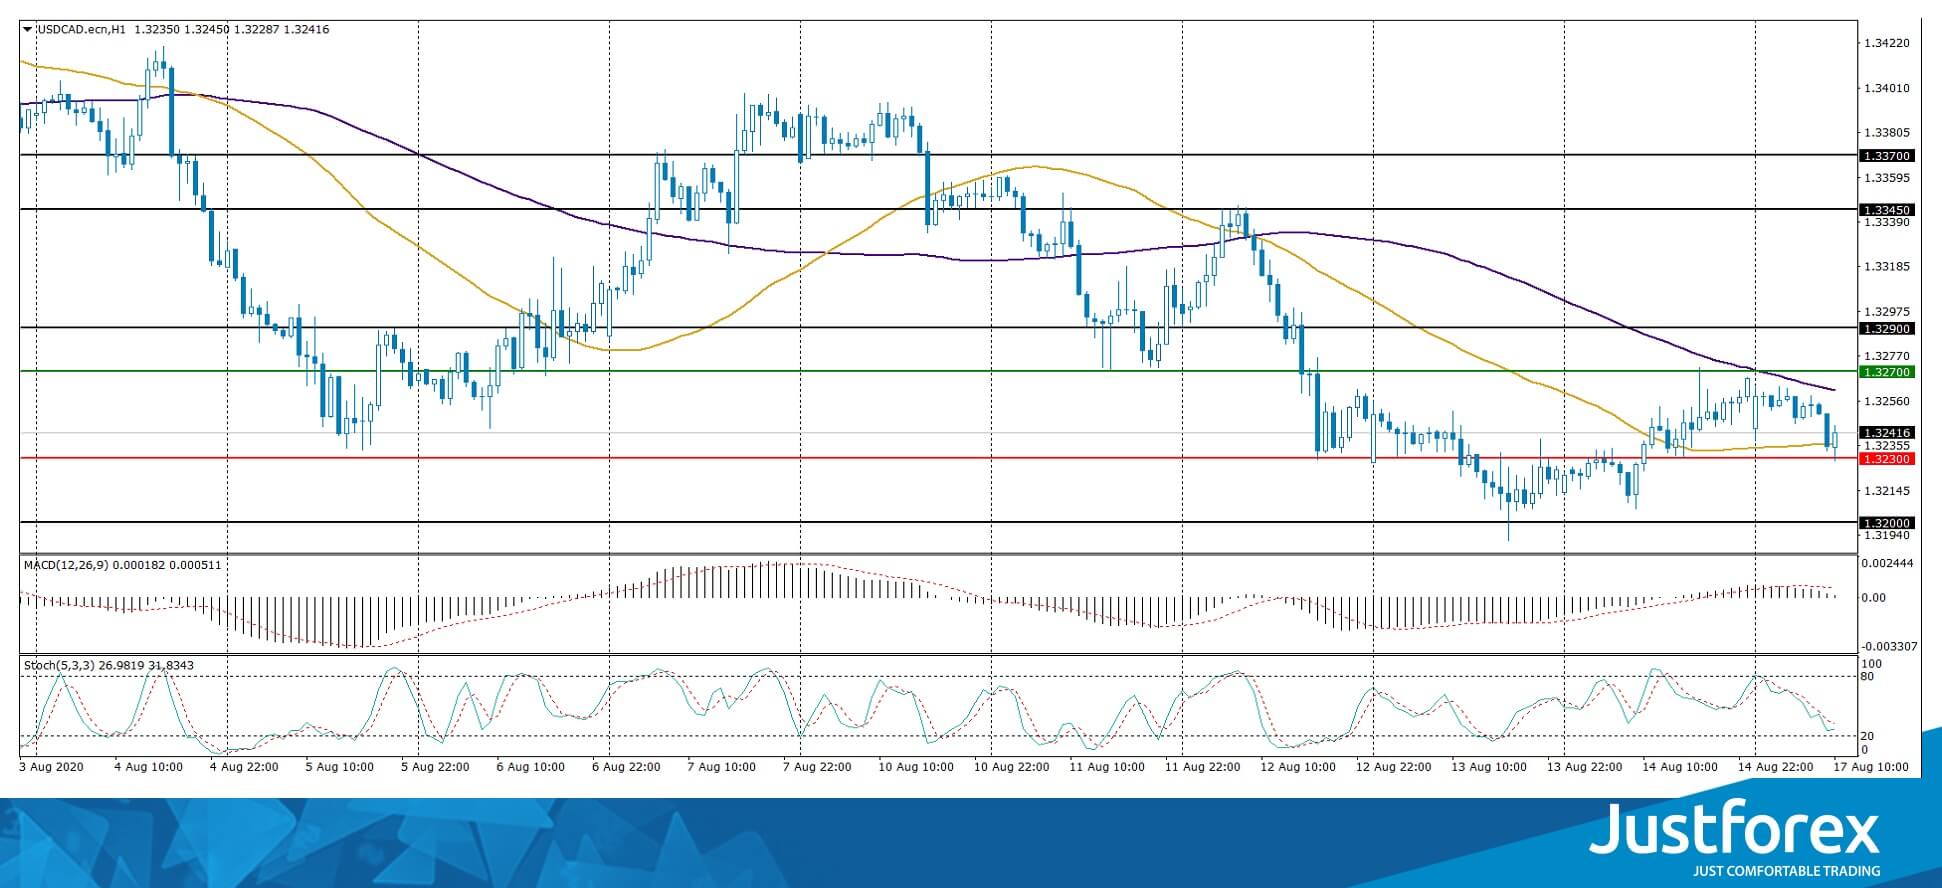
Indicators do not give accurate signals: the price has crossed the 50 MA and 100 MA.
The MACD histogram is near the 0 mark.
Stochastic Oscillator is in the neutral zone, the %K line is below the %D line, which indicates the bearish sentiment.
Trading recommendations
Support levels: 1.3230, 1.3200, 1.3170
Resistance levels: 1.3270, 1.3290, 1.3345
If the price fixes below 1.3230, USD/CAD sales should be considered. The movement is tending to 1.3200-1.3180.
An alternative could be the growth of the USD/CAD currency pair to 1.3300-1.3330.
The USD/JPY currency pair
Technical indicators of the currency pair:
Prev Open: 106.847
Open: 106.564
% chg. over the last day: -0.31
Day’s range: 106.401 – 106.653
52 wk range: 101.19 – 112.41
USD/JPY quotes continue to consolidate. The technical pattern is ambiguous. At the moment, the trading instrument is testing local support and resistance levels: 106.40 and 106.65, respectively. The USD/JPY currency pair is tending to correct. We recommend paying attention to the dynamics of US government bonds yield. Positions should be opened from key levels.
Japan has published weak data on the country’s GDP.
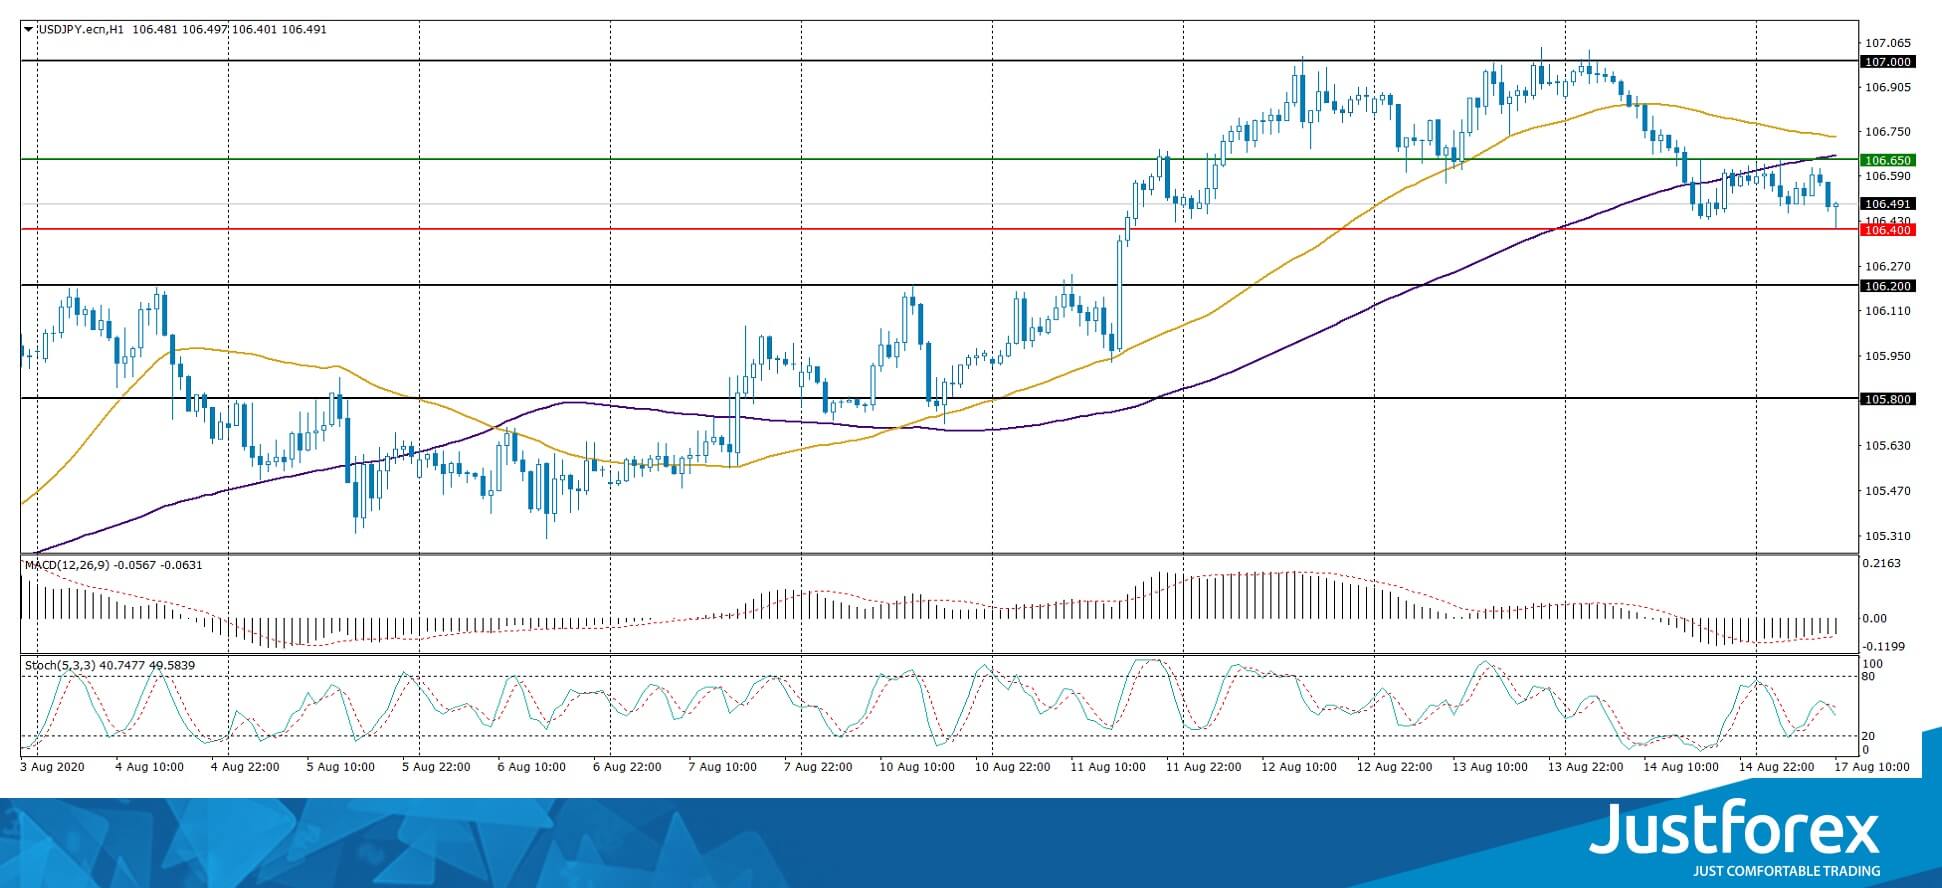
Indicators do not give accurate signals: the price has crossed the 100 MA.
The MACD histogram is in the negative zone, which indicates the bearish sentiment.
Stochastic Oscillator is in the neutral zone, the %K line crossed the %D line. There are no signals at the moment.
Trading recommendations
Support levels: 106.40, 106.20, 105.80
Resistance levels: 106.65, 107.00, 107.50
If the price fixes above 106.65, further growth of USD/JPY quotes is expected. The movement is tending to 107.00-107.20.
An alternative could be a decline in the USD/JPY currency pair to 106.00-105.80.


