
The EUR/USD currency pair
Technical indicators of the currency pair:
Prev Open: 1.16696
Open: 1.16265
% chg. over the last day: -0.36
Day’s range: 1.16150 – 1.16402
52 wk range: 1.0637 – 1.2012
The bearish sentiment still prevails on the EUR/USD currency pair. The trading instrument has set new local lows again. At the moment, EUR/USD quotes are consolidating in the range of 1.1615-1.1655. Financial market participants have taken a wait-and-see attitude before the first debate between President Donald Trump and Democratic candidate Joe Biden. We recommend opening positions from key levels.
The publication of important economic releases is not planned today. We recommend paying attention to the speech by the ECB President.
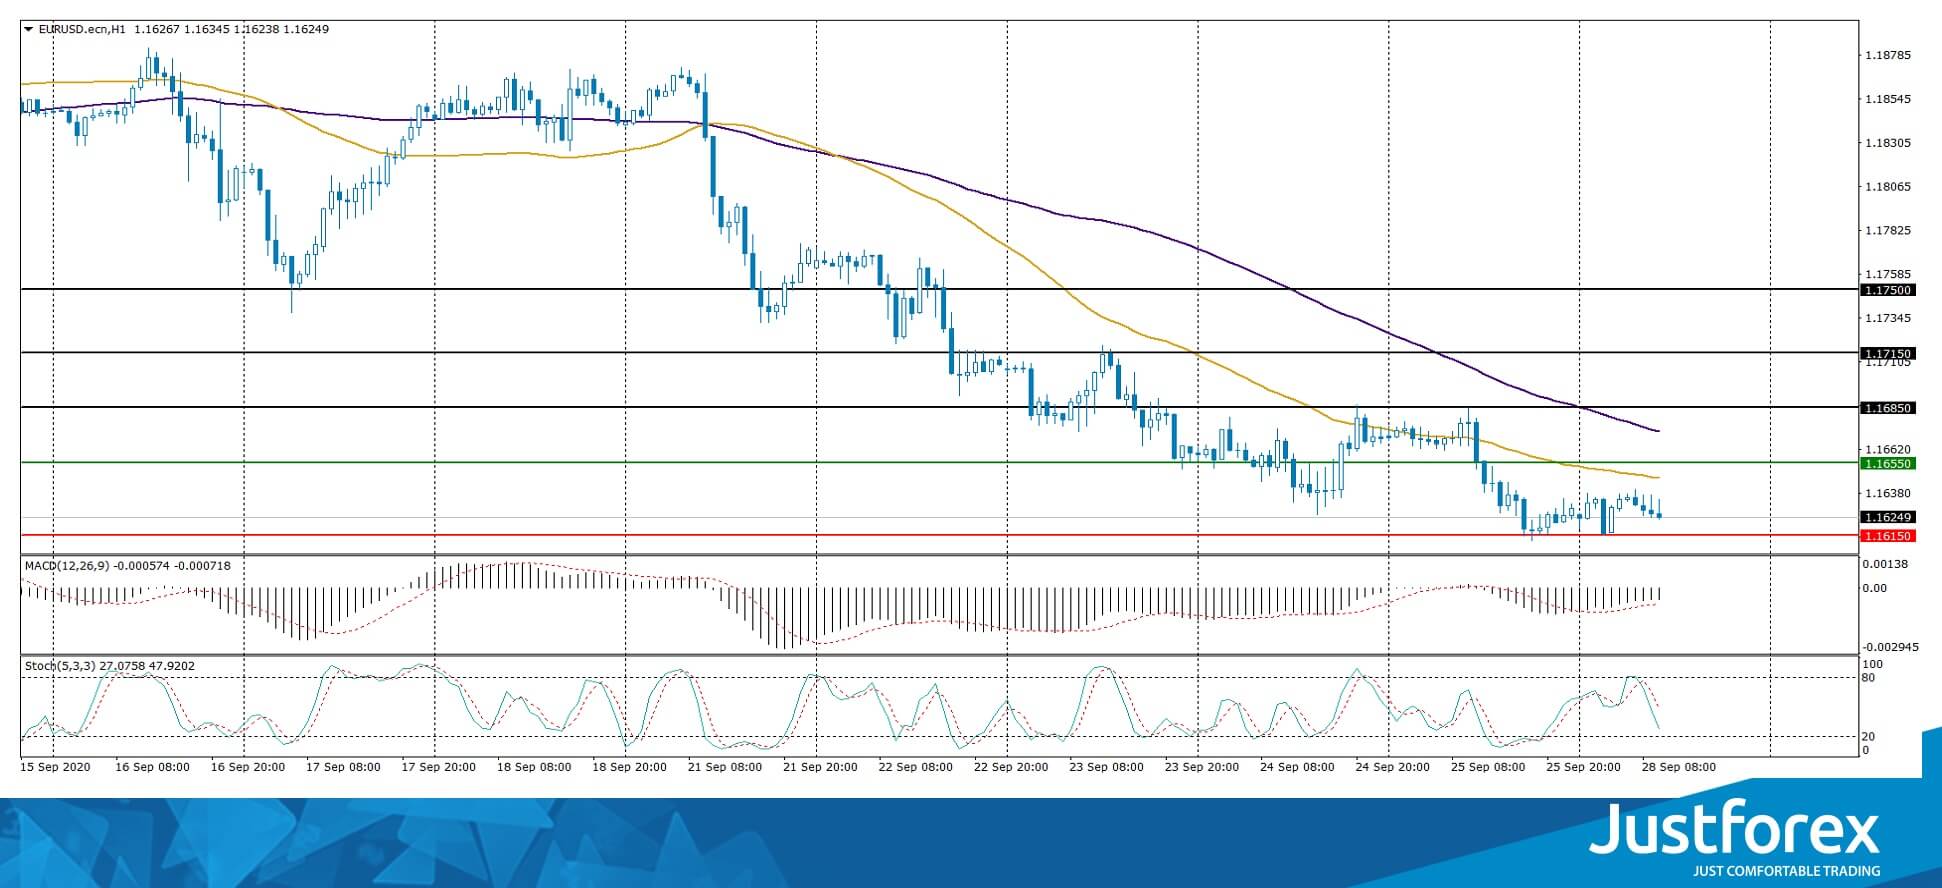
Indicators signal the power of sellers: the price has fixed below 50 MA and 100 MA.
The MACD histogram is in the negative zone, but above the signal line, which gives a weak signal to sell EUR/USD.
Stochastic Oscillator is in the neutral zone, the %K line is below the %D line, which also indicates the bearish sentiment.
Trading recommendations
Support levels: 1.1615, 1.1600
Resistance levels: 1.1655, 1.1685, 1.1715
If the price fixes below 1.1615, a further drop in EUR/USD quotes is expected. The movement is tending to 1.1590-1.1570.
An alternative could be the growth of the EUR/USD currency pair to 1.1680-1.1720.
The GBP/USD currency pair
Technical indicators of the currency pair:
Prev Open: 1.27411
Open: 1.27618
% chg. over the last day: +0.15
Day’s range: 1.27504 – 1.28014
52 wk range: 1.1409 – 1.3516
The GBP/USD currency pair is in flat. There is no defined trend. Investors expect additional drivers. At the moment, the local support and resistance levels are 1.2750 and 1.2810, respectively. The debate between President Donald Trump and Democratic candidate Joe Biden is in the spotlight. Positions should be opened from key levels.
The publication of important UK economic reports is not planned.
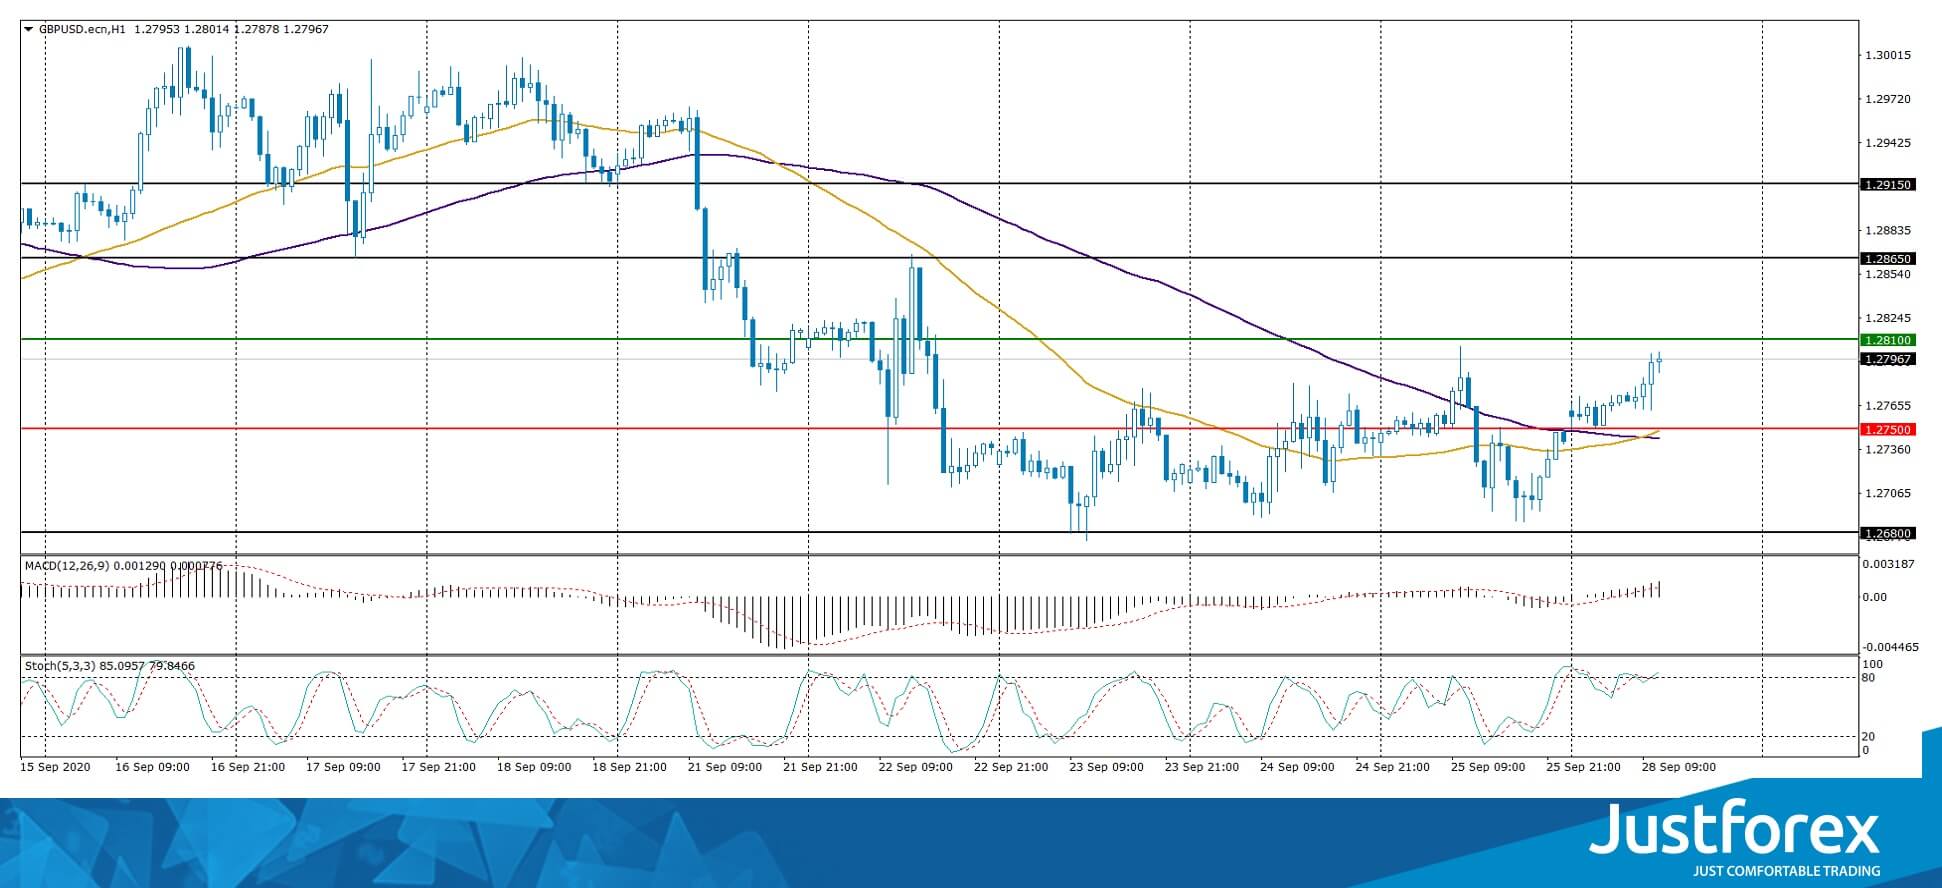
Indicators do not give accurate signals: 50 MA has crossed 100 MA.
The MACD histogram has started growing, which indicates the development of bullish sentiment.
Stochastic Oscillator is near the overbought zone, the %K line has crossed the %D line. There are no signals at the moment.
Trading recommendations
Support levels: 1.2750, 1.2680, 1.2600
Resistance levels: 1.2810, 1.2865, 1.2915
If the price fixes above 1.2810, the GBP/USD currency pair is expected to grow. The movement is tending to 1.2850-1.2880.
An alternative could be a drop in GBP/USD quotes to 1.2720-1.2670.
The USD/CAD currency pair
Technical indicators of the currency pair:
Prev Open: 1.33557
Open: 1.33820
% chg. over the last day: +0.16
Day’s range: 1.33742 – 1.34034
52 wk range: 1.2949 – 1.4669
USD/CAD quotes have become stable after a prolonged rally. At the moment, the loonie is consolidating. Local support and resistance levels are 1.3370 and 1.3415, respectively. In the near future, a technical correction of the trading instrument is possible. We recommend paying attention to the dynamics of “black gold” prices. Positions should be opened from key levels.
The news feed on Canada’s economy is calm.
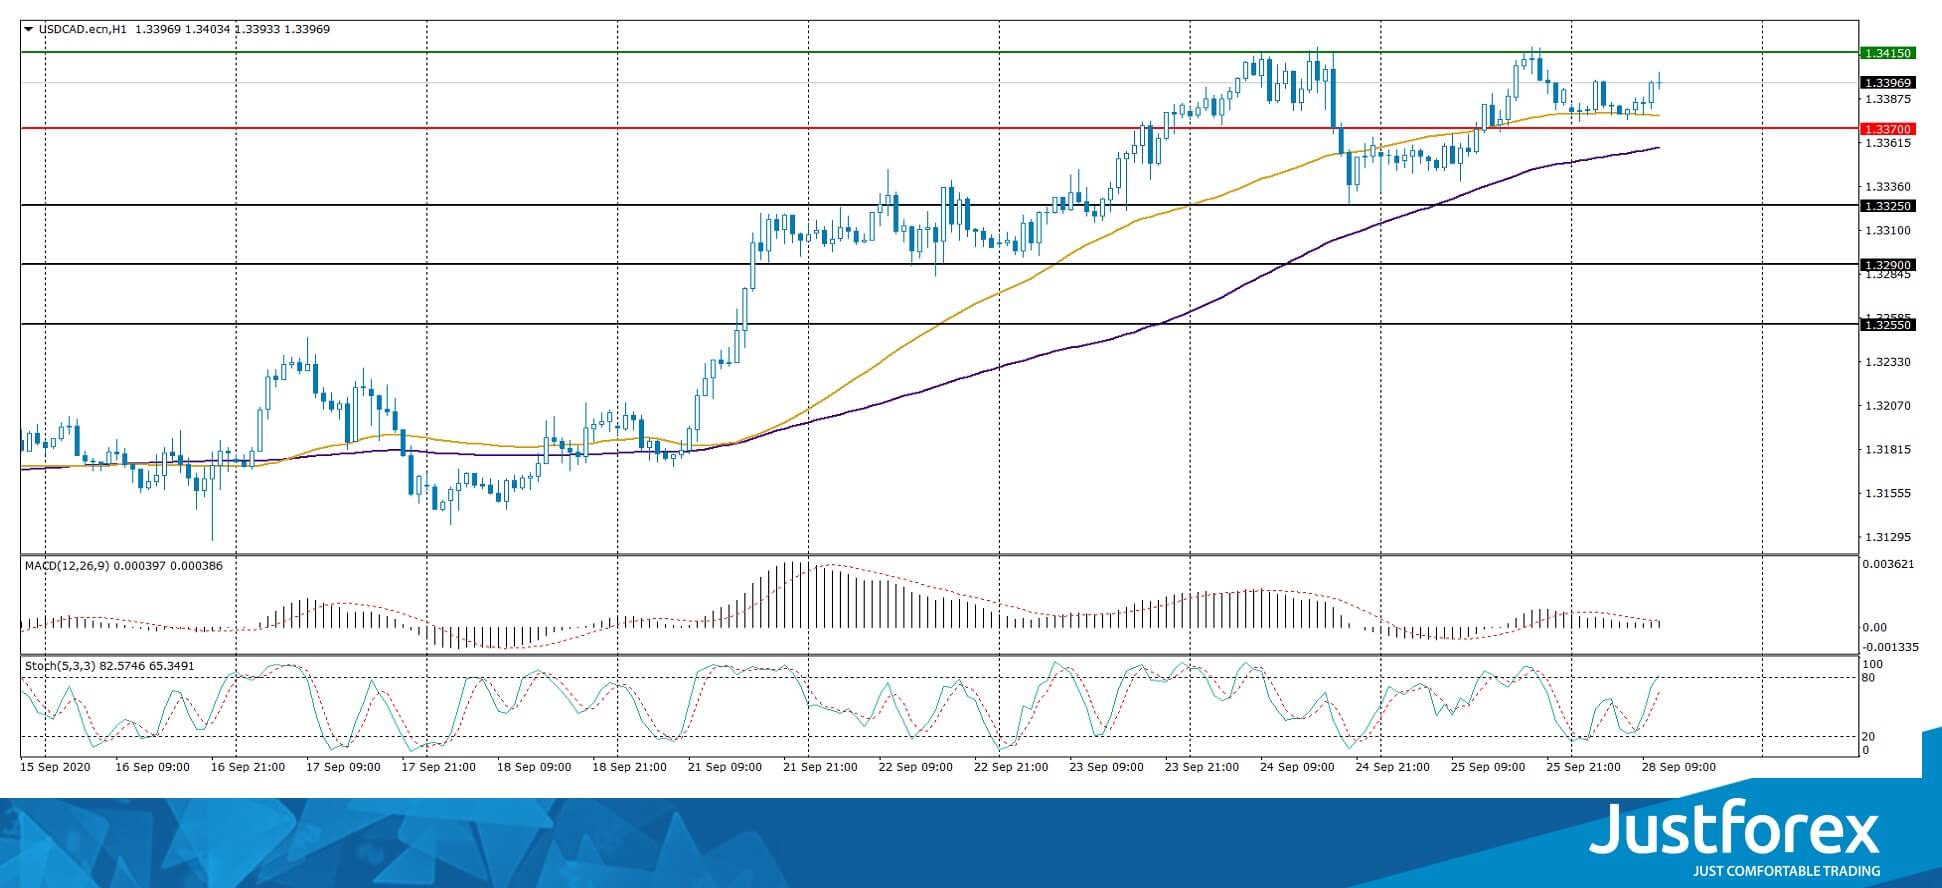
Indicators do not give accurate signals: the price is testing 50 MA.
The MACD histogram is in the positive zone, which indicates the bullish sentiment.
Stochastic Oscillator is in the neutral zone, the %K line is above the %D line, which gives a signal to buy USD/CAD.
Trading recommendations
Support levels: 1.3370, 1.3325, 1.3290
Resistance levels: 1.3415, 1.3500
If the price fixes above 1.3415, further growth in USD/CAD quotes is expected. The movement is tending to 1.3450-1.3470.
An alternative could be a decline in the USD/CAD currency pair to 1.3330-1.3300.
The USD/JPY currency pair
Technical indicators of the currency pair:
Prev Open: 105.391
Open: 105.480
% chg. over the last day: +0.19
Day’s range: 105.264 – 105.690
52 wk range: 101.19 – 112.41
The USD/JPY currency pair is still being traded in flat. The technical pattern is ambiguous. Investors expect additional drivers. At the moment, the local support and resistance levels are 105.20 and 105.50, respectively. We recommend paying attention to the dynamics of US government bonds yield. Positions should be opened from key levels.
The news feed on Japan’s economy is calm.
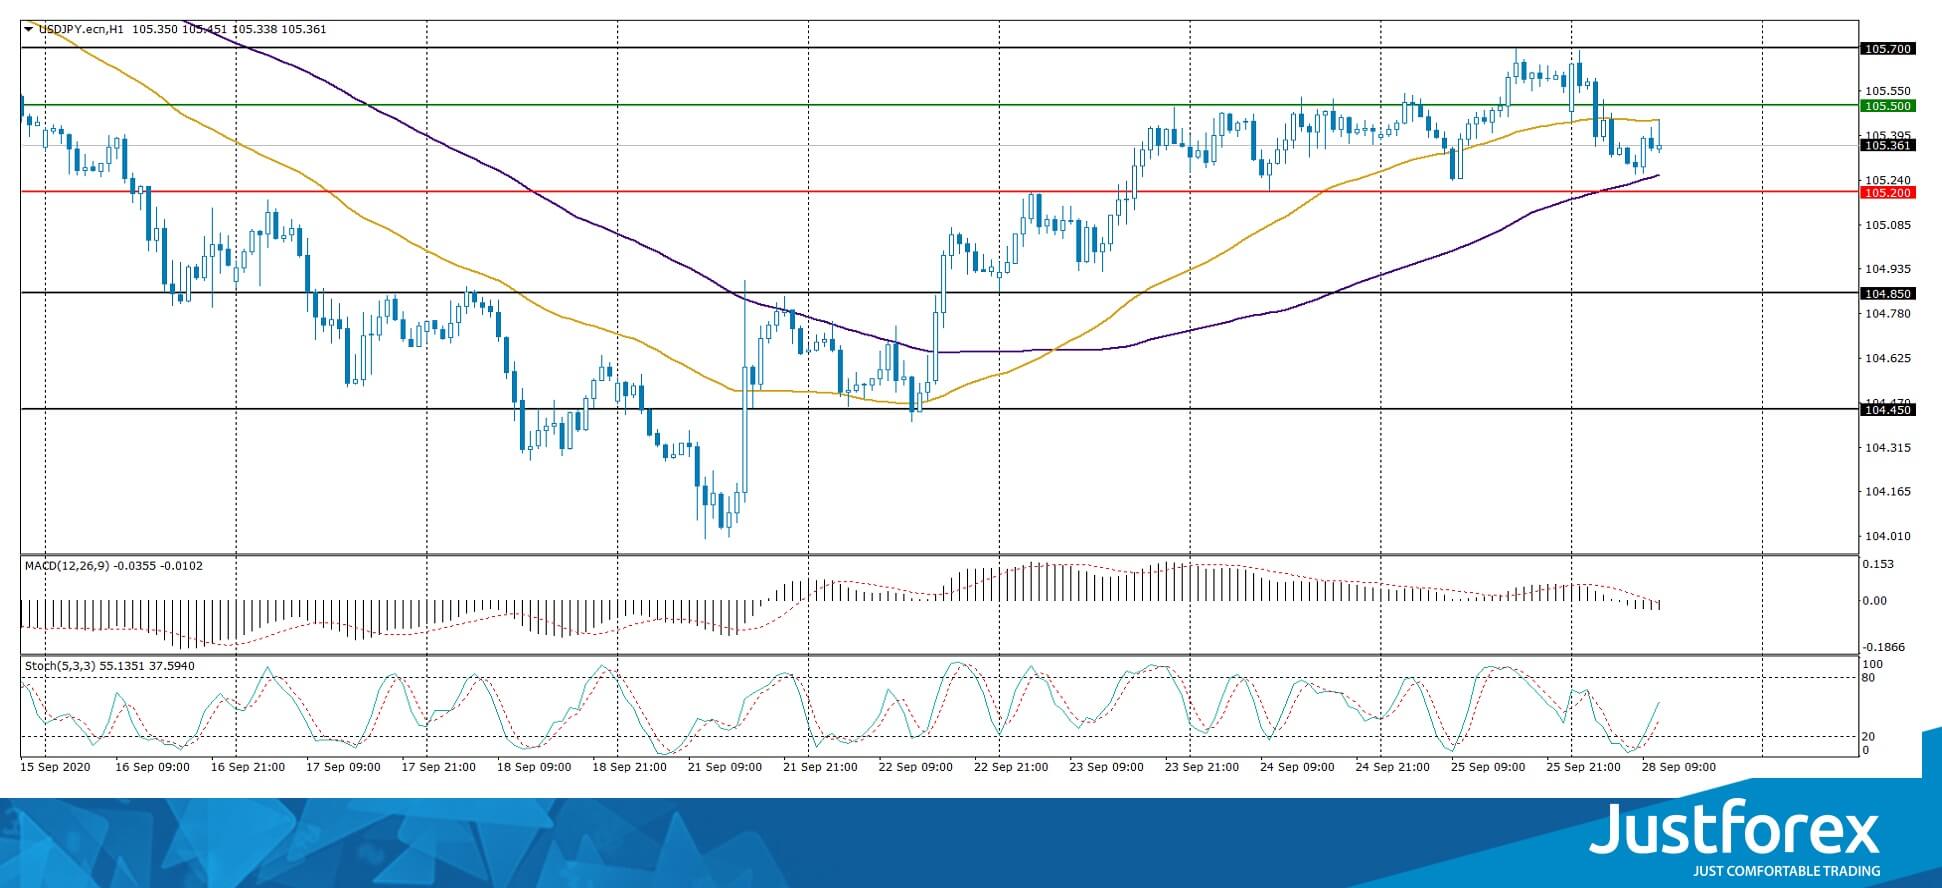
Indicators do not give accurate signals: the price has fixed between 50 MA and 100 MA.
The MACD histogram has started declining, which indicates the bearish sentiment.
Stochastic Oscillator is in the neutral zone, the %K line is above the %D line, which gives a signal to buy USD/JPY.
Trading recommendations
Support levels: 105.20, 104.85, 104.45
Resistance levels: 105.50, 105.70, 106.00
If the price fixes above 105.50, further growth in USD/JPY quotes is expected. The movement is tending to the round level of 106.00.
An alternative could be a decline in the USD/JPY currency pair to 104.90-104.70.


