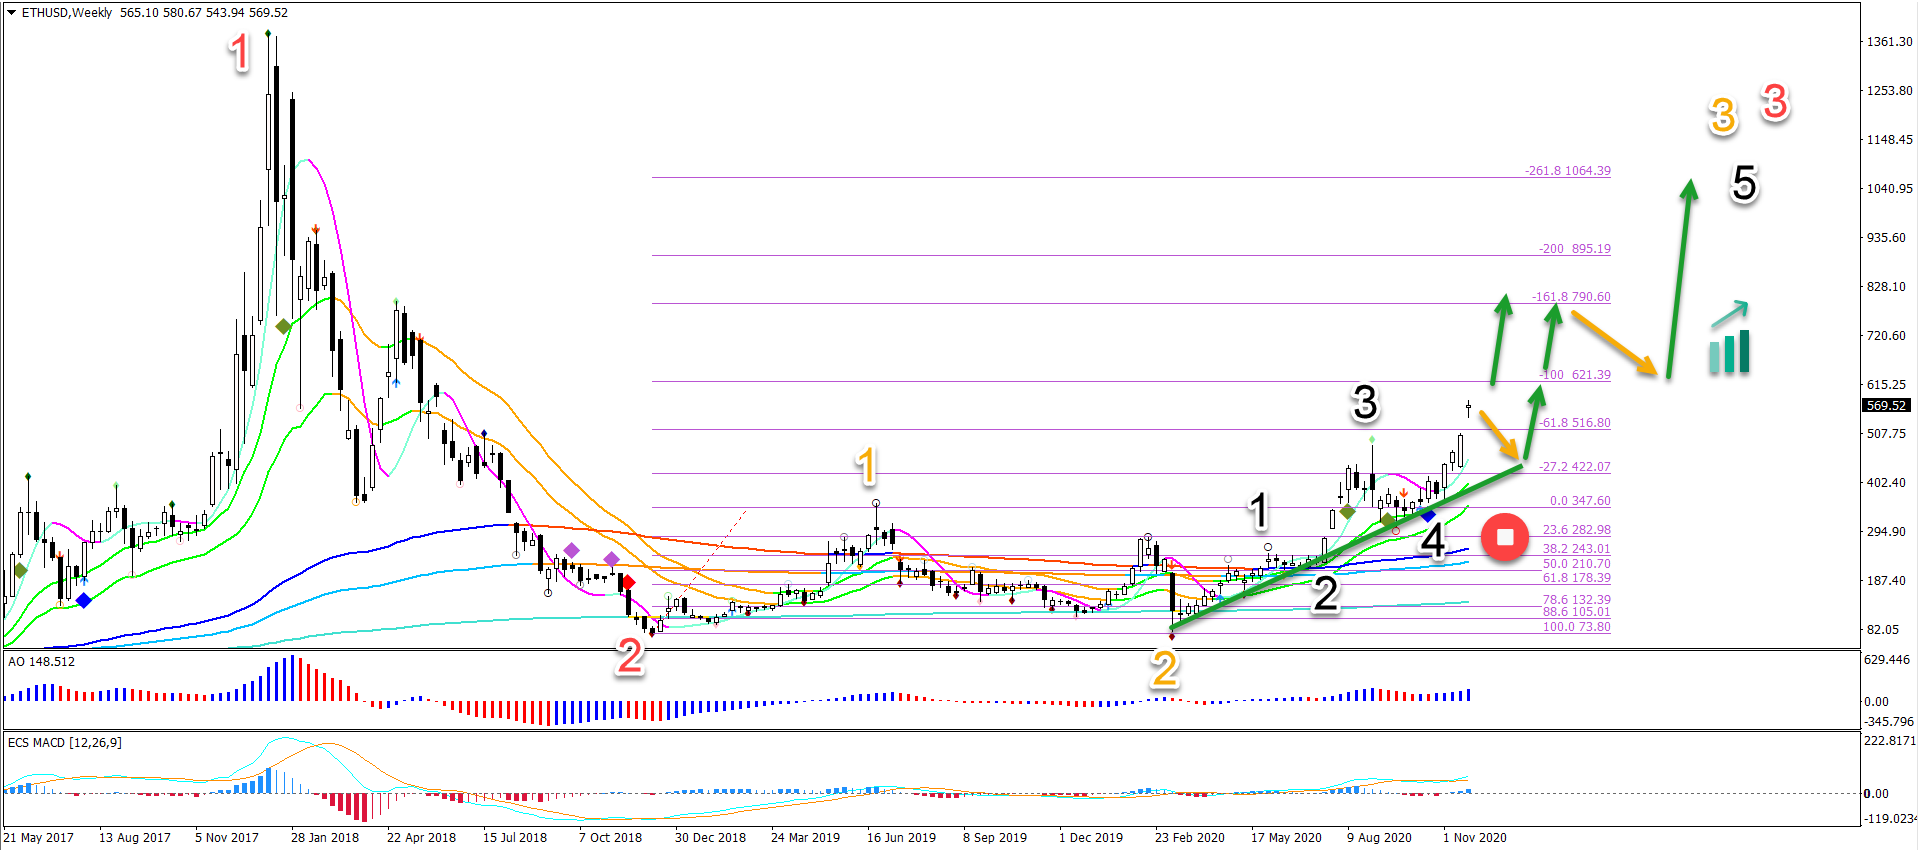
Ethereum (ETH/USD) is finally making a bullish breakout. The previous bullish swing was 3 years ago when price action went above $1,300.
The pullback and correction was strong and lengthy. Can the ETH/USD bulls really wrestle back full control from the bears?
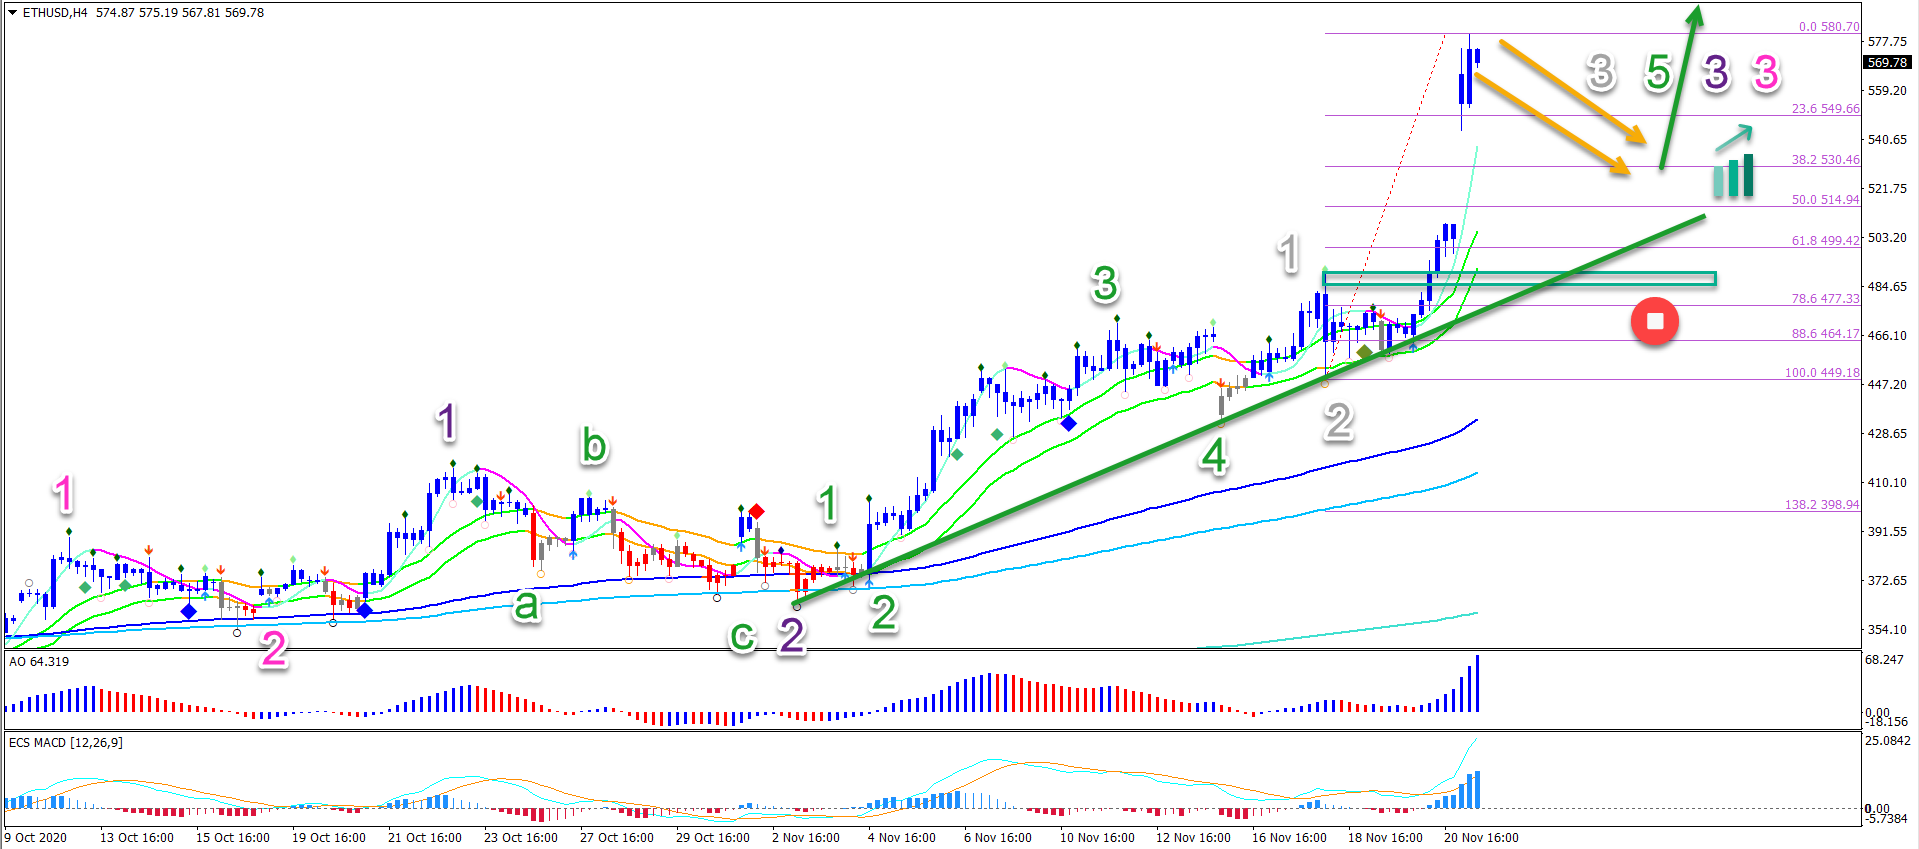
The ETH/USD continued higher over the weekend crossing the round $500 mark. The new high is also breaking above the -61.8% Fibonacci target.
Price Charts and Technical Analysis
The ETH/USD continued higher over the weekend crossing the round $500 mark. The new high is also breaking above the -61.8% Fibonacci target. This is a typical target for a wave C so a break indicates that a wave 3 is becoming more likely.
The next confirmation of a wave 3 occurs if price action is able to break above the -100% Fibonacci target. A bull flag could develop as well (orange arrows) but eventually a breakout is expected (green arrows).
On the 4 hour chart, the bullish momentum remains strong. Price action seems to be in a wave 3 (grey). Once this wave 3 is completed, we are expecting a wave 4 correction. Usually wave 4s are long and choppy (orange arrows) like a bull flag continuation chart pattern.
A break below the top of wave 1 (green box) invalidates (red circle) the 5 wave pattern (grey). But it does not invalidate the entire uptrend due to the expected support at the long-term moving averages.