
Siemens SE is a German multinational conglomerate company and by revenue the largest industrial manufacturing enterprise in Europe. Company’s principal business divisions are Industry, Energy, Healthcare, Infrastructure & Cities. Founded in 1847 and headquartered in Munich, Germany, the company employs approx. 385’ooo people worldwide. Siemens is a part of both DAX30 and of SX5E indices. One can note that the economic success of the company is truly accompanied by a strong performance of the Siemens stock. Currently, we see the stock price close to the all-time highs. And still, we remain bullish expecting the rally to continue.
Siemens Monthly Elliott Wave Analysis 01.31.2021
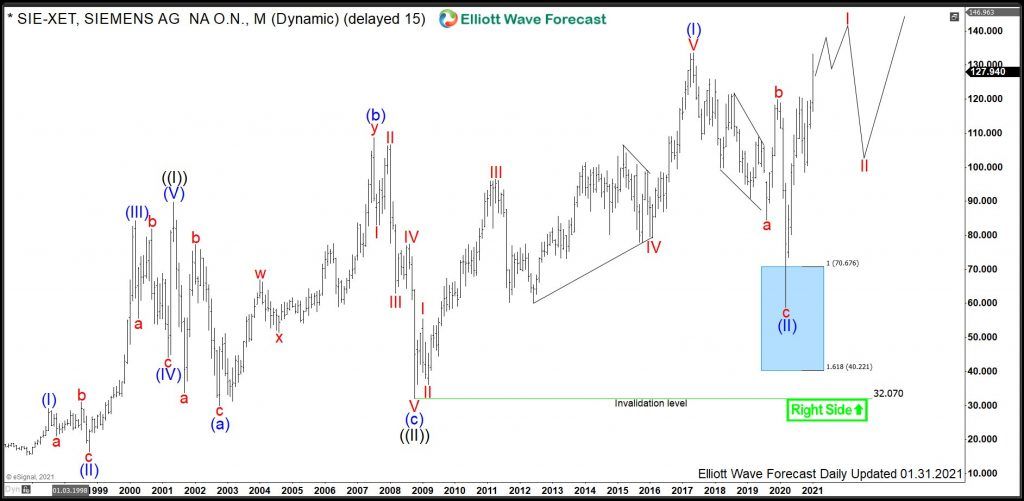
The monthly chart below shows the Siemens stock $SIE traded at XETRA. From the all-time lows, the stock price has developed a cycle higher in black wave ((I)) of grand super cycle degree towards May 2001 highs at 89.75. From there, a correction lower in black wave ((II)) has unfolded as an Elliott wave expanded flat pattern. It has printed an important bottom on October 2008 at 32.07. From October 2008 lows, a new cycle in wave ((III)) has been already confirmed by breaking above 89.75 highs.
A closer look on the price action from 2008 lows unveals the development of another nest being blue wave (I) of black wave ((III)). The 2008 cycle has reached towards the all-time highs on May 2017 at 133.50. From there, a correction has unfolded as a zigzag structure in wave (II). The consolidation has ended in March 2020 at 58.77. While above there, Siemens should be already within wave (III) towards 133.50 highs and even higher. A target fo wave (III) will be 159.95-222.60 area and beyond.
Siemens Daily Elliott Wave Analysis 01.31.2021
The daily chart below shows in more detail the first stages of the advance higher in wave (III). From the March 2020 lows at 58.77, we see the cycle in wave I to be currently within the black subwave ((3)). Once accomplished, the pullback in wave ((4)) is expected to find support above 98.50 lows for an extension higher in wave ((5)). Then, expect a correction in red wave II to take place before an acceleration higher in wave III of (III) should follow.
While traders can be looking to buy pullbacks against 98.50 lows for more upside, long-term traders and investors see even better opportunities. As a matter of fact, investors can be looking to buy the red wave II pullback in 3, 7, 11 swings against 58.77 lows for a rally towards 159.95-222.60 area and even higher. 


