
The price of crude oil declined slightly after the latest OPEC+ meeting. The leaders met during the weekend and agreed to gradually ease some of its production cuts between May and July. They agreed to increase production by about 350,000 barrels in May and June and by 400,000 in July. This decision came shortly after the Biden administration told Saudi Arabia to prevent a substantial rally of oil prices in a bid to keep prices cheap for consumers. It also came a few weeks after oil prices declined from their multi-year highs. Brent is trading at $64.70 while West Texas Intermediate (WTI) fell to $61.30.
Bitcoin and other digital currencies rallied during the weekend as investors looked forward to high demand for the currencies. Bitcoin moved above $60,000 and faced some resistance that pushed it below $58,000. Ether held steady above $2,000 while XRP rose to $0.68. Other top currencies like Cardano, Stellar Lumens, and Bitcoin Cash also rallied during the weekend. This really is mostly because of the rising demand as more institutional investors moved to buy the coin.
The economic calendar will be relatively muted today since many countries are celebrating their Easter holiday. The key data to watch will be the US ISM non-manufacturing PMI numbers from the United States. Analysts expect the data to come in at 58.5, up from the previous 55.3. This growth will be because of the reopening, which has led to positive business activity. Last week, the manufacturing PMI numbers were relatively positive. Other key numbers to watch will be the Turkish consumer inflation numbers and the Singapore retail sales data.
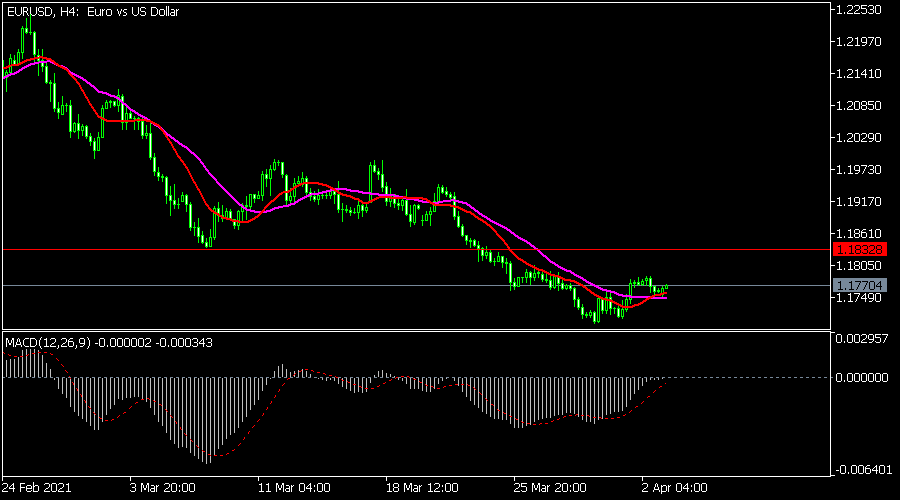
EUR/USD
The EUR/USD pair was a little changed ahead of the US non-manufacturing PMI data. It is trading at 1.1780, which is slightly below last week’s high of 1.1786. On the four-hour chart, the price is slightly above the 25-day and 15-day exponential moving averages (EMA) and the important resistance at 1.1830. It has also formed a small, inverted head and shoulders pattern, which is usually a bullish sign. The pair may keep rising as bulls target the key level of 1.1785.
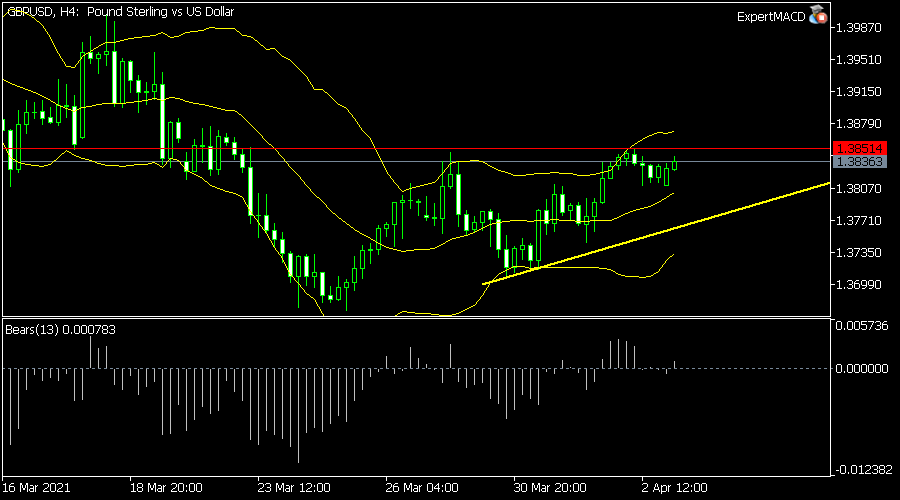
GBP/USD
The GBP/USD price held steady in early trading. It rose to 1.3835, which is substantially higher than last month’s low of 1.3670. On the four-hour chart, the pair has formed an ascending triangle pattern and is still between the upper and middle lines of the Bollinger Bands. The upper side of the ascending triangle is at 1.3850. Therefore, the pair may soon break out higher, with the next key target being at 1.3875.
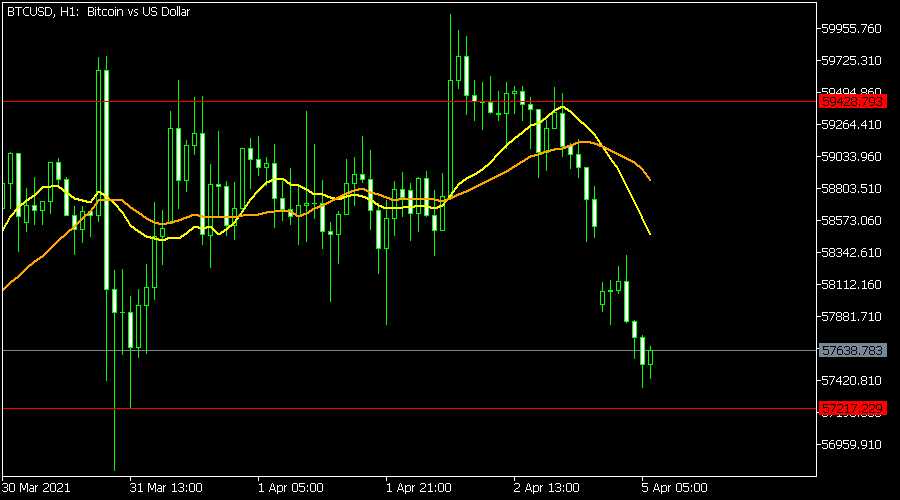
BTC/USD
The BTC/USD has dropped to 57,600, which is below the weekend high of 60,0000. On the hourly chart, the price is slightly above the important support level at 57,217. It is also inside the rectangle pattern that is shown in red and is below the 15-day and 25-day moving averages. The Relative Strength Index (RSI) has also continued to drop. Therefore, while the chart seems bearish, the pair may resume the upward trend as bulls target the upper side at 60,000.


