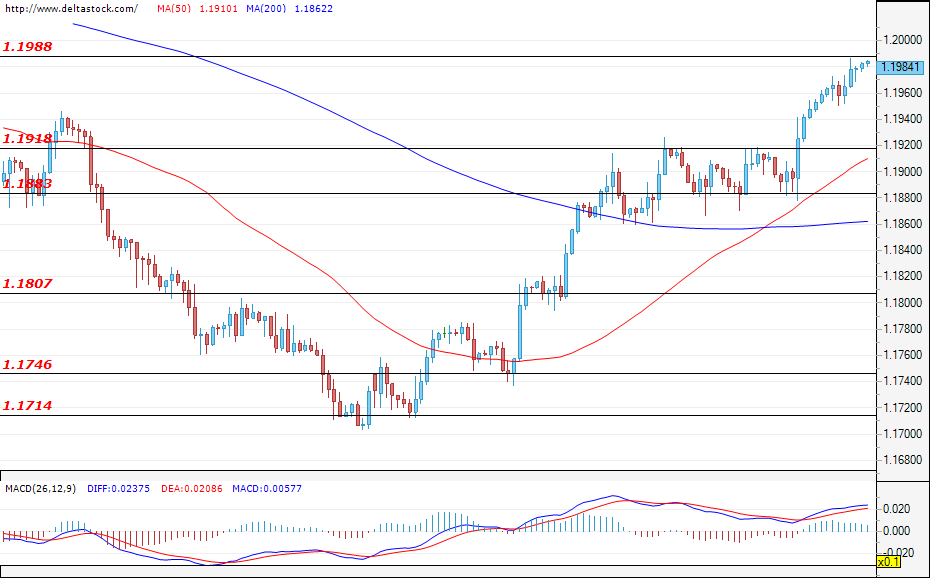
EUR/USD
Current level – 1.1984
The EUR rose against the USD and the price is about to test the major resistance zone at 1.1988. A successful breach of this level could lead to future gains for the European common currency and easily lead the pair towards the levels from the beginning of March of around 1.2102. If the mentioned resistance level at 1.1988 can withstand the bullish attack, we could witness the development of a corrective phase, which should be limited to the support zone at 1.1883. A spike in volatility can be expected at around 12:30 GMT today, when the results from the U.S. retail sales and the initial jobless claims will be published.
| Resistance | Support | ||
| intraday | intraweek | intraday | intraweek |
| 1.1988 | 1.2180 | 1.1920 | 1.1800 |
| 1.2100 | 1.2340 | 1.1880 | 1.1746 |
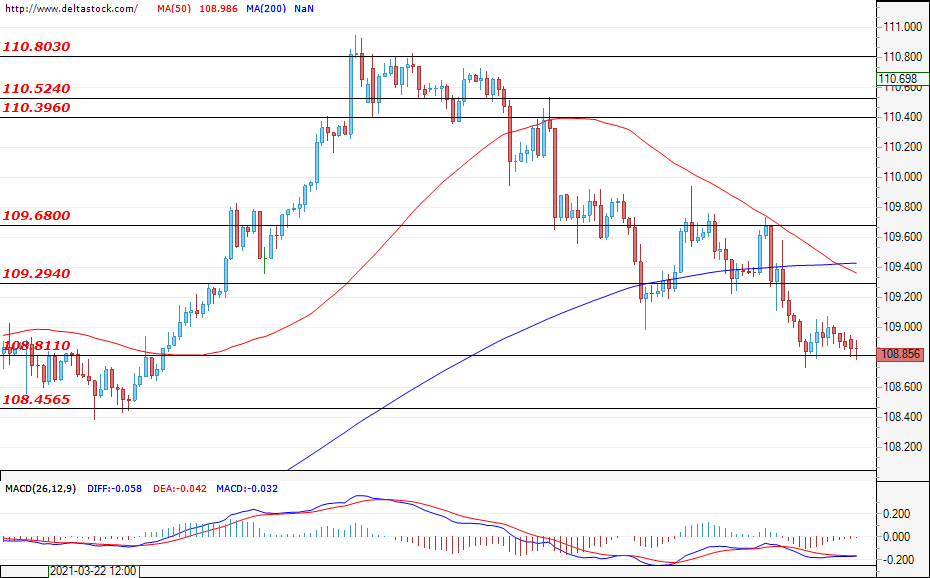
USD/JPY
Current level – 108.85
The bears continue to prevail and the dollar lost even more ground against the yen during yesterday’s session. At the time of writing, the pair is holding positions above the support zone at 108.81, but a successful test of the mentioned level could easily pave the way towards the next target at 108.45. This would strengthen the negative expectations for the future path of the currency pair. If the bulls enter the market, their first resistance would be the zone at 109.29. Only a breach of the next target at 109.68, however, would paint a more bullish picture for the market.
| Resistance | Support | ||
| intraday | intraweek | intraday | intraweek |
| 109.29 | 109.88 | 108.81 | 106.25 |
| 109.68 | 110.39 | 108.45 | 104.90 |
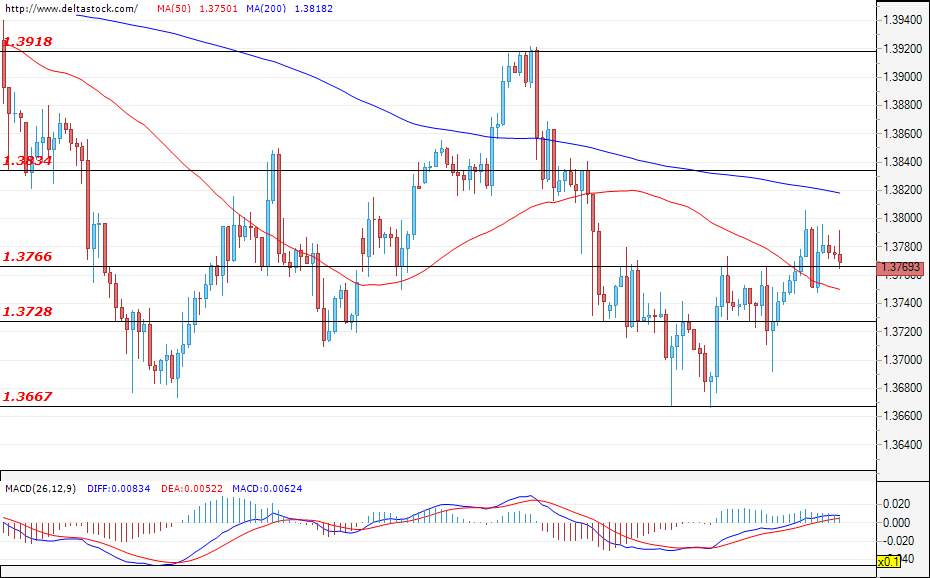
GBP/USD
Current level – 1.3769
The Cable continues to struggle around the zone at 1.3766. During the early hours of today’s trading, the pair held above the mentioned level and, if this remains the case, a test of the next resistance at 1.3834 may turn out to be the most probable scenario. A breach of this resistance will most probably catapult the rally towards the zone at 1.3918. If the bears prevail, their first support would lie at the level of 1.3728, followed by the next target at 1.3667.
| Resistance | Support | ||
| intraday | intraweek | intraday | intraweek |
| 1.3834 | 1.3920 | 1.3766 | 1.3667 |
| 1.3920 | 1.4000 | 1.3728 | 1.3550 |