
There’s a lot of talk in Fintwit lately suggesting that precious metals may have ended the long 8 months correction and ready for the next glorious rally. In this article, I will attempt to answer the question whether Gold has ended correction or not using technical analysis. I will use Elliott Wave Theory and also the simple concept of corrective and impulsive structure. Of course, no technical or fundamental analysis will always be 100% perfect. However, based on the current data, there’s still a possibility that the correction is not over yet. There are three charts presented below suggesting the correction may not be over.
1. Gold has not reached 100% extreme from August 7, 2020 high
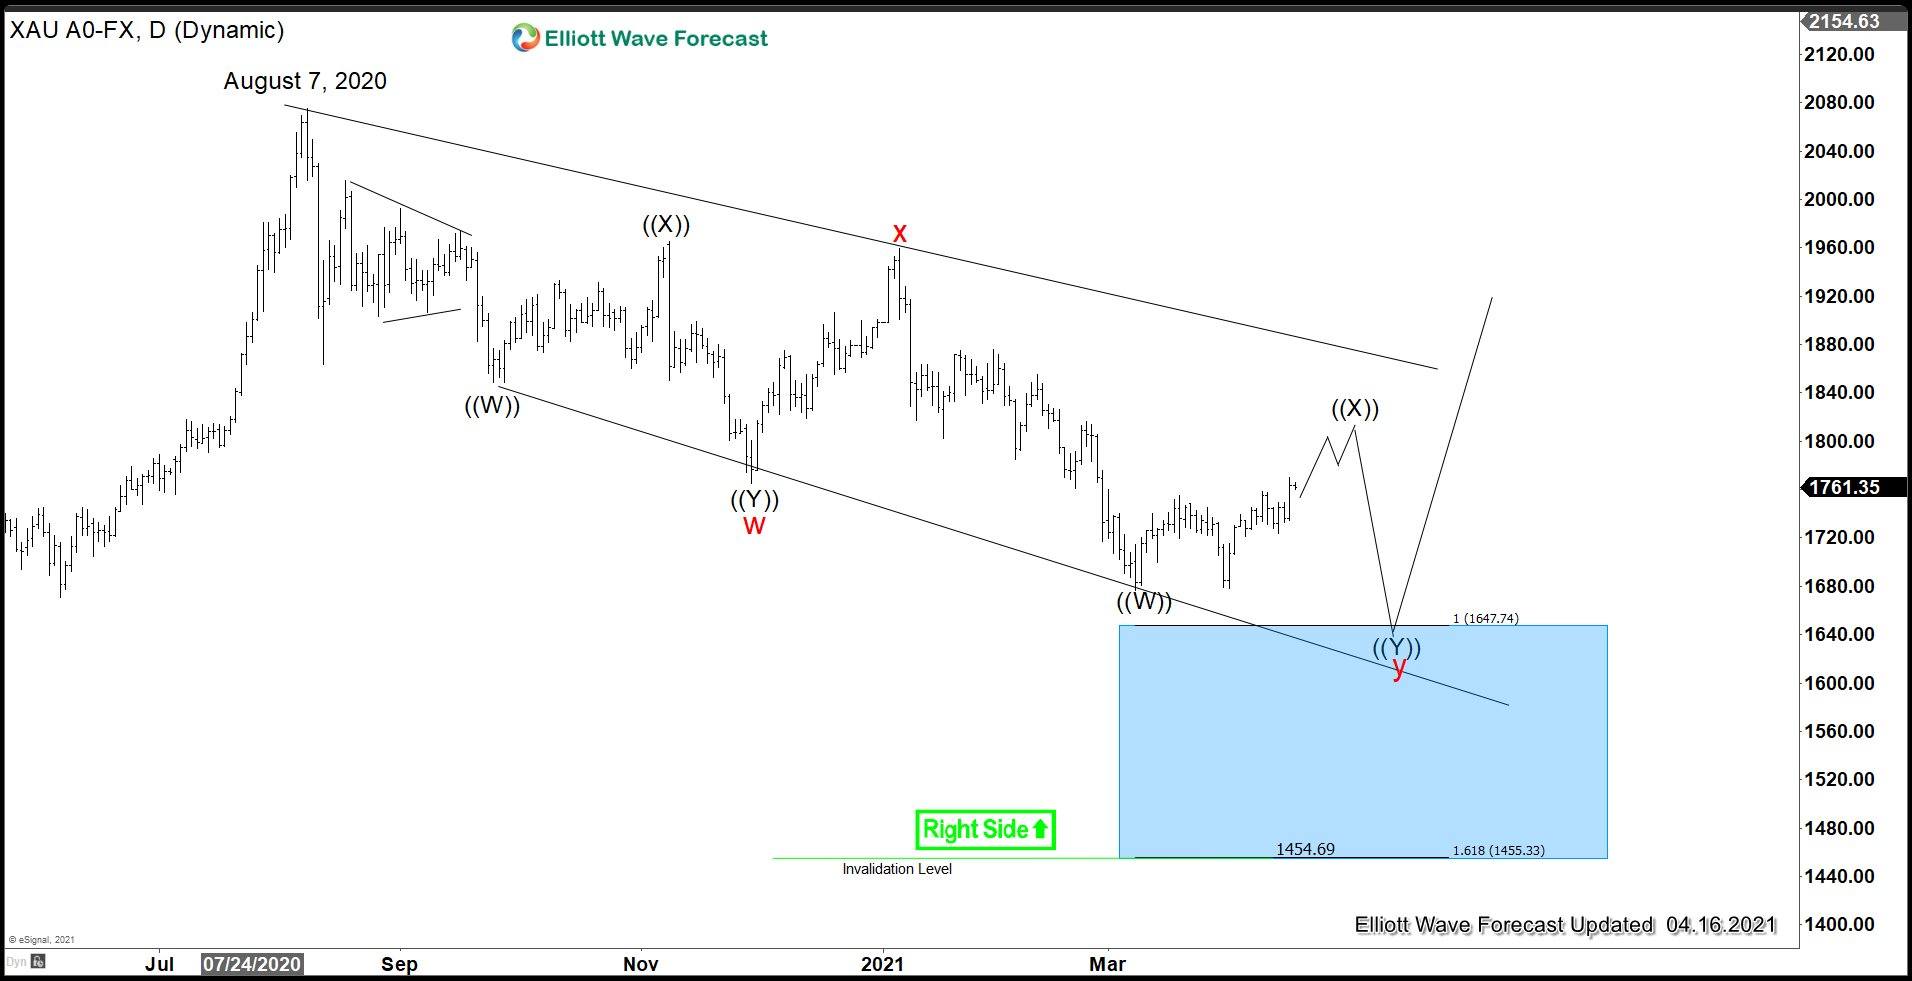
In the Daily time frame above, we could see Gold forming the peak on August 7, 2020 high and now pulling back in a 7 swing double three (wxy) structure. In this type of structure, ideally wave y reaches 100% – 161.8% Fibonacci extension of the wave w. Gold has not reached the 100%, and at this present stage (April 16, 2021), the rally is not strong enough to suggest for sure that the correction is completed. Therefore, we still can not rule out another extension lower in Gold to the blue box area before ending the correction. If Gold continues to rally, breaks and closes above the descending trend line from August 7, 2020, then at that time we will have more data to consider the 8 months correction is over.
2. The first leg of rally from March 9, 2021 is in 3 waves (corrective)
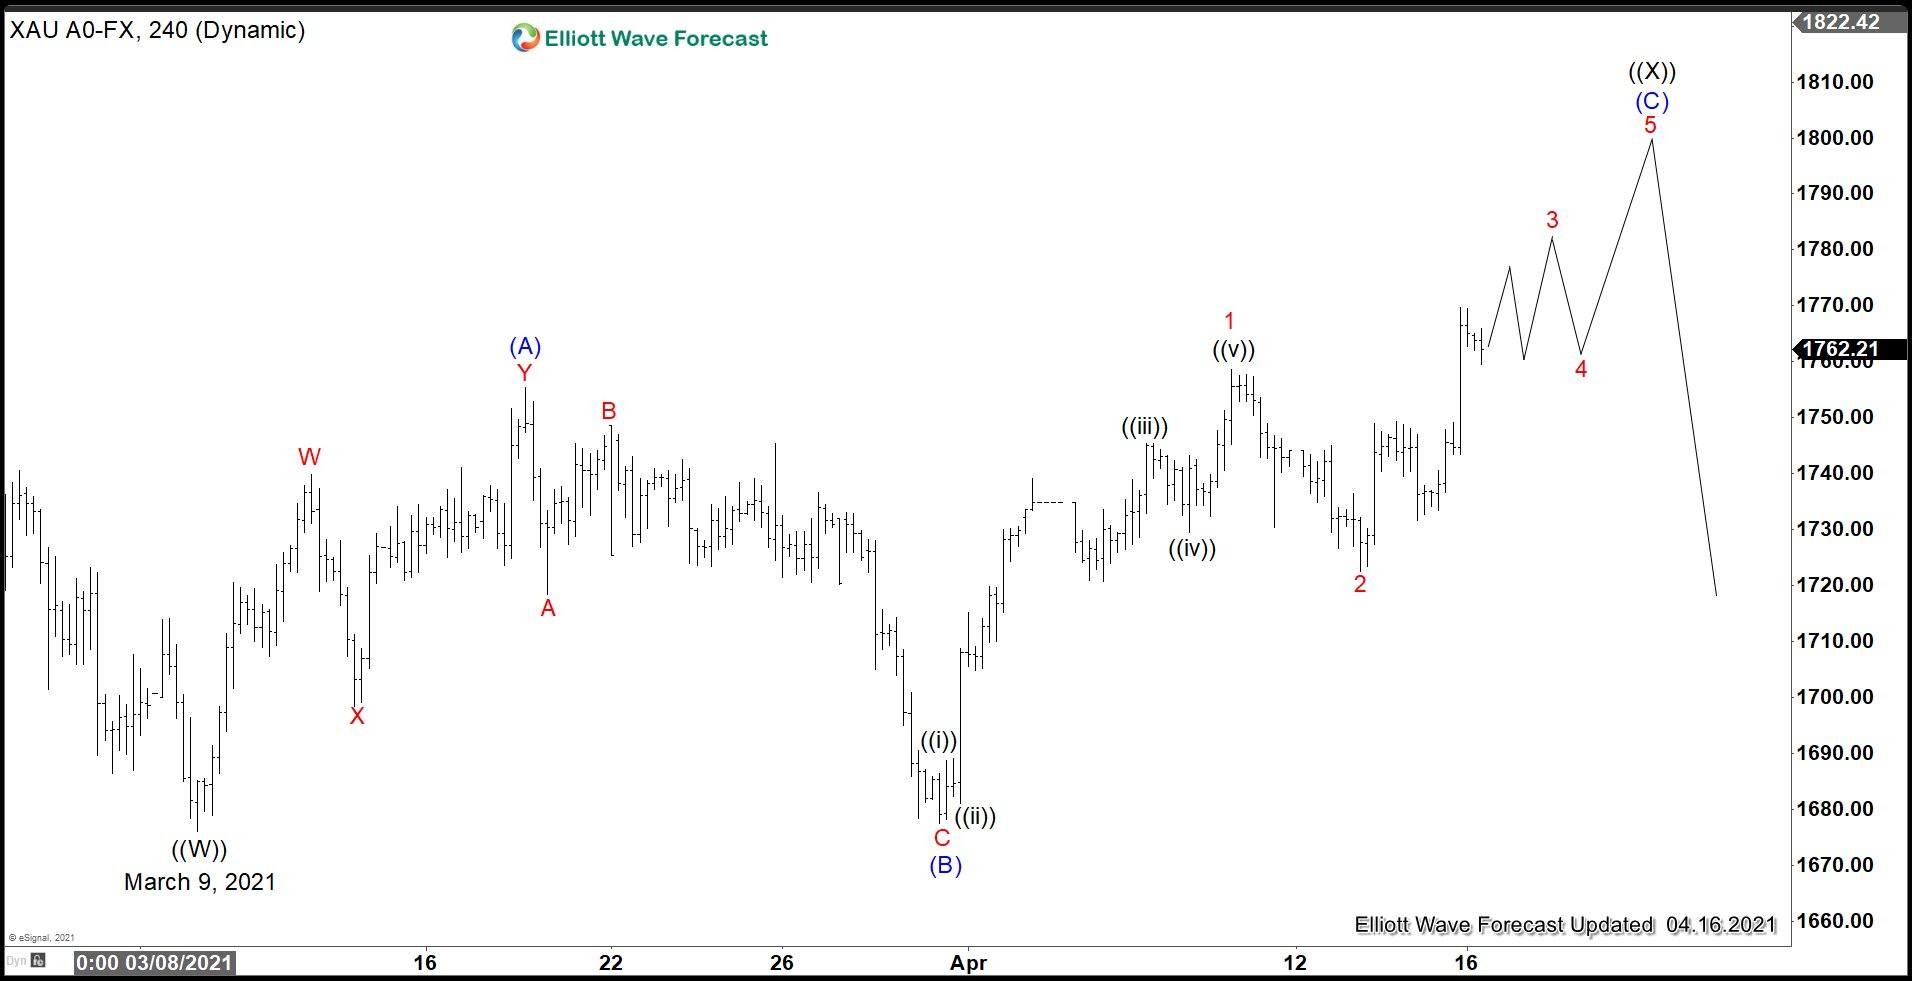
4 hour chart above shows the rally from March 9, 2021 low ($1676.1) to wave (A) at $1755.50 is in 3 waves. If Gold has ended the 8 months correction, the rally from the low would have unfolded as an impulsive structure. However, it is only in 3 waves. With the current data, we still can’t rule out the possibility for further downside after current corrective rally is over.
3. US Dollar Index shows 5 waves up (diagonal) from January 6, 2021 low
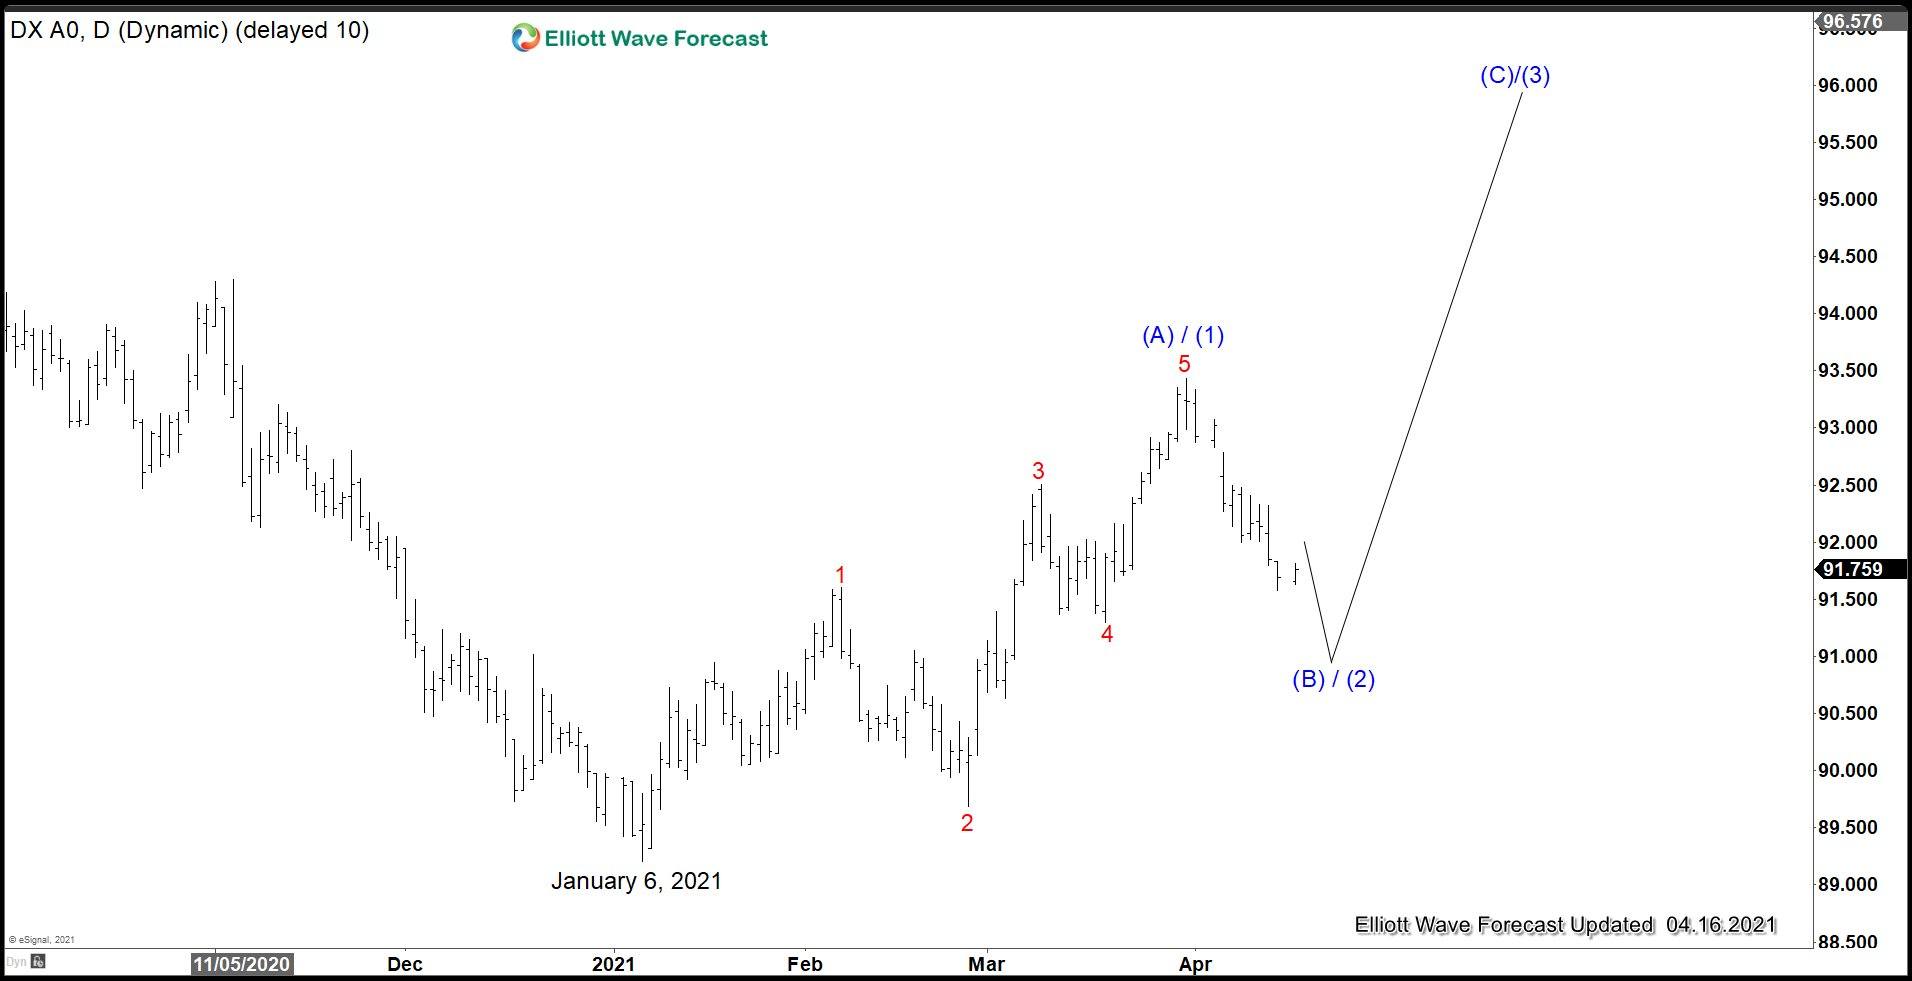
4-hour chart of US Dollar Index (DXY) above shows a 5 waves rally from January 6, 2021 low. Thus, as far as the pullback in the Dollar Index stays above January 6 low, another leg higher can happen. The strength in US Dollar, if it happens, could affect Gold. Gold can turn lower to reach blue box as first chart shows when US Dollar starts to rally.


