
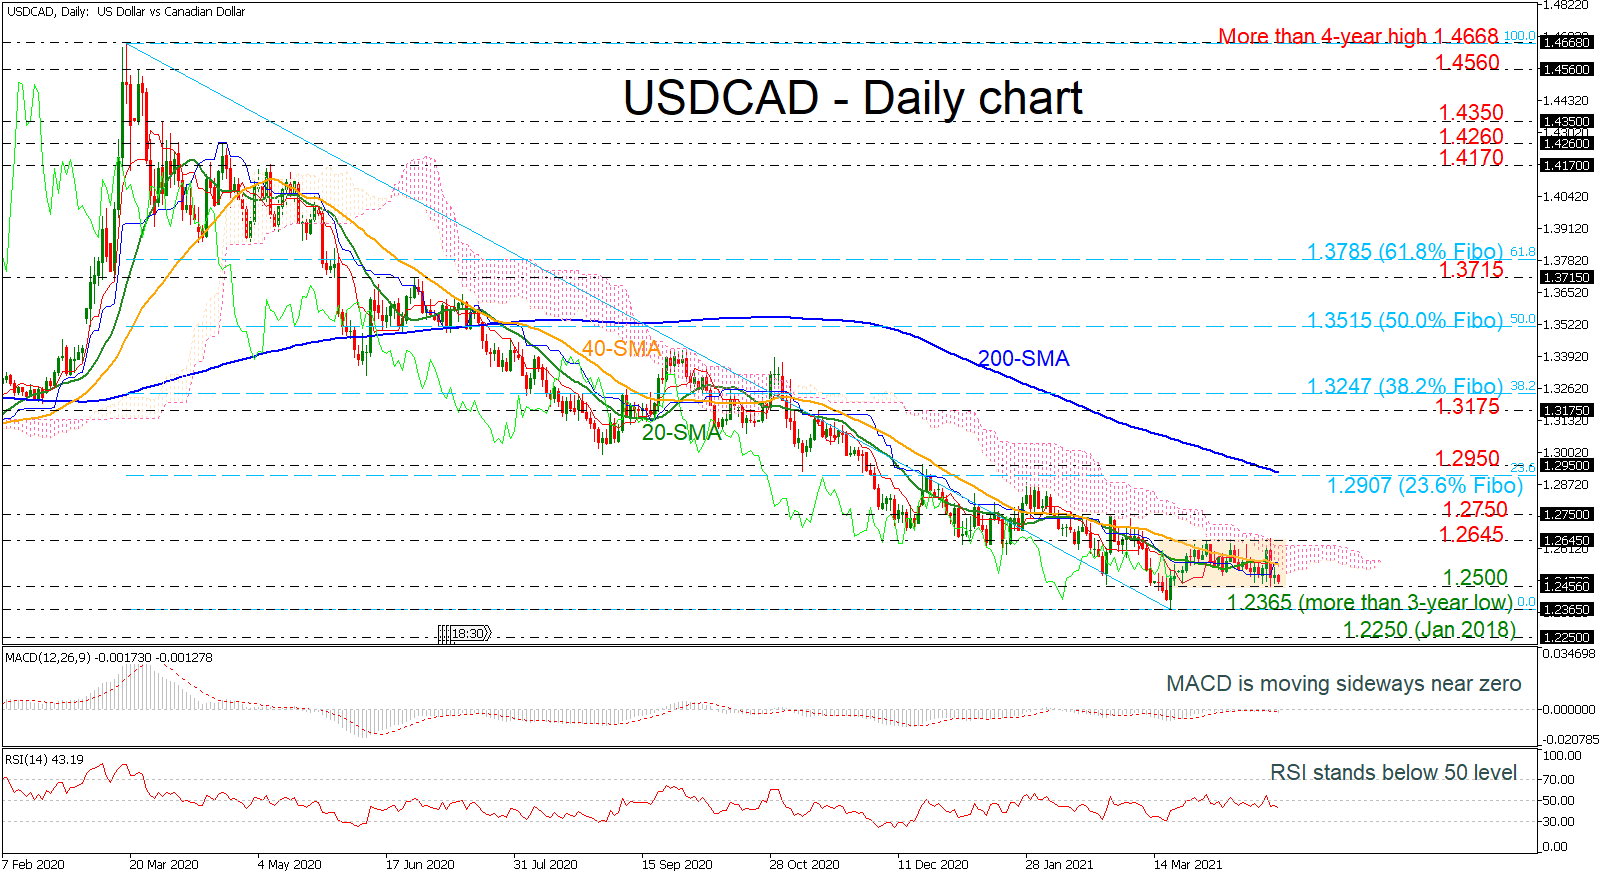
USDCAD has been in a horizontal movement over the last month, developing within the 1.2500 handle and the 1.2645 resistance.
The 20- and 40-day simple moving averages (SMAs) are acting as mid-levels of the range as the price goes back and forth. The flattening mode is reflected on the technical indicators as well. The RSI is holding in the negative territory with weak momentum, while the MACD is moving sideways around the zero level.
If a decline below the 1.2500 handle develops, the more-than-three-year-low of 1.2365 could come in focus, before plunging to the January 2018 trough at 1.2250. More losses could send traders until 1.2060, taken from the low in September 2017.
On the flip side, any successful climbs above the Ichimoku cloud and the 1.2645 resistance could take the market towards the 1.2750 barrier before the bulls improve the buying interest until the 23.6% Fibonacci retracement level of the down leg from 1.4668 to 1.2365 at 1.2907, which overlaps with the 200-day SMA. Marginally above these levels, the 1.2950 barrier and the 1.3175 hurdle could come next.
To sum up, USDCAD is neutral in the near-term, but in the bigger picture, the pair is still exhibiting a negative tendency.


