Technical analysis
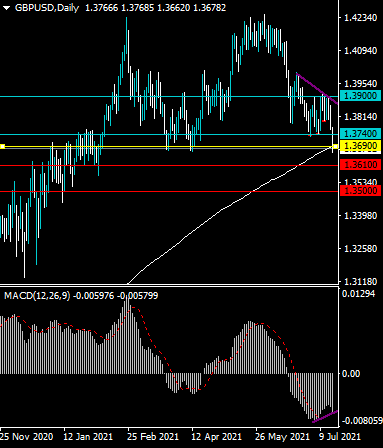
The GBPUSD pair broke below its 200-day moving average for the first-time since December 2020 yesterday.
Bullish MACD price divergence makes selling the GBPUSD pair risky from current trading levels.
What the possible outcomes are
In our most likely scenario, the GBPUSD pair starts to recover above its trend defining 200-day moving average and head back towards the 1.3900 resistance level due to the presence of bullish MACD price divergence.
Alternatively, the GBPUSD pair may continue to weaken below its 200-day moving average on a multi-day basis, and then start to test towards the 1.2500 support level over the coming session.
Key levels
Support 1.2630 1.2500
Resistance 1.3740 1.3900