The EUR/USD currency pair
Technical indicators of the currency pair:
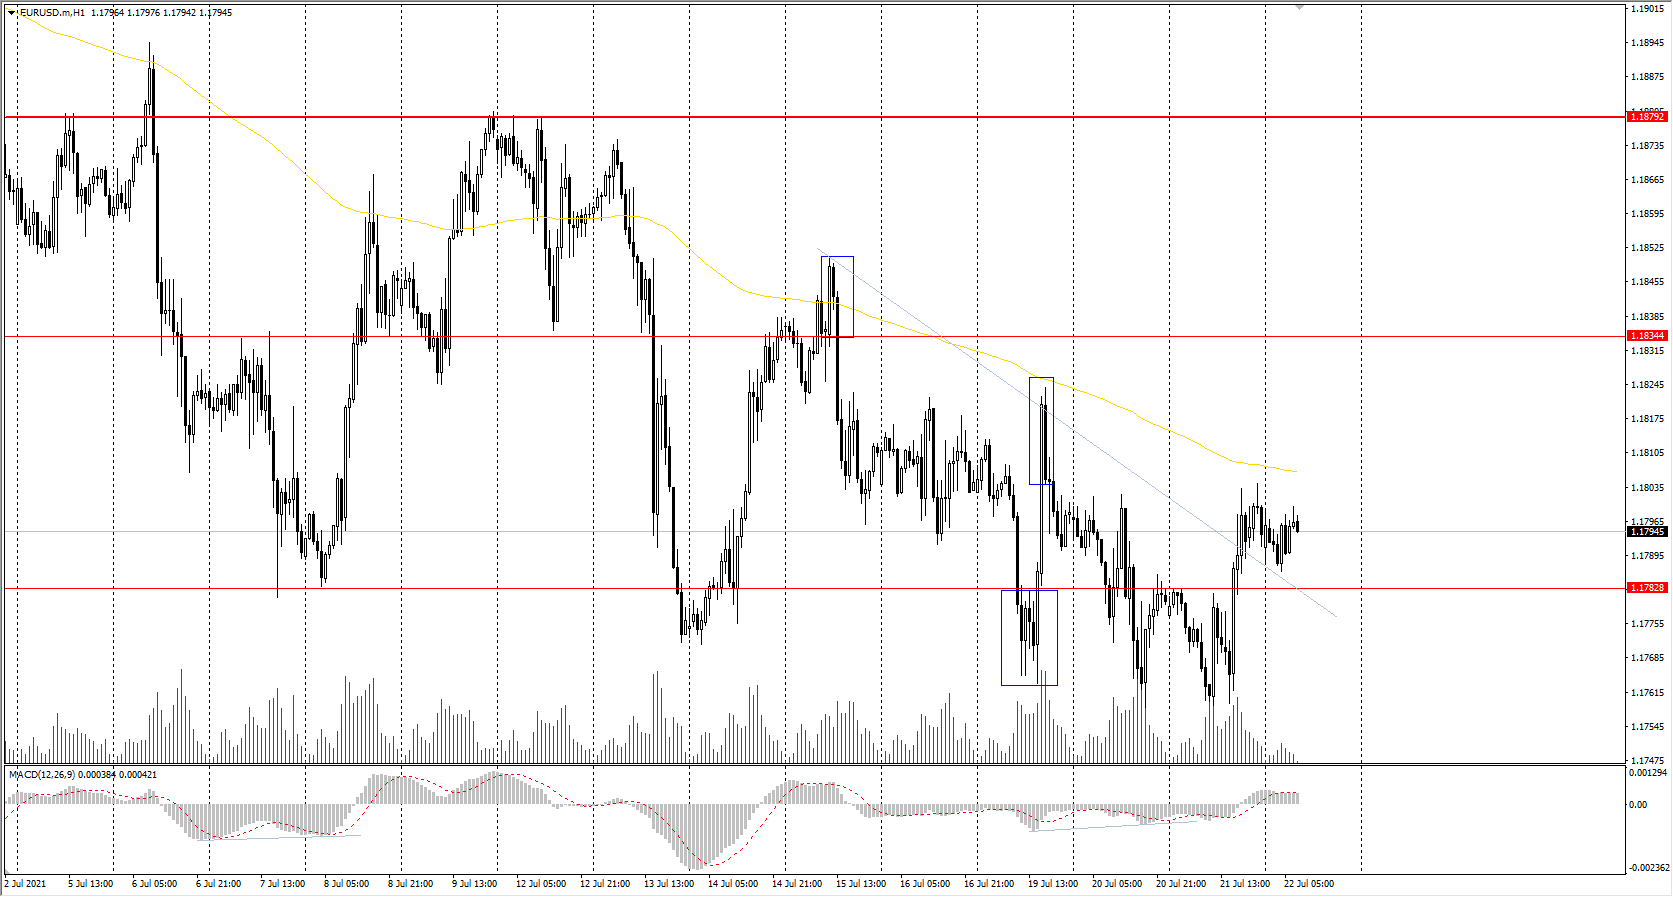
Prev Open: 1.1777
Prev Close: 1.1794
% chg. over the last day: +0.14%
The Federal Reserve is printing more money than the European Central Bank, but the ECB has been buying more assets than the Fed for the whole week. This behavior led to a temporary decline in the euro. But now, the situation is playing in favor of the euro as the Fed will print much more money this week, which will have a negative impact on the dollar index.
Trading recommendations
Support levels: 1.1783, 1.1746, 1.1609
Resistance levels: 1.1834, 1.1879, 1.1934, 1.1969
From the technical point of view, the trend is still bearish. Sellers’ weakness has been replaced by buyers’ initiative. Traders should expect increased volatility with the release of the ECB news. Price can go either way, but buying positions are preferable now, despite the fact that there is a downtrend observed on the timeframe. The divergence on the MACD indicator has not been fully worked out yet on higher timeframes.
Alternative scenario: if the price breaks through the 1.1879 resistance level and fixes above, the general uptrend is likely to be resumed.
News feed for 2021.07.22:
- Eurozone Deposit Facility Rate (m/m) at 14:45 (GMT+3);
- Eurozone ECB Marginal Lending Facility at 14:45 (GMT+3);
- Eurozone ECB Monetary Policy Statement at 14:45 (GMT+3);
- Eurozone ECB Interest Rate Decision at 14:45 (GMT+3);
- Eurozone ECB Press Conference at 15:30 (GMT+3);
- US Initial Jobless Claims (w/w) at 15:30 (GMT+3).
The GBP/USD currency pair
Technical indicators of the currency pair:
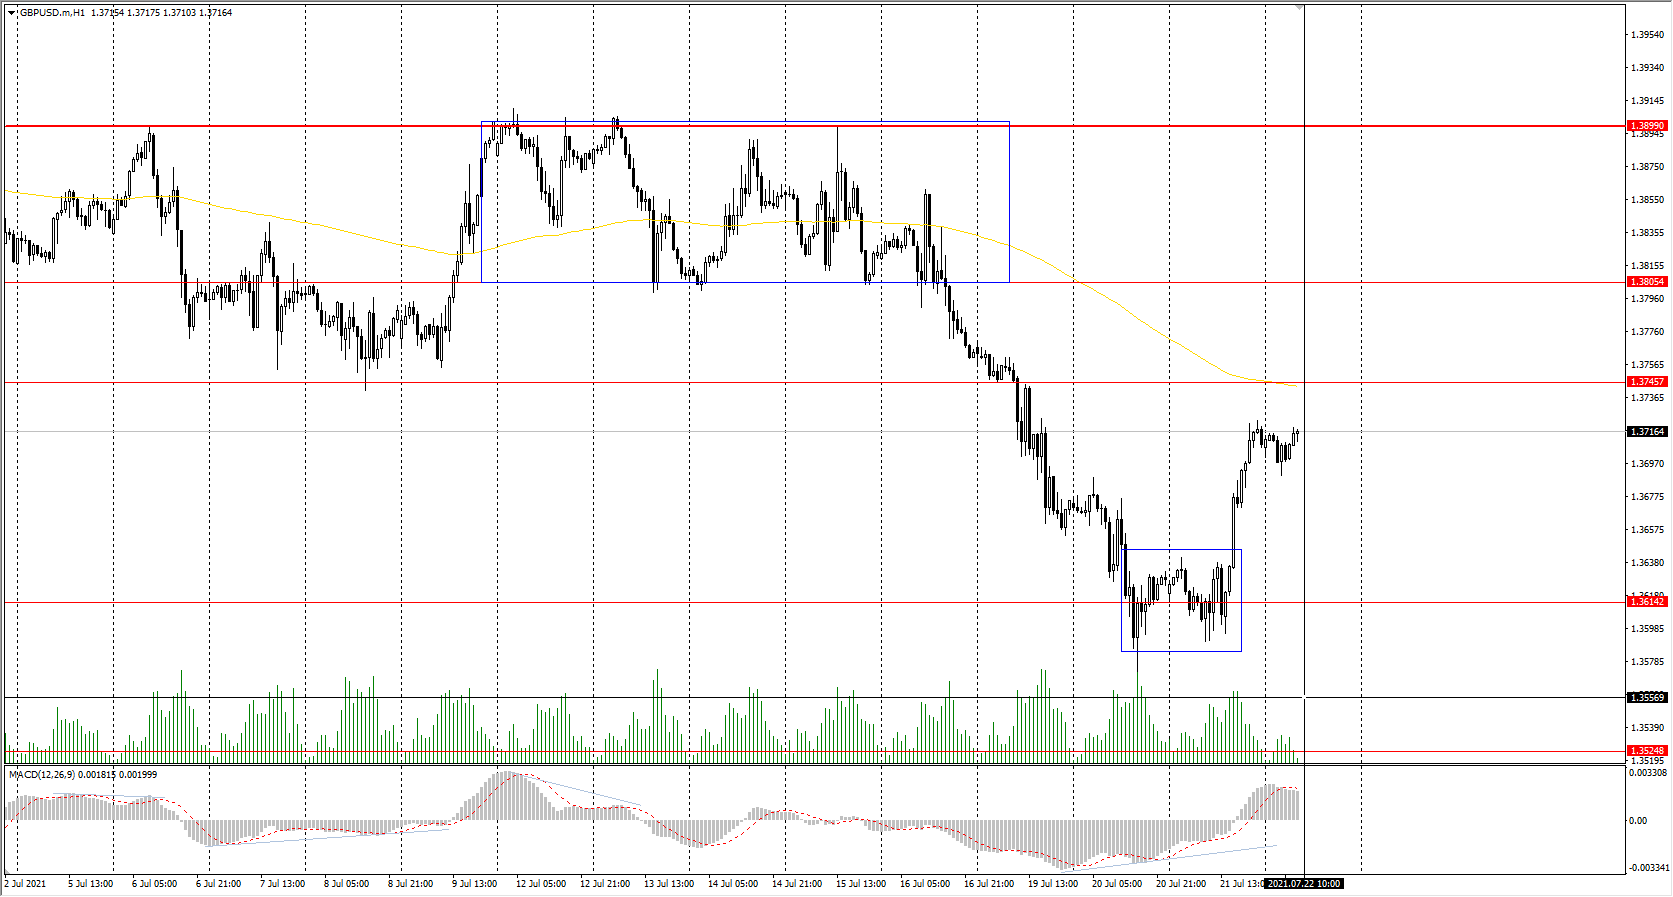
Prev Open: 1.3620
Prev Close: 1.3708
% chg. over the last day: +0.64%
Against the background of the dollar index decrease, the British pound increased by 0.64% yesterday. The coronavirus situation in the UK is rapidly deteriorating after the restrictions were lifted. Still, authorities are confident that this is a short-term spike, which will decrease as the vaccination rate is accelerating.
Trading recommendations
Support levels: 1.3614, 1.3525
Resistance levels: 1.3745, 1.3805, 1.3899, 1.3923, 1.4002, 1.4075, 1.4101
The trend on the GBP/USD currency pair is downward on the H1 timeframe. Yesterday, the buyers took the initiative and formed a false breakdown zone at the bottom, which traders can use to enter long positions. The MACD indicator returned to the positive zone. Under such market conditions, traders are better to look for both sell deals from the resistance levels within the trend and buy deals from the support levels, but only on the intraday timeframes and with short targets.
Alternative scenario: if the price breaks through the 1.3899 resistance level and consolidates above, the bearish scenario is likely to be canceled.
The USD/JPY currency pair
Technical indicators of the currency pair:
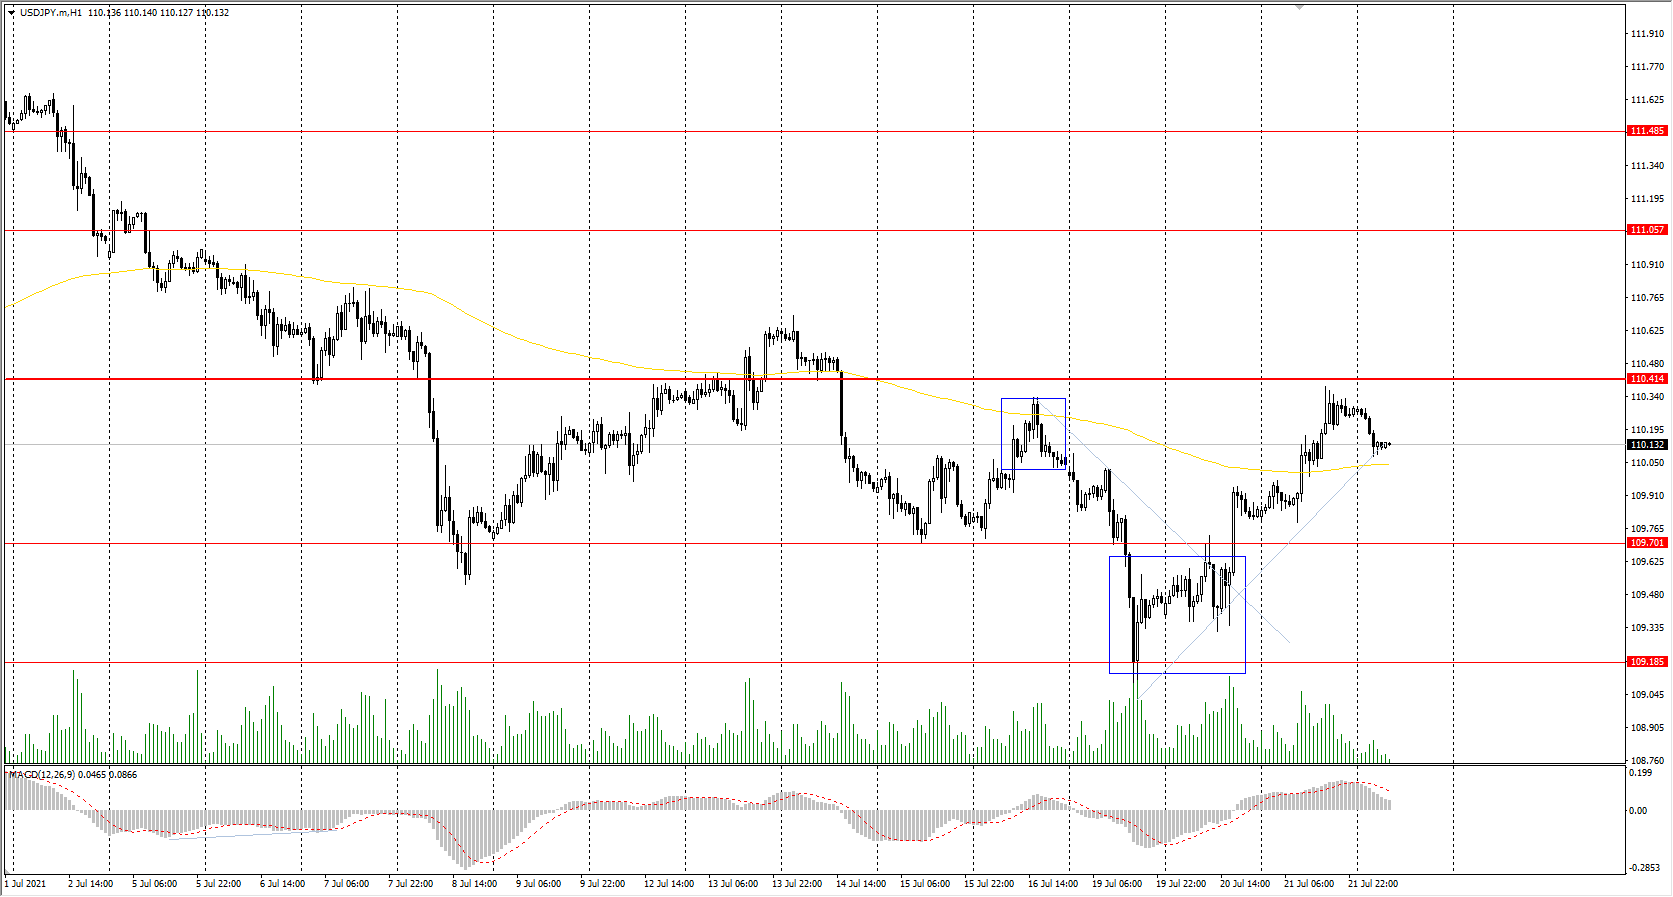
Prev Open: 109.92
Prev Close: 110.29
% chg. over the last day: +0.33%
The USD/JPY currency pair increased by 0.33% yesterday and approached the priority change level. At the same time, both the dollar index and the Japanese yen futures fell yesterday. This suggests that both currencies are demonstrating weakness. A lot will depend on the movement of the dollar index now and its reaction to the release of the weekly labor market news today.
Trading recommendations
Support levels: 109.70, 109.19, 108.65
Resistance levels: 110.41, 110.73, 111.06, 111.48, 110.73, 112.18
From the point of view of technical analysis, the situation has not changed. There is a downward trend on the H1 timeframe, as the price is still trading below the priority change level and the moving average. The MACD indicator tends to zero but in the positive zone. Under such market conditions, traders should look for both selling from the resistance levels and buying from the support levels, but only with short targets.
Alternative scenario: if the price rises above 110.41, the uptrend is likely to be resumed.
The USD/CAD currency pair
Technical indicators of the currency pair:
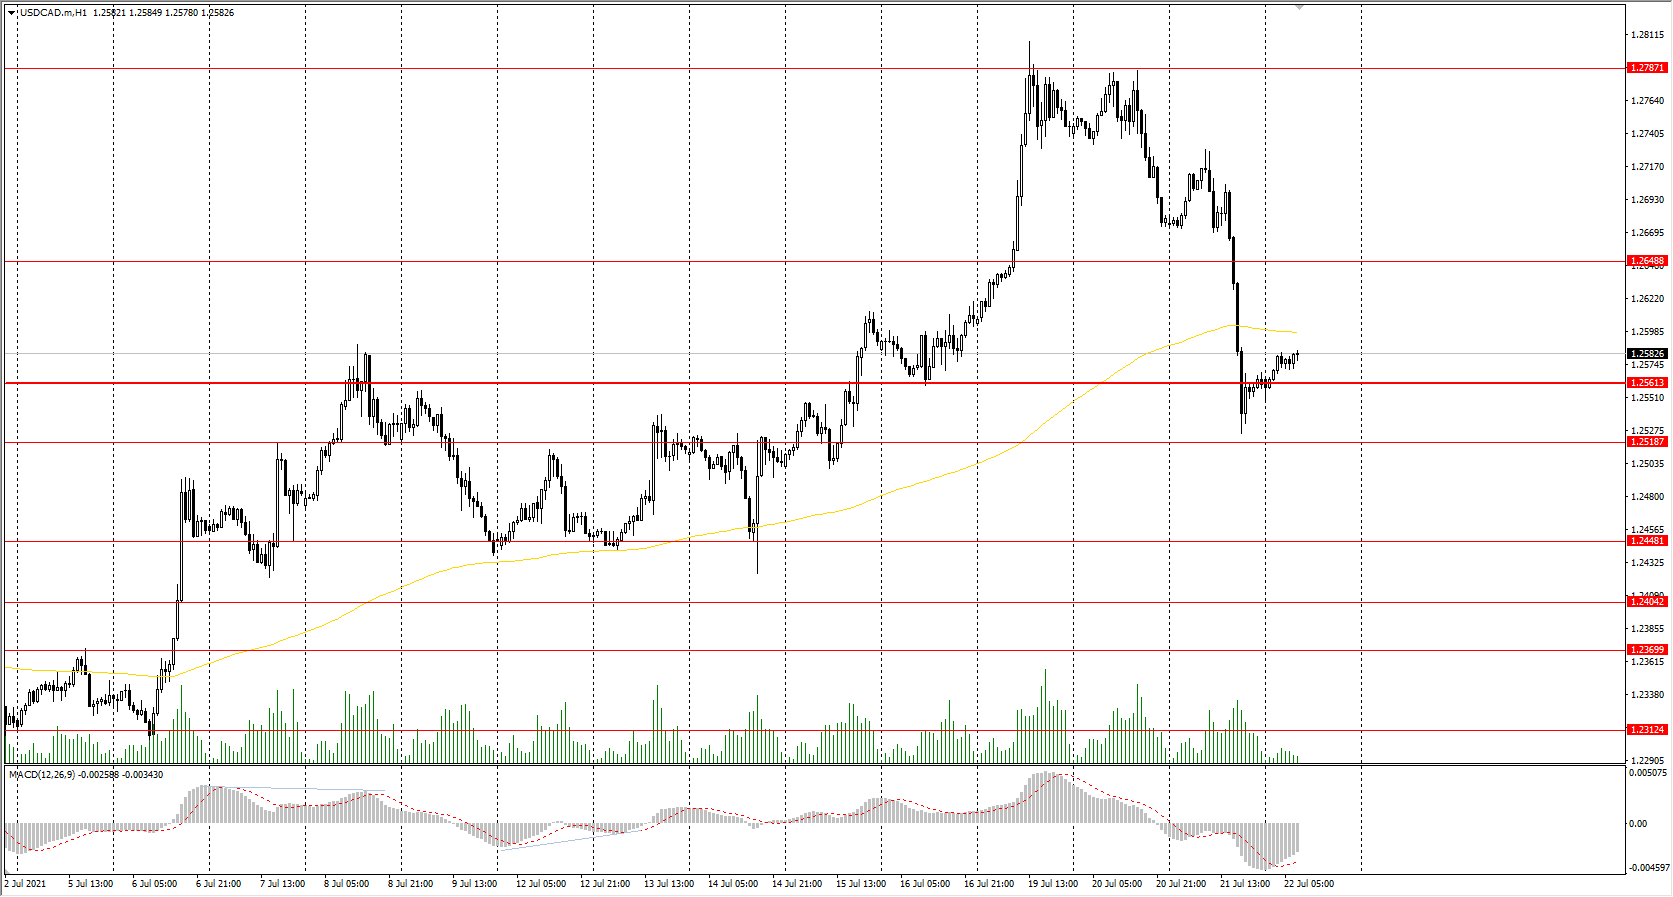
Prev Open: 1.2675
Prev Close: 1.2561
% chg. over the last day: -0.90%
The Canadian dollar is a commodity currency and is highly dependent on oil price movements. Oil prices jumped sharply by 5% with the release of the inventory news yesterday, which caused the Canadian dollar futures to strengthen and the USD/CAD to fall (inverse correlation).
Trading recommendations
Support levels: 1.2561, 1.2519, 1.2448, 1.2404, 1.2347, 1.2312
Resistance levels: 1.2649, 1.2787, 1.2951
Technically, the trend remains bullish. But the price tested the priority change level, followed by a weak rebound. Under such market conditions, it is better to consider intraday trading. Buy positions should be looked for at the nearest support levels, but it is better to buy with confirmation. Talking abut selling positions, traders should t wait for a pullback to the nearest resistance level.
Alternative scenario: if the price breaks through the 1.2561 support level and fixes below, the downtrend is likely to be resumed.