Technical analysis
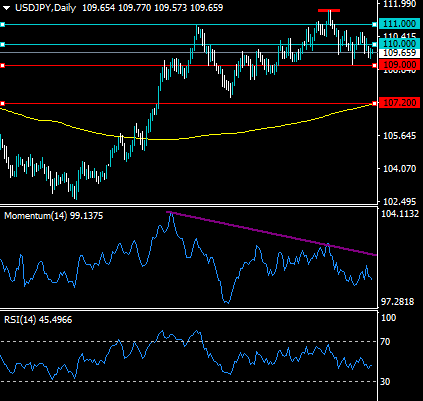
The daily time frame shows that the USDJPY pair continues to trade under the neckline of a large head and shoulders pattern and is vulnerable to heavy losses.
The RSI indicator on the daily time frame is heavily bearish and the Momentum indicator shows large amount of negative price divergence has formed, and extends down to the 107.20 level.
What the possible outcomes are
In our most likely scenario, the USDJPY pair will fall towards its 200-day moving average as the bearish head and shoulders pattern starts to play out to the downside.
Alternatively, the USDJPY pair may just range trade between the 109.00 and 110.00 levels as traders remain undecided ahead of the Non-farm Payrolls job report this Friday.
Key levels
Support 109.00 107.20
Resistance 110.00 111.00