
Can it break back into bullish territory?
The dollar has come under pressure over the last couple of weeks as the economic data has necessitated a more dovish line from the Federal Reserve .
The result is that, despite breaking below the 200/233-day SMA and into bearish territory, the pair has failed to gain much traction to the downside.
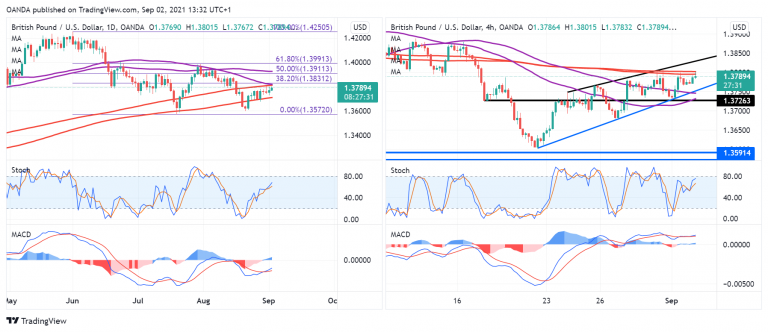
We’ll soon see whether that failure is temporary or more prolonged, with the pair now testing the upper end of that band from below. This also coincides with the 55-day SMA and the 38.2% retracement level of the June highs to July lows.
On the 4-hour chart, this also coincides with the 200/233-period SMA band, so it’s no surprise the pair is seeing so much resistance around this area.
The rally over the last couple of weeks is seeing momentum slow, as evidenced by the rising wedge – a bearish pattern , and the stochastic and MACD on the 4-hour chart, where divergences are clear.
That would suggest a continuation of the move lower is more likely but also that a break above 1.38 could trigger quite a sharp and bullish move higher, with stops above here potentially exacerbating any move.
With Fed speakers and US data today and the US jobs report tomorrow, we may not have to wait long to see which it will be.


