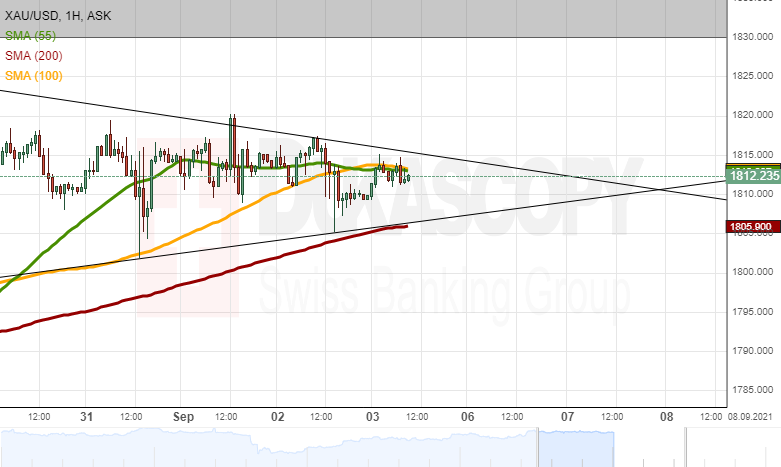
The previously assumed-to-be sideways trading of the yellow metal has been slowly decreasing volatility. Moreover, by inspecting the hourly candle chart, a triangle pattern has been spotted. In theory, all trading in a triangle pattern eventually ends with a break out either to the upside or downwards.
In the case that the rate breaks out up, it would face the resistance of the 1,820.00 level. Afterwards, the August high zone at 1,830.00/1,835.00 could provide resistance.
A breaking out of the triangle downwards would aim at the 1,800.00 level, which has been acting both as resistance and support. Below the 1,800.00, other round price levels might provide support.