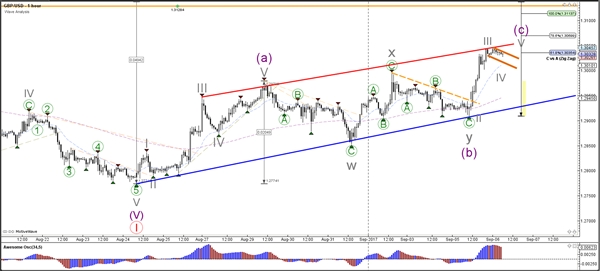
Currency pair GBP/USD
The GBP/USD did break above the resistance trend line (dotted orange) which kick started an impulsive wave C (purple). This C wave has reached the 50% Fibonacci level of wave 2 vs 1 but could extend further to the 61.8% Fib. This Fib plus the resistance levels of a potential head and shoulders pattern on the daily chart (orange lines) could act as potential resistance.
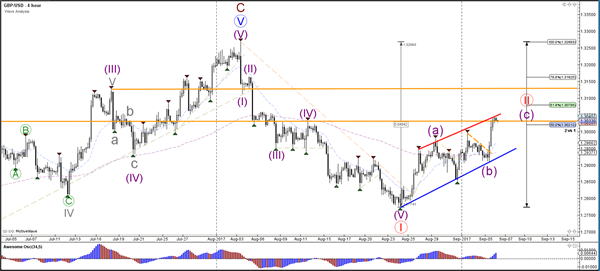
The GBP/USD could be building a wave 4 (grey) correction within the wave C (purple). A potential bull flag pattern (orange lines) could confirm this wave 4 structure. The target zone is around 1.3075- 1.31. The bearish retracement should typically not retrace deeper than 1.30-1.2975 otherwise price might not be in smaller wave 4 (grey).
Currency pair EUR/USD
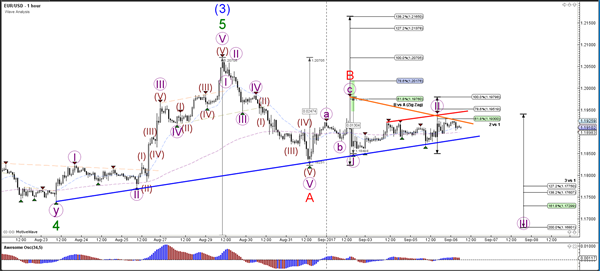
The EUR/USD is moving slowly and choppily and remains in a corrective chart pattern between support and resistance trend lines (blue/red). A break below the support trend line (blue) could confirm a potential ABC correction (red). The ABC correction (red) is invalidated if price breaks above the 138.2% Fib at 1.2165. A break above the resistance trend line (red) could indicate that there is bullish pressure to test the Fib levels of wave B vs A.
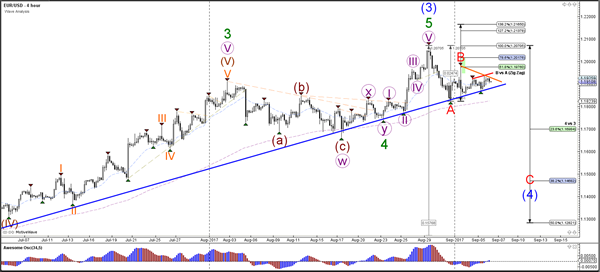
The EUR/USD could be building a potential wave 1 and 2 (purple) within wave C (red) and test the Fibonacci levels of wave 2 vs 1 (purple). A break above the 100% Fib level at 1.1980 invalidates it and could indicate that price will challenge higher Fib levels of wave B vs A. A bearish break below support (blue) could start the wave 3 (purple).
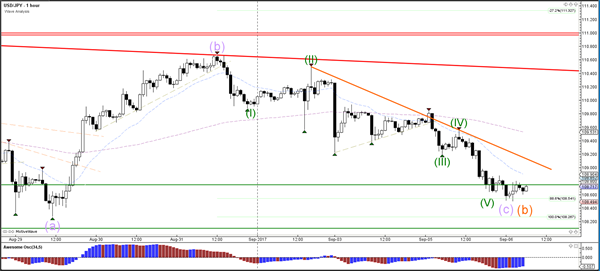
Currency pair USD/JPY
The USD/JPY is retesting the support zone (green) again which is a bounce or break spot. A bearish break below the zone indicates a downtrend whereas a bounce could indicate a continuation of wave C (orange).
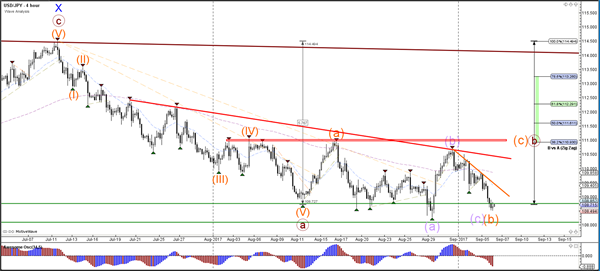
The USD/JPY is testing the 88.6% Fibonacci support level. A bullish bounce and then bullish break above resistance (orange) could indicate the completion of wave B (orange).