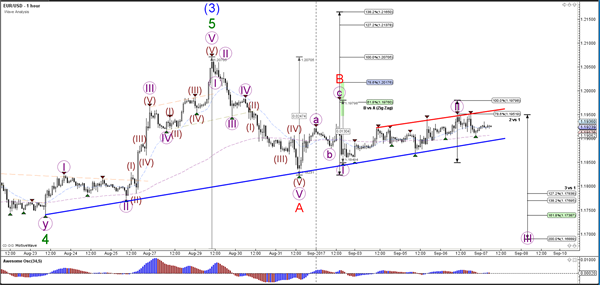
Currency pair EUR/USD
The EUR/USD is building a bear flag chart pattern (blue/red) before the interest rate decision later today in the Euro zone., which will be communicated by the European Central Bank. A break below the support trend line (blue) could confirm a potential ABC correction (red). The ABC correction (red) is invalidated if price breaks above the 138.2% Fib at 1.2165. A break above the resistance trend line (red) could indicate that there is bullish pressure to test the Fib levels of wave B vs A.

The EUR/USD could be building a potential wave 1 and 2 (purple) within wave C (red) and test the Fibonacci levels of wave 2 vs 1 (purple). A break above the 100% Fib level at 1.1980 invalidates it and could indicate that price will challenge higher Fib levels of wave B vs A. A bearish break below support (blue) could start the wave 3 (purple).
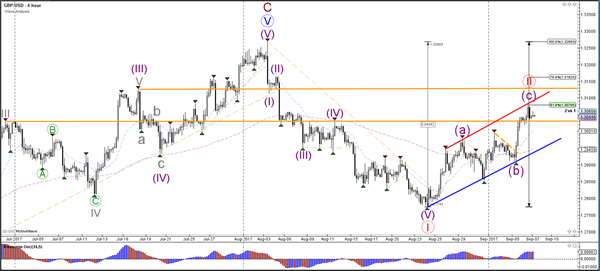
Currency pair GBP/USD
The GBP/USD did extend further to the 61.8% Fibonacci retracement level of wave 2 vs 1 (red). This Fib plus the resistance levels of a potential head and shoulders pattern on the daily chart (orange lines) and the top of the bearish channel (red) could act as potential resistance.
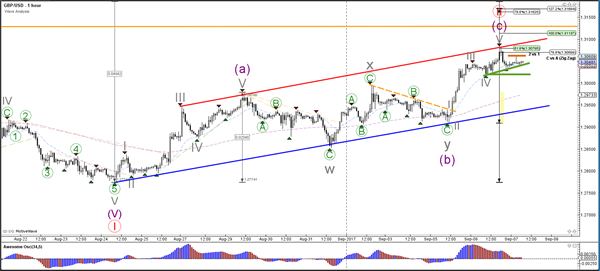
The GBP/USD indeed built a wave 4 and 5 (grey) yesterday to the target at 1.3075. Price could build one more bullish extension if it manages to stay above the support levels (green) and break above the resistance zone. The next bullish target could be the 78.6% Fib whereas the next bearish target could be the bottom of the channel (blue).
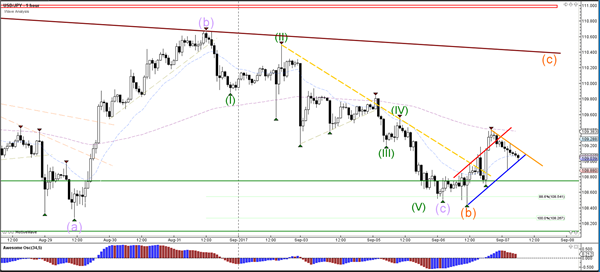
Currency pair USD/JPY
The USD/JPY again bounced at the support zone (green), which created a bullish channel (red/blue) and broke above the resistance trend line (dotted orange). Price could continue towards the next resistance zone (red) if price can break above local resistance (orange).
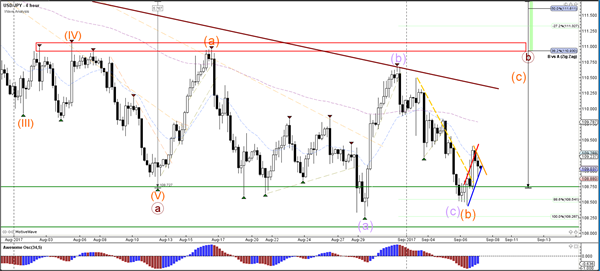
The USD/JPY is at a new bounce or break spot with price testing both a support (blue) and resistance (orange) trend line.