Currency pair EUR/USD
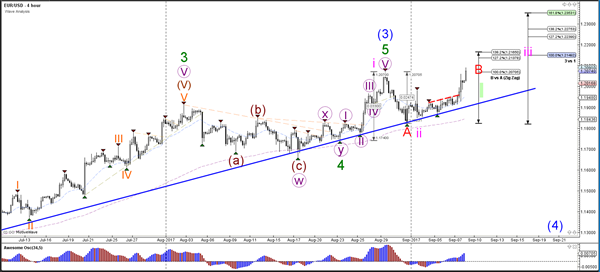
The EUR/USD broke above the resistance trend line (dotted red) yesterday during the European Central Bank (ECB) statement. Price could now be in an uptrend as indicated by the 3 wave structure (pink) or still making a larger ABC (red) correction within wave 4 (blue).
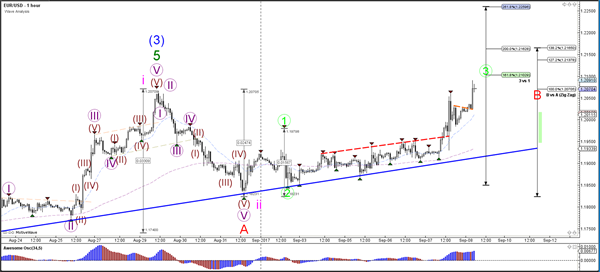
The EUR/USD could be resuming its uptrend with a potential wave 123 (green) if price manages to break above 1.21 and build a continuation chart pattern.
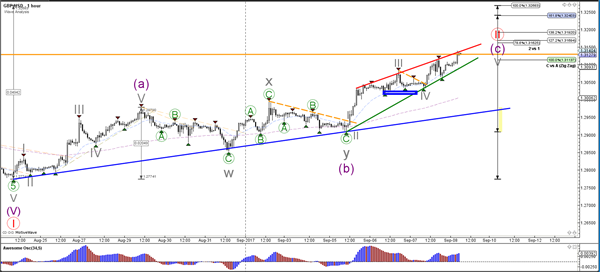
Currency pair GBP/USD
The GBP/USD broke above the 61.8% resistance Fibonacci retracement level of wave 2 vs 1 (red). Price is now testing the next resistance zone (orange) and 78.6% Fib.
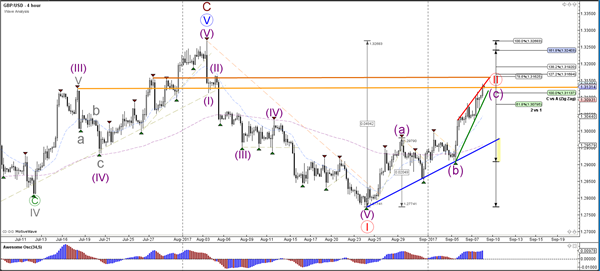
The GBP/USD respected the support zone (blue) and broke above the resistance trend line (dotted orange). Now price seems to be building a rising wedge chart pattern (red/green lines).
Currency pair USD/JPY
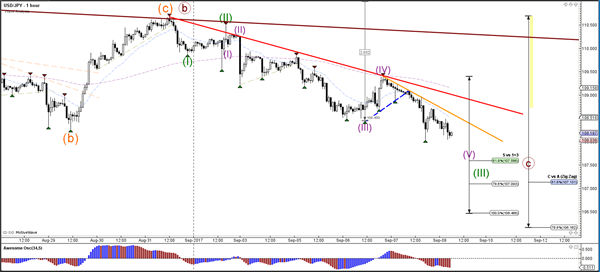
The USD/JPY is testing the lowest part of the support zone (green) but the downtrend could now be strong enough to break below it and move towards the Fib targets of wave C vs A.
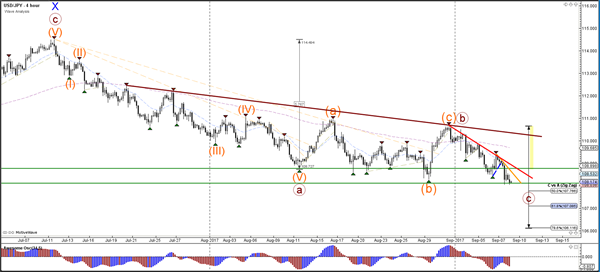
The USD/JPY could be moving in a wave 5 (purple) of wave 3 (green).