
The crypto market had a rough start of the year, declining by more than 20% due to the hawkish Federal reserve statements. As a result, the crypto market’s capitalization lost 45% and fell to $1.64 trillion, the lowest since August 2021.
Altcoins are falling increasingly faster than the first cryptocurrency, causing an increase in the share of BTC, which is already 42.3% against 39.3% lows in mid-January. Bitcoin’s 40% share looks like a turning point that triggered a correction in the crypto market twice before.
The correction is not over
It is well-known the crypto market has a strong positive correlation with the US stock market. This fact should reduce optimism among crypto investors as of the end of trading Tuesday, January 25, 2022, is now, officially, the worst-ever start in the history of the S&P 500.
Some traders hold a belief, called the January barometer, the investment performance of the S&P 500 in January can predict its performance for the rest of the year. If this belief turns out to be true, the crypto market will face a rough year.
Reasons for the pressure
The first reason is macroeconomic news from the USA. According to the Fed’s January meeting, the US regulator can raise interest rates faster and earlier. The market is pricing five rate hikes up to 1.5%. Technology companies will remain under pressure with this market trend, dragging the cryptocurrency market into a deeper correction.
The instability of the situation with the cryptocurrencies regulation in Russia also pressures the market. The Russian Central Bank announced that trading and mining cryptocurrencies would be prohibited. Fortunately, later, President Vladimir Putin joined the discussion and offered to regulate cryptocurrencies operations instead of blocking them.
Russia is the third country in the world by mining hash rate. Therefore, the crypto market is highly dependent on the final decision of the Russian government.
Technical analysis
BTC/USD, weekly chart
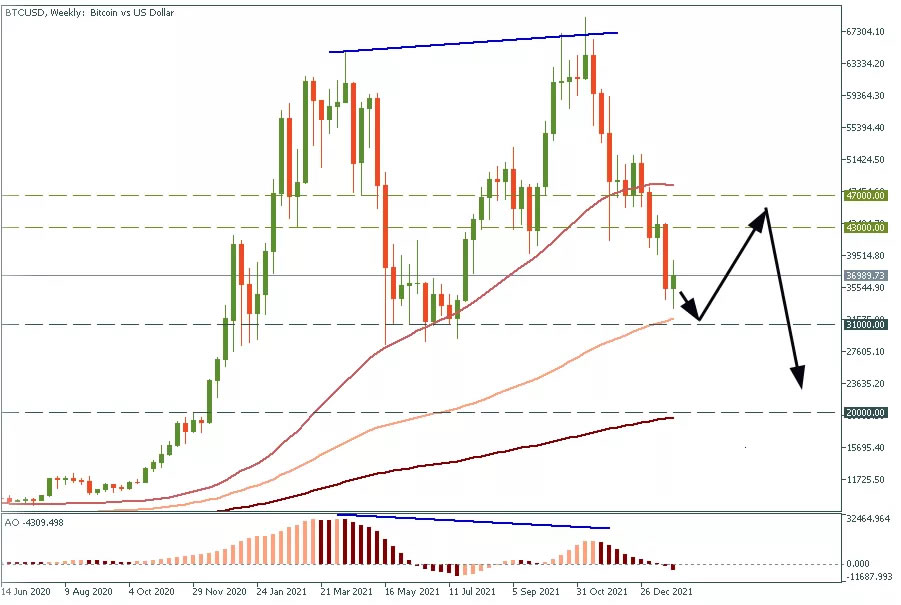
The bearish divergence appeared on the weekly Bitcoin chart. At the moment, the price is trading above the key support level of $30 000. However, we expect Bitcoin not to break this support through right away. Instead, it will rise to $43 000 – $47 000, form a bull trap, and crush down to $20 000 as the Federal Reserve increases the interest rate.
ETH/USD, monthly chart
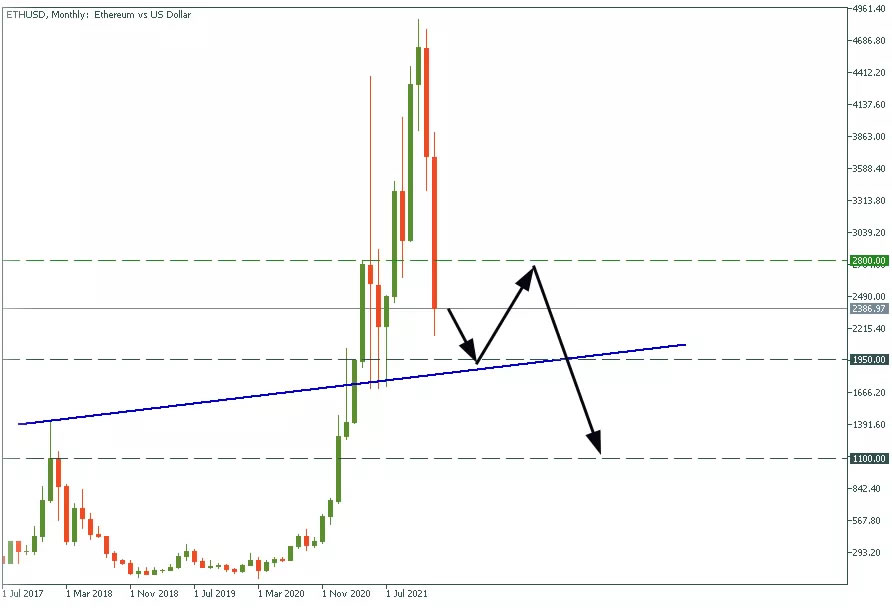
Ethereum will follow “the big brother” and decline down to $1900 first with a solid bounce up to $2800 after. Then, when the price finishes the head-with-shoulders pattern, it will decline to $1100.
BNB/USD, weekly chart
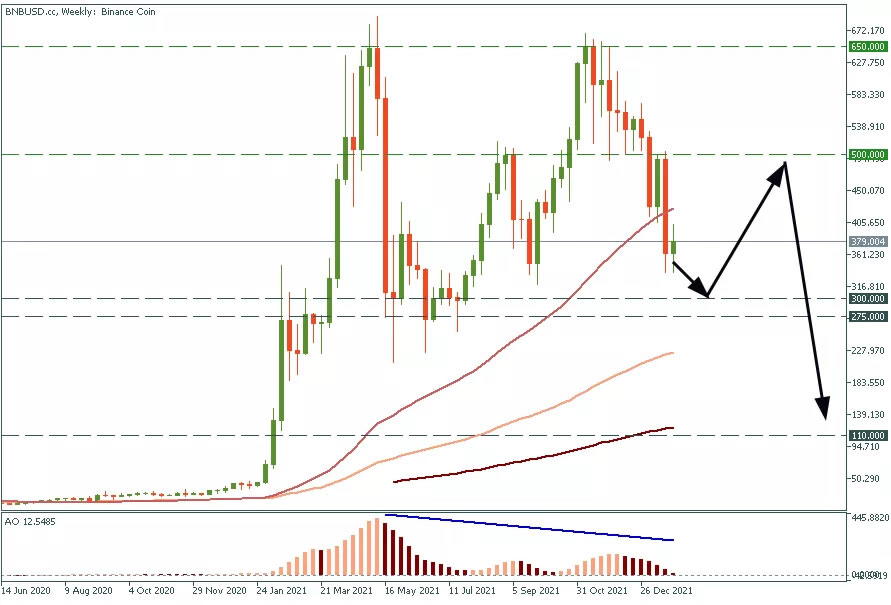
Binance coin can decline to the $275-300 support range. After that, the price might rise as high as $500. As well as Ethereum, BNB/USD might form a head-with-shoulder pattern and drop down to $110 afterward.
Conclusion
The immediate future of the crypto market looks rather gloomy. Fortunately, FBS traders can trade both sides, long and short, and earn the same on bull and bear markets.


