
A note on lower timeframe confirming price action…
Waiting for lower timeframe confirmation is our main tool to confirm strength within higher timeframe zones, and has really been the key to our trading success. It takes a little time to understand the subtle nuances, however, as each trade is never the same, but once you master the rhythm so to speak, you will be saved from countless unnecessary losing trades. The following is a list of what we look for:
- A break/retest of supply or demand dependent on which way you’re trading.
- A trendline break/retest.
- Buying/selling tails … essentially we look for a cluster of very obvious spikes off of lower timeframe support and resistance levels within the higher timeframe zone.
- Candlestick patterns. We tend to only stick with pin bars and engulfing bars as these have proven to be the most effective.
We typically search for lower-timeframe confirmation between the M15 and H1 timeframes, since most of our higher-timeframe areas begin with the H4. Stops are usually placed 1-3 pips beyond confirming structures.
EUR/USD
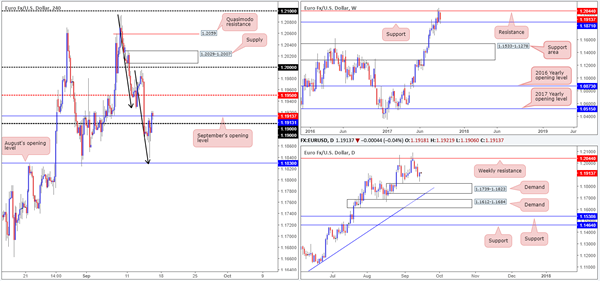
In recent news, US inflation data reported a hotter-than-expected month, instantly sending the single currency lower and dollar higher. In spite of this the pair was unable to hold its bearish tone, and reversed immediate losses in a matter of minutes from just ahead of August’s opening level pegged at 1.1830.
For those who follow our analysis regularly you may recall that 1.1830 was labeled a high-probability buy zone on Thursday. Not only is the number positioned a few pips above daily demand at 1.1739-1.1823, it also converged with a H4 AB=CD bullish formation (see black arrows). Well done to anyone who managed to get on board this move – we unfortunately missed it since 1.1830 was never filled.
Technically speaking, we believe the recent upside move is likely due to weekly buyers flooding the market from support at 1.1871, and dollar sellers chomping lower from weekly resistance at 11854.
Suggestions: Near-term action shows H4 price trading marginally above September’s opening line at 1.1913. While this potentially clears upside to at least the mid-level resistance 1.1950, traders may want to note that USDX H4 candles are trading from demand (a push higher from here could send the EUR lower). Overall however, we still feel upside is the more likely route given the technicals on the EUR along with its underlying trend. Be that as it may, longing this market with 1.1950 so close is not something our team is willing to commit to at this time.
Data points to consider: US Retail sales figures at 1.30pm; US Prelim UoM Consumer report at 3pm GMT+1.
Levels to watch/live orders:
- Buys: Flat (stop loss: N/A).
- Sells: Flat (stop loss: N/A).
GBP/USD:
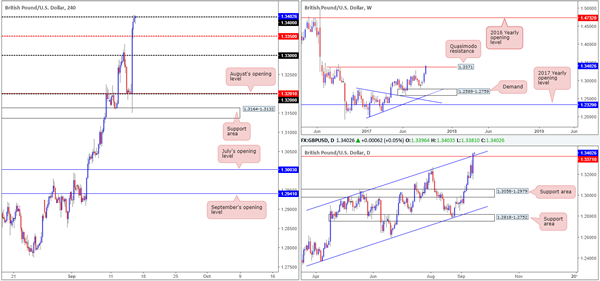
The British pound launched itself north after the Bank of England gestured it could hike interest rates sooner than planned. Whipsawing through the 1.32 handle and bringing in the H4 support area at 1.3164-1.3132, the pair advanced more than 200 pips on the day, closing just ahead of the 1.34 handle.
While every man and his dog are now long GBP, it might be worth noting where the unit is trading over on the bigger picture. The weekly timeframe highlights the Quasimodo resistance at 1.3371. Although price has peeked above this number, it’d be unwise to count this area out as the major has yet to engulf its apex at 1.3445. Along similar lines, daily price shows the candles marginally breached a channel resistance extended from the high 1.2965. Again though, we feel it unwise to count this ascending resistance out just yet. Conversely however, the USDX is seen trading from a weekly resistance line at 11854, thus adding to the possibility of further upside being seen on the GBP.
Suggestions: Admittedly, the bulls certainly have an edge this morning where fundamentals are concerned. However, we cannot ignore the pair’s technical position, which leaves us little choice but to remain flat at this time.
Data points to consider: MPC Member Vlieghe speaks at 9.50am. US Retail sales figures at 1.30pm; US Prelim UoM Consumer report at 3pm GMT+1.
Levels to watch/live orders:
- Buys: Flat (stop loss: N/A).
- Sells: Flat (stop loss: N/A).
AUD/USD
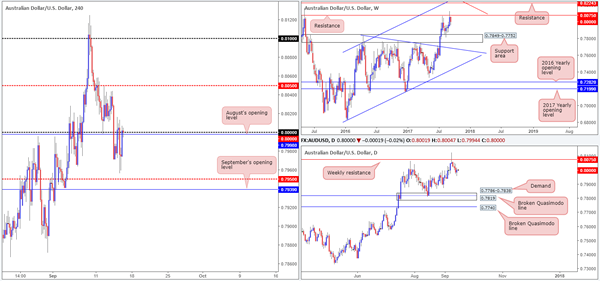
In early trading, upbeat Aussie employment figures saw the commodity currency take off north and crunch its way through the key 0.80 level. Shortly after, however, price began paring gains on weaker Chinese data. Despite all of this, the pair ended the day closing in the green, breaking a three-day bearish phase.
On the whole, the market remains entrenched within a relatively strong uptrend, but has recently begun stalling at weekly resistance carved from 0.8075. Should the sellers move it up a gear from here, the next downside target does not come into view until we reach the weekly support area fixed at 0.7849-0.7752.
Suggestions: As of current price, we can see the H4 candles trading marginally above the 0.80 handle. In such a strong trending environment, this would typically be considered a bullish sign. But, considering weekly price is having a hard time mustering enough strength to breach weekly resistance at the moment; it might not be the best of times to long the Aussie. That is unless you fancy a possible drawdown of around 150 pips down to the noted weekly support area!
Data points to consider: US Retail sales figures at 1.30pm; US Prelim UoM Consumer report at 3pm GMT+1.
Levels to watch/live orders:
- Buys: Flat (stop loss: N/A).
- Sells: Flat (stop loss: N/A).
USD/JPY
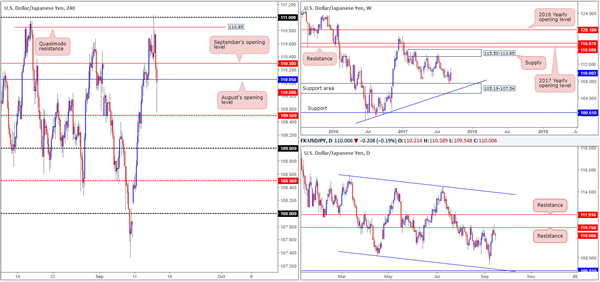
US inflation data came in better than expected on Thursday, consequently forcing the H4 candles to whipsaw through the Quasimodo resistance at 110.85 and bring the 111 handle into the picture. This – coupled with daily resistance plotted at 110.76 was enough to bring the unit lower during the later hours of NY.
Given how well the daily resistance held during the month of August, the unit could possibly see further selling. While this may be true, weekly buyers may have something to say about that as price is seen bolstered from a support area coming in at 105.19-107.54.
Suggestions: To be completely honest, this, like the three other majors analyzed above, are tricky markets to trade at the moment. A short would have you going up against possible weekly buying, and a long places you in direct conflict with daily sellers! Alongside this, there is really not anything tasty cooking on the H4 chart at the moment. With that being said, we will continue to remain flat and look to reassess structure going into Monday’s open.
Data points to consider: US Retail sales figures at 1.30pm; US Prelim UoM Consumer report at 3pm GMT+1.
Levels to watch/live orders:
- Buys: Flat (stop loss: N/A).
- Sells: Flat (stop loss: N/A).
USD/CAD
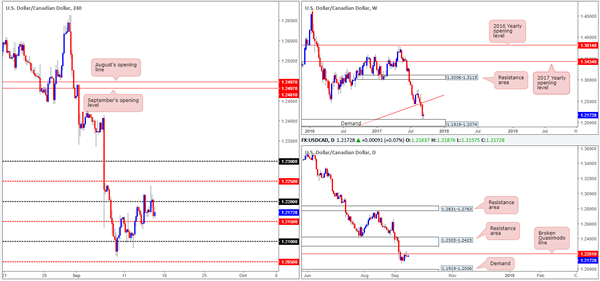
Weekly buyers, as you can see, remain undecided after crossing swords with demand at 1.1919-1.2074. This is likely due to two things: the strong downtrend this pair has been in since May and daily price finding a pocket of offers around the broken Quasimodo line at 1.2201 (notice the bearish pin bar formed from here yesterday).
Across on the H4 timeframe, price failed to sustain gains beyond the 1.22 handle despite upbeat US inflation. Given the weakness seen around weekly demand at the moment and USDX weekly price trading from resistance at 11854, a H4 close beyond the mid-level support at 1.2150 would be interesting.
Suggestions: A H4 close below 1.2150 will, in our view, help confirm bull weakness at the current weekly demand, and at the same time demonstrate bearish intent from the daily broken Quasimodo resistance. A retest at 1.2150, coupled with a lower-timeframe sell signal (see the top of this report), would be sufficient enough to trade short, targeting 1.21 as an INITIAL take-profit zone. Ultimately though, we would be aiming for the daily demand drawn from 1.1919-1.2006.
Data points to consider: US Retail sales figures at 1.30pm; US Prelim UoM Consumer report at 3pm GMT+1.
Levels to watch/live orders:
- Buys: Flat (stop loss: N/A).
- Sells: Watch for H4 price to engulf 1.2150 and then look to trade any retest seen thereafter ([waiting for a lower-timeframe sell signal to form following the retest is advised] stop loss: dependent on where one confirms this level).
USD/CHF
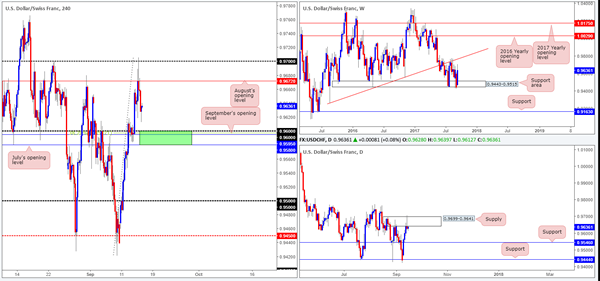
During the course of yesterday’s sessions H4 price sliced through August’s opening level at 0.9672, and brought in the 0.97 handle. The move, influenced by optimistic US inflation figures, failed to generate much follow-through action beyond the 0.97 mark, thus forcing the pair lower on the day.
From the weekly timeframe, price continues to reflect a strong bullish stance after shaking hands with the support area seen at 0.9443-0.9515. Despite room being seen for the bulls to extend gains here, the weekly USDX chart shows price selling off from resistance at 11854.
Turning our attention to the daily timeframe, recent movement chalked up a nice-looking bearish pin bar around supply penciled in at 0.9699-0.9641. In the event that this candle formation is respected, a push back down to support at 0.9546 could be on the cards.
Suggestions: We really like the look of the green H4 zone for potential longs. Comprised of both July and September’s opening levels at 0.9580/0.9595, a round number 0.96 and a 38.2% Fib support taken from the low 0.9420, this has the makings of a reasonably decent area. A long from here, however, should only be considered if, and only if, there’s additional candle confirmation seen. The reason for this is simply because by entering long from here you are effectively going up against daily sellers from supply and possibly weekly USDX sellers from resistance mentioned above at 11854. Assuming there is no H4 supplies formed on approach, our first port of call, should a trade from 0.9580/0.96 come to fruition, would be August’s opening level.
Data points to consider: US Retail sales figures at 1.30pm; US Prelim UoM Consumer report at 3pm GMT+1.
Levels to watch/live orders:
- Buys: 0.9580/0.96 ([waiting for a H4 bullish candle to form – preferably in the shape of a full, or near full-bodied candle – is advised] stop loss: ideally beyond the candle’s tail).
- Sells: Flat (stop loss: N/A).
DOW 30
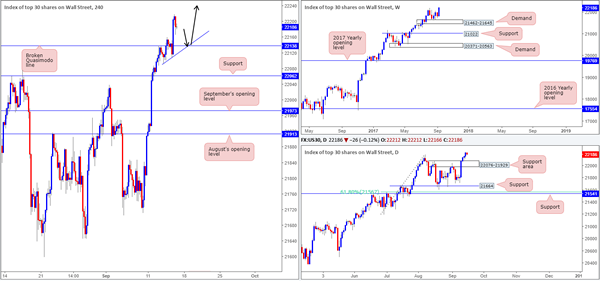
US equities surged to a record high of 22218 on Thursday amid US trading. In recent hours, nevertheless, gains have mildly been pared bringing the unit down to a low of 22166. With this recent movement in mind, we feel stocks are a good buy at this time, at least from a technical standpoint. An ideal buy zone, for us, would be the H4 broken Quasimodo line at 22138, which happens to be joined together with a minor H4 trendline support etched from the low 22092.
Suggestions: To help avoid being whipsawed out of a trade from 22138 we would strongly recommend waiting for additional confirmation to prove that there is buyer intent present. Similar to yesterday’s trade call from 22138, the beautiful thing about this setup is that there is effectively no clear take-profit target, meaning that we could potentially join, what seems to be, a never-ending bull run.
Data points to consider: US Retail sales figures at 1.30pm; US Prelim UoM Consumer report at 3pm GMT+1.
Levels to watch/live orders:
- Buys: 22138 region ([waiting for a reasonably sized H4 bullish candle to form – preferably a full, or near-full-bodied candle – is advised] stop loss: ideally beyond the candle’s tail).
- Sells: Flat (stop loss: N/A).
GOLD
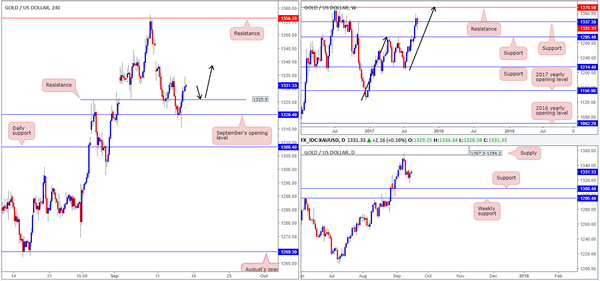
With weekly candles seen trading back below USDX resistance at 11854, it was no surprise to see the H4 gold candles extend higher and crush offers at resistance drawn from 1325.9 (now acting support). With this in mind, we are now looking at the possibility of a long trade on any retest seen at 1325.9 today. However, as discussed in Thursday’s report this does not come without risk. Not only do we have weekly price trading below support at 1337.3, we also see little support on the daily timeframe until reaching the 1308.4 mark.
Suggestions: In light of the recent advance, our analysis is simple. Look to trade any retest seen from 1325.9 IF H4 price prints a reasonably sized bull candle, preferably in the shape of a full, or near-full-bodied formation. Should the trade come to realization, we do not see much upside resistance until the underside of daily supply at 1354.2.
Levels to watch/live orders:
- Buys: 1325.9 region ([waiting for a reasonably sized H4 bullish candle to form – preferably a full, or near-full-bodied candle – is advised] stop loss: ideally beyond the candle’s tail).
- Sells: Flat (stop loss: N/A).


