
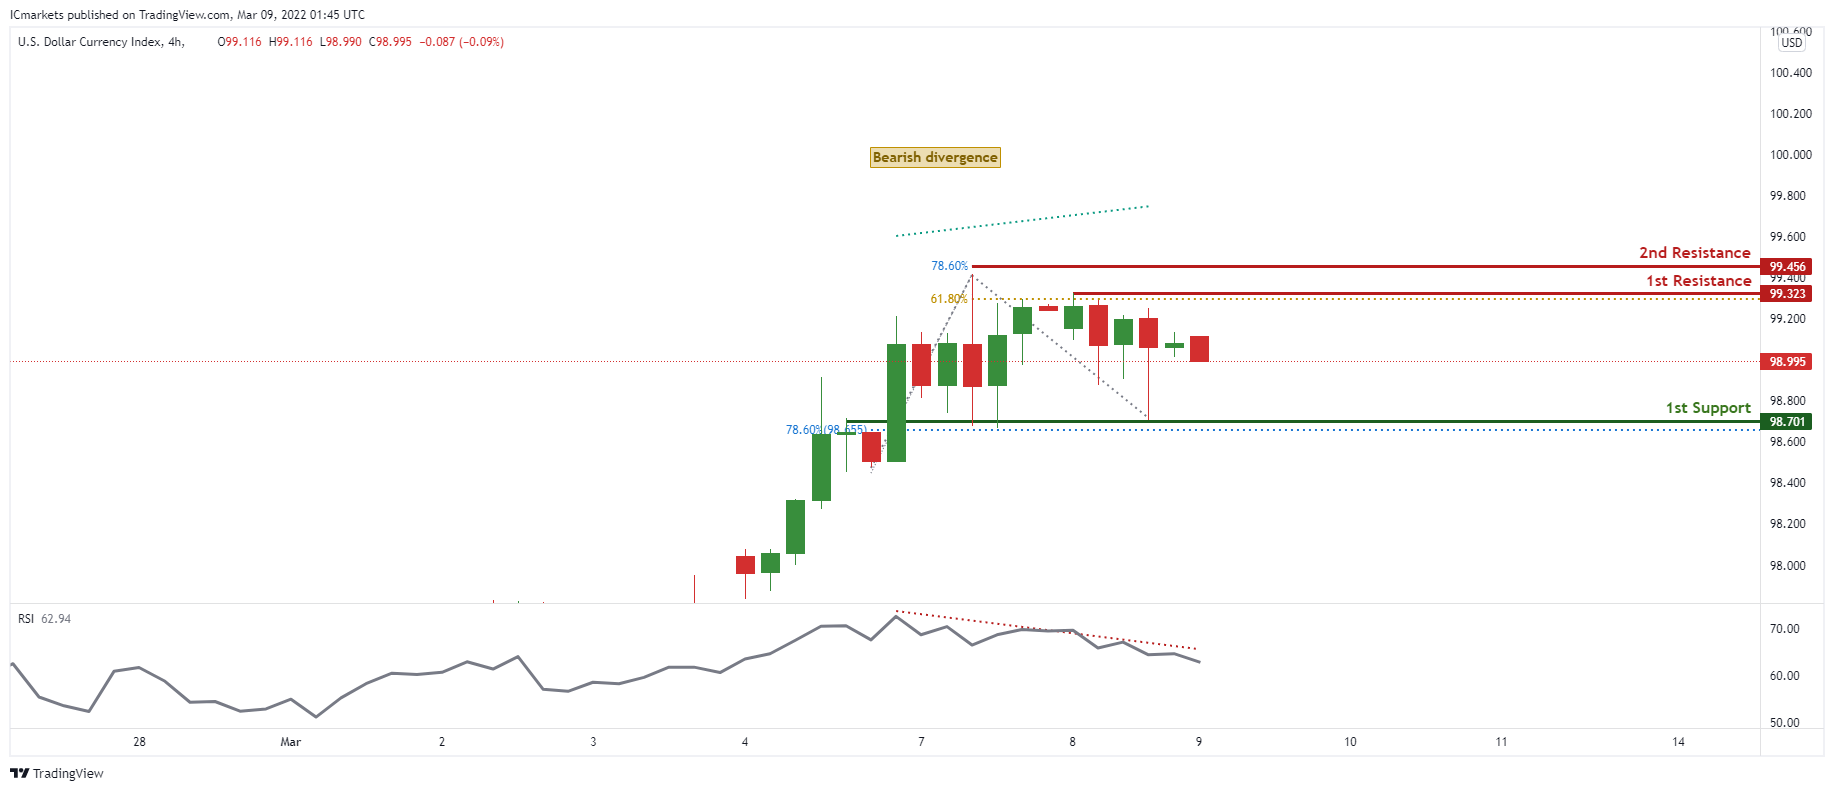
DXY:
On the H4 timeframe, prices are at a recent high and approaching our pivot. We see the potential for a pullback from our 1st resistance at 99.323 in line with 61.9% Fibonacci projection towards our 1st support at 98.701 in line with 78.6% Fibonacci retracement. RSI is portraying bearish momentum, further supporting our bearish bias.
Areas of consideration:
- H4 time frame, 1st resistance at 99.323
- H4 time frame, 1st support at 98.701
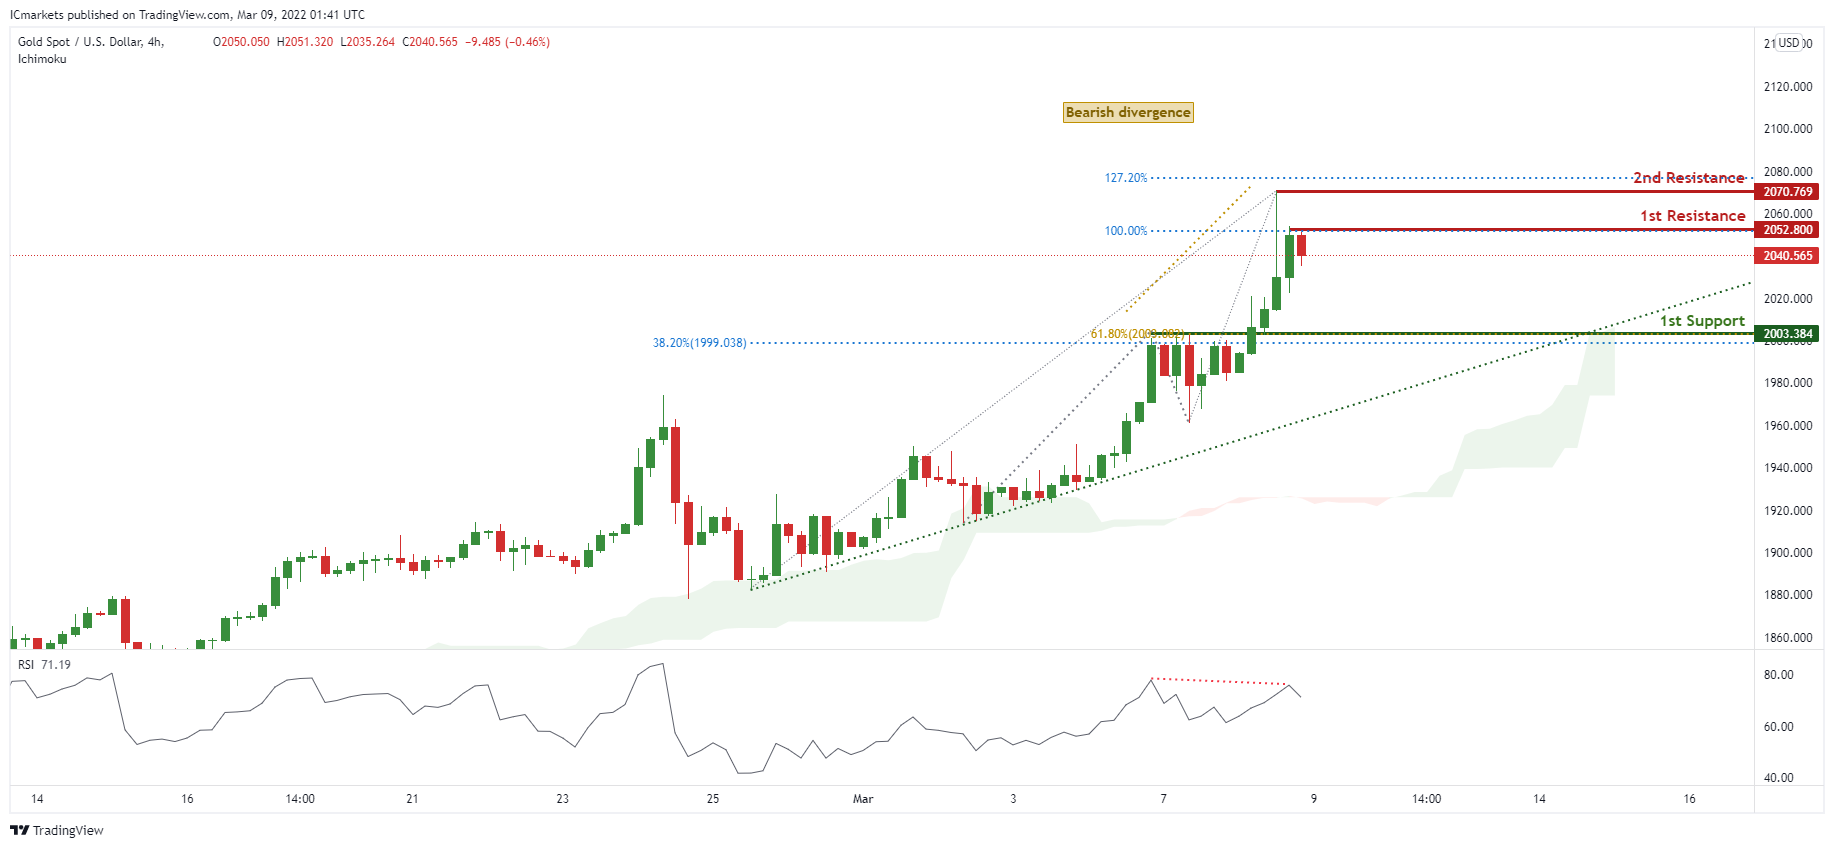
XAU/USD (GOLD):
On the H4 chart, prices are on strong bullish momentum and abiding to our ascending trendline support. We see potential for a short pullback from our 1st resistance at 2052.800 in line with 100% Fibonacci extension towards our 1st support at 2003.384 in line with 38.2% Fibonacci retracement and 61.8% Fibonacci retracement. Divergence is spotted on RSI, further supporting our bearish bias.
Areas of consideration:
- 4h 1st support at 2003.384
- 4h 1st resistance at 2052.800
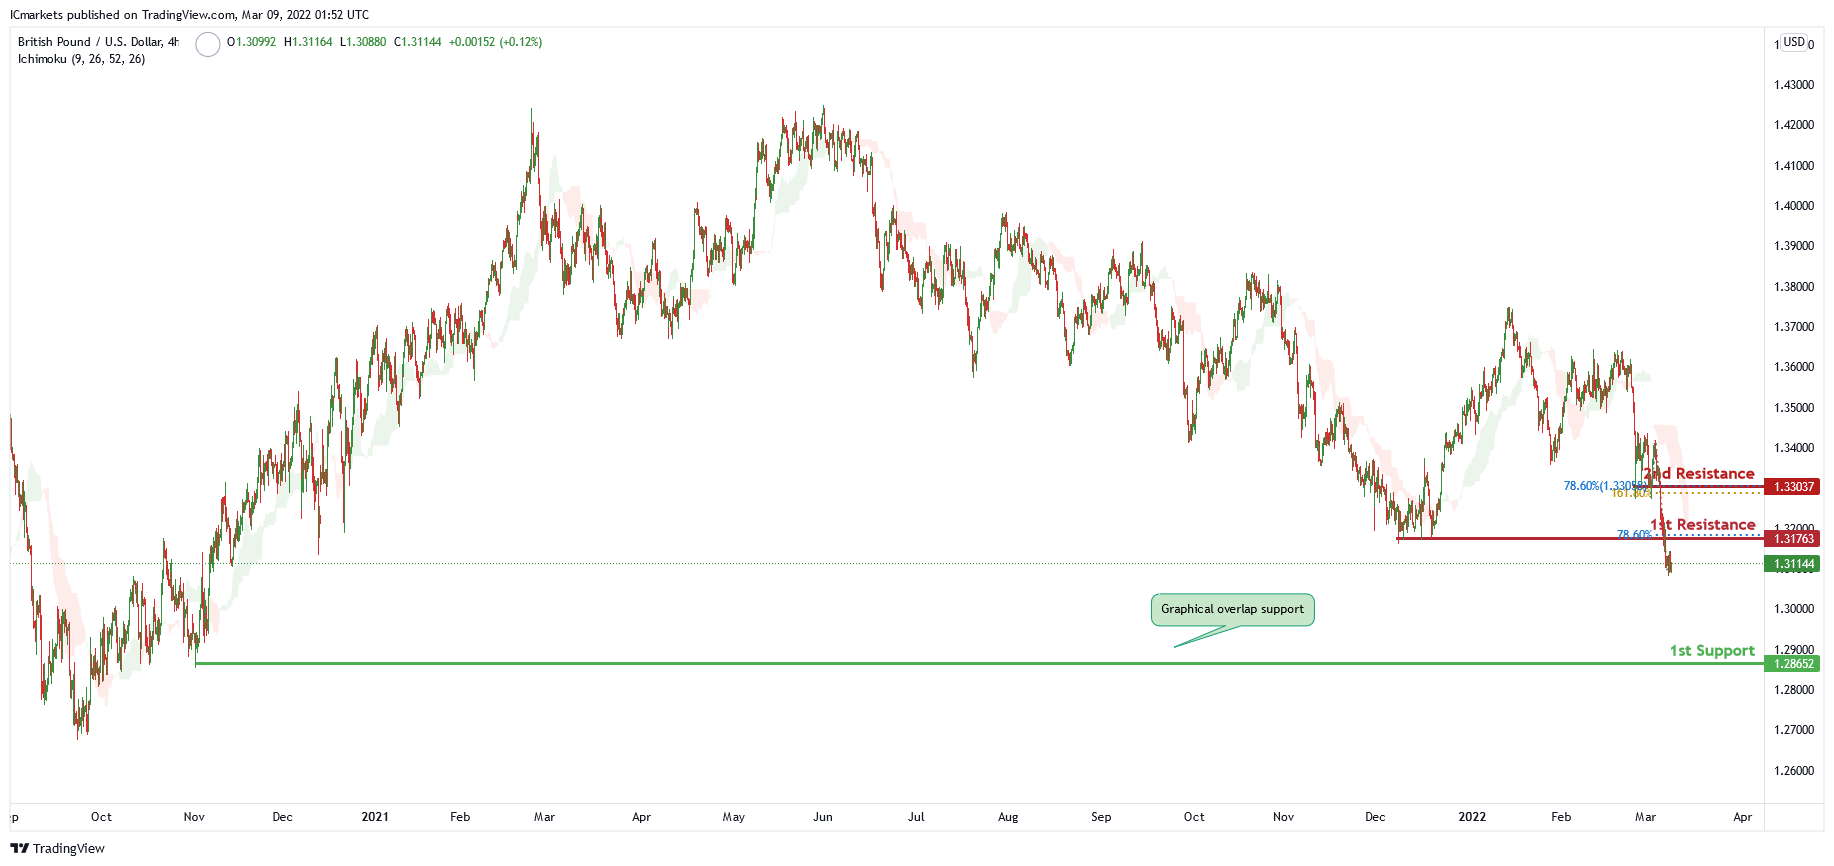
GBP/USD
On the H4 chart price has recently broken the 1st resistance level of 1.31763 in line with 78.6% Fibonacci retracement. Price can potentially dip to the 1st support level of 1.28652 in line which is also the graphical overlap support. Our bearish bias is supported by the ichimoku cloud indicator as price is trading under it.
Areas of consideration
- H4 1st resistance at 1.31763
- H4 1st support at 1.28652
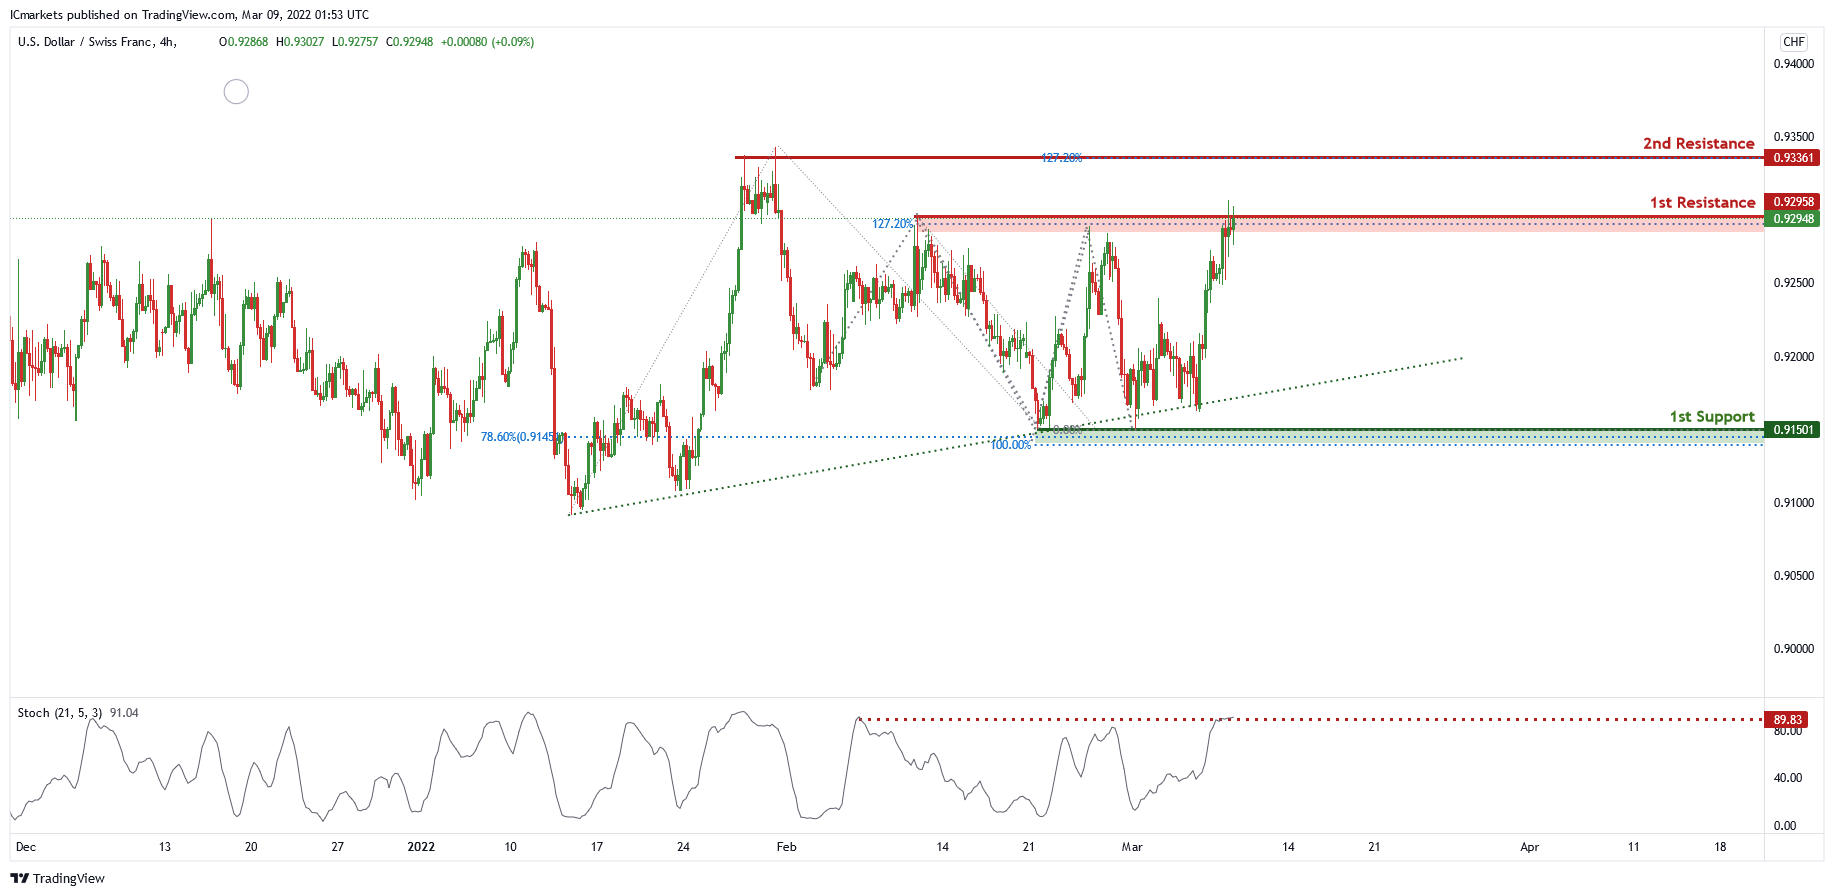
USD/CHF:
On the H4, price is abiding by an ascending trendline and near 1st resistance level of 0.92833 in line with 127.2% Fibonacci projection . Price can potentially dip to the 1st support level of 0.91501 in line with 100% Fibonacci projection and 78.6% Fibonacci retracement. Our bearish bias is supported by a stochastic indicator as it is near the resistance level.
Areas of consideration
- 1st resistance level at 0.92833
- 1st support level at 0.91501
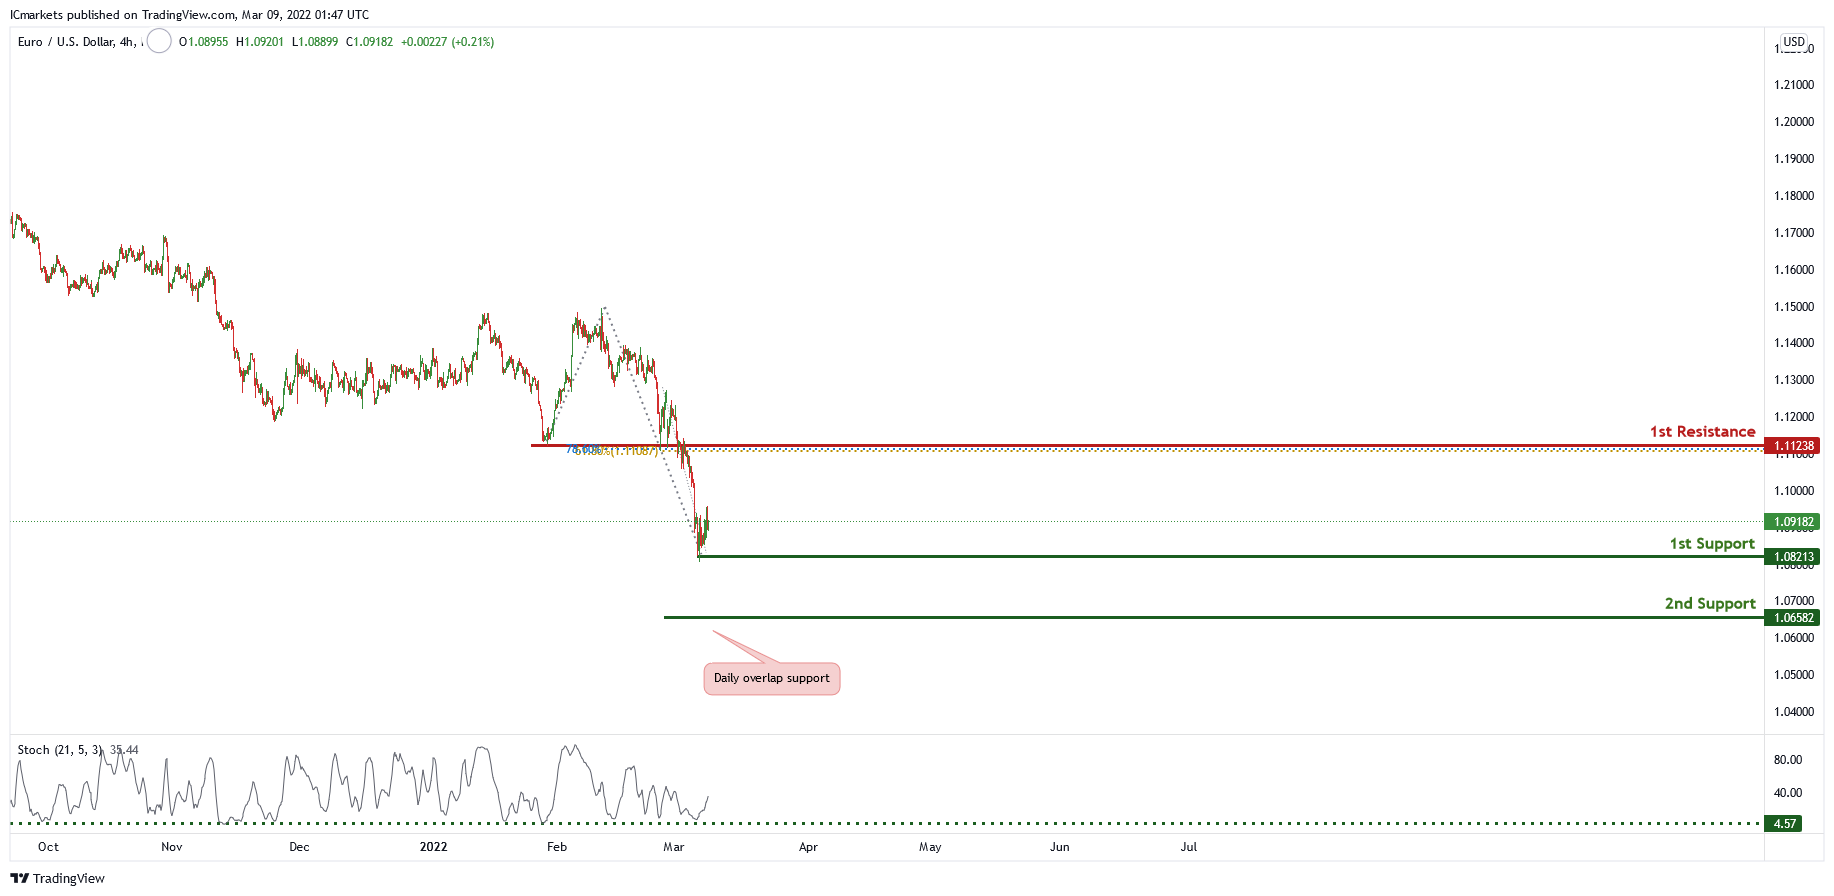
EUR/USD :
On the H4 chart price is near 1st support level of 1.07828 in which is also the graphical swing low . Price can potentially bounce from this support level to 1st resistance of 1.11241 in line with 78.6% Fibonacci projection and 61.8% Fibonacci retracement. Our bullish bias is supported by the stochastic indicator as it is at support level.
Areas of consideration :
- H4 1st resistance at 1.11238
- H4 1st support at 1.08213
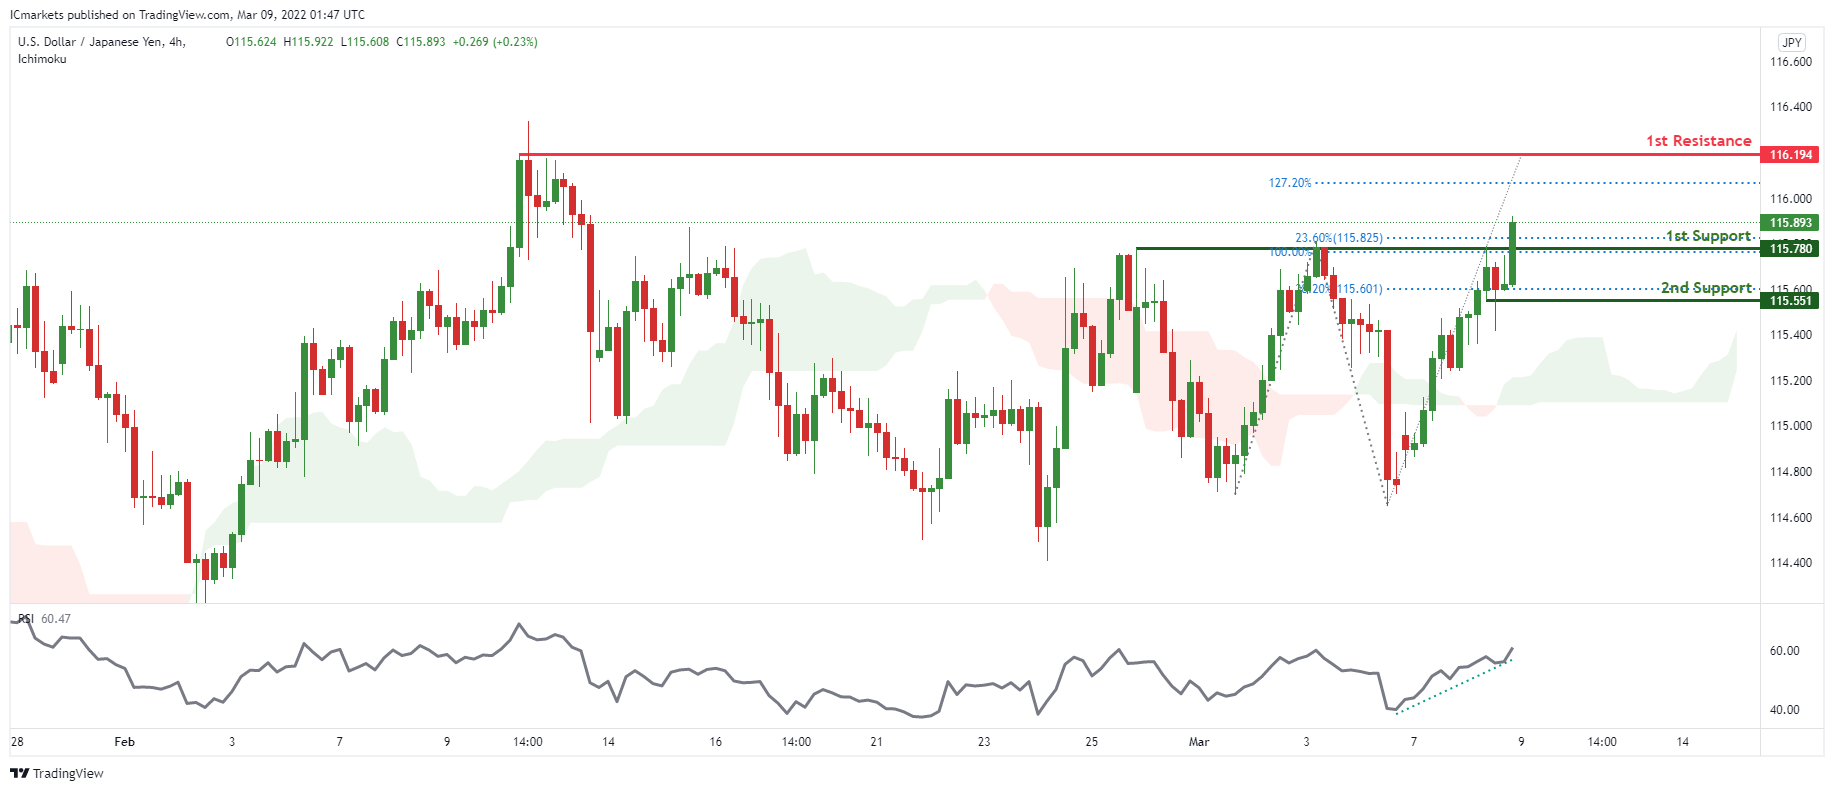
USD/JPY:
On the H4 timeframe, prices are on bullish momentum. We see the potential for further bullish momentum from our 1st support at 115.780 in line with 23.6% Fibonacci retracement and 100% Fibonacci extension towards our 1st resistance at 116.194 in line with 127.2% Fibonacci extension. Our bullish bias is further supported by prices trading above our ichimoku cloud support and also RSI being on bullish momentum. Alternatively, prices may dip towards our 2nd support at 115.551 in line with 38.2% Fibonacci retracement.
Areas of consideration:
- H4 time frame, 1st resistance at 116.194
- H4 time frame, 1st support at 115.780
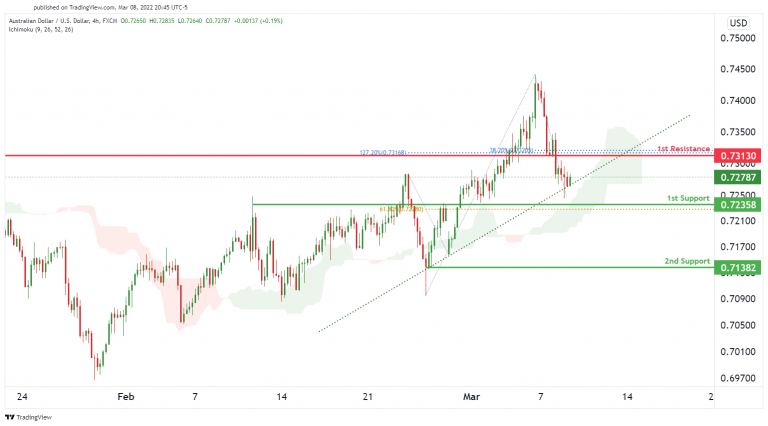
AUD/USD:
On the H4 timeframe, we see the potential for further bullish momentum from our 1st support at 0.72358in line with 61.8% Fibonacci retracement and towards our 1st resistance at 0.73130. which is in line with 127.20% Fibonacci extension and 38.2% Fibonacci retracement. Our bullish bias is further supported by prices trading above the Ichimoku cloud. Alternatively, prices from 1st support might dip to 2nd support at 0.71382with a graphical swing low level.
Areas of consideration :
- H4 1st support at 0.72358
- H4 1st resistance at 0.73130
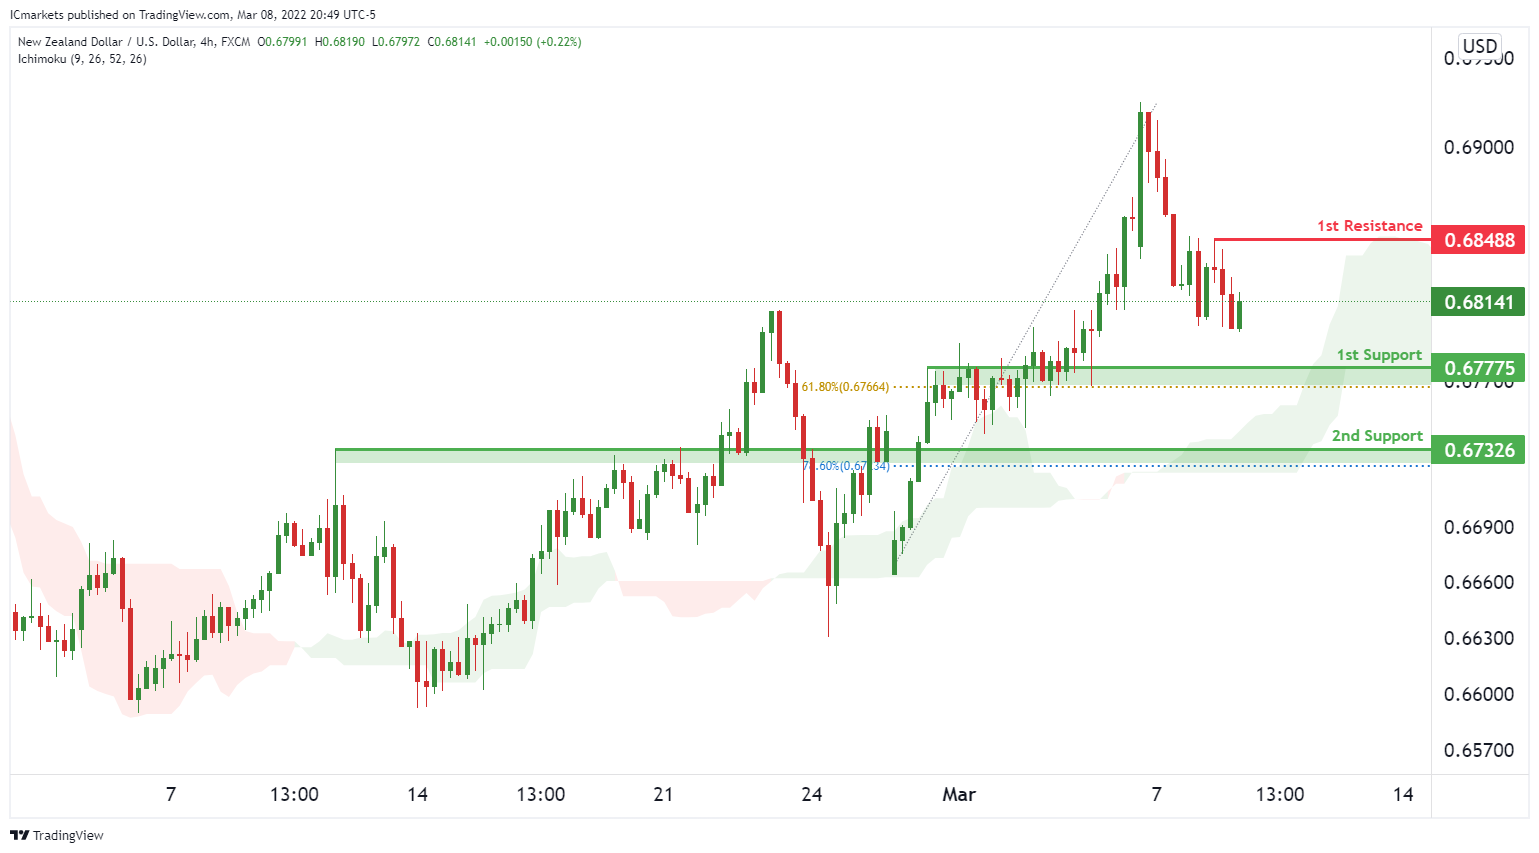
NZD/USD:
On the H4 chart, prices are on bullish momentum. We see the potential for further bullish momentum from our 1st support at 0.67775 in line with 61.8% Fibonacci retracement towards our 1st resistance at 0.68488 with a graphical swing high resistance. Our bullish bias is further supported by prices trading above our ichimoku cloud support. Alternatively, prices may dip towards our 2nd support at 0.67326 in line with 78.6% Fibonacci retracement.
Areas of consideration:
- H4 time frame, 1st resistance at 0.68488
- H4 time frame, 1st support at 0.67775
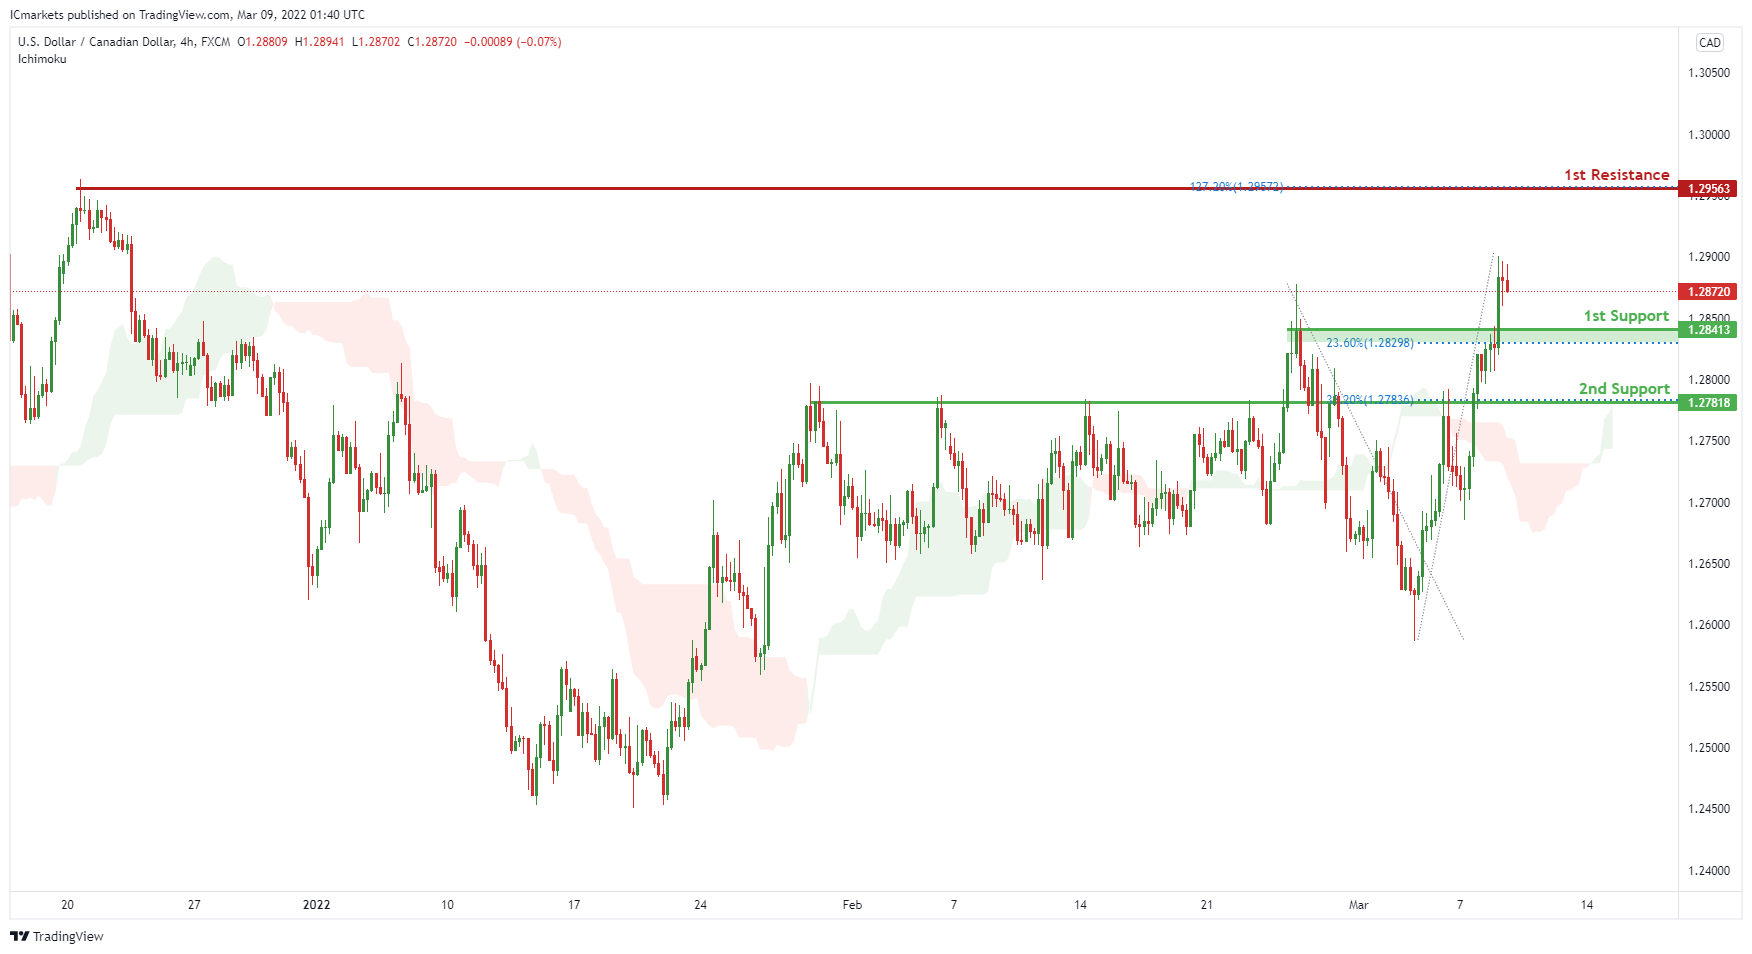
USD/CAD:
On the H4 timeframe, price is near 1st support level of 1.28413 in line with horizontal overlap support and 23.6% Fibonacci retracement. Price can potentially rise to the 1st resistance level of 1.29563 in line with the swing high resistance and 127.2% Fibonacci retracement. Alternatively, price may break 1st support and head for 2nd support at 1.27818 where the 38.2% Fibonacci retracement is. Our bullsh bias is supported by how price is moving above the ichimoku cloud.
Areas of consideration:
- H4 time frame, 1st support at 1.28413
- H4 time frame, 1st resistance at 1.29563
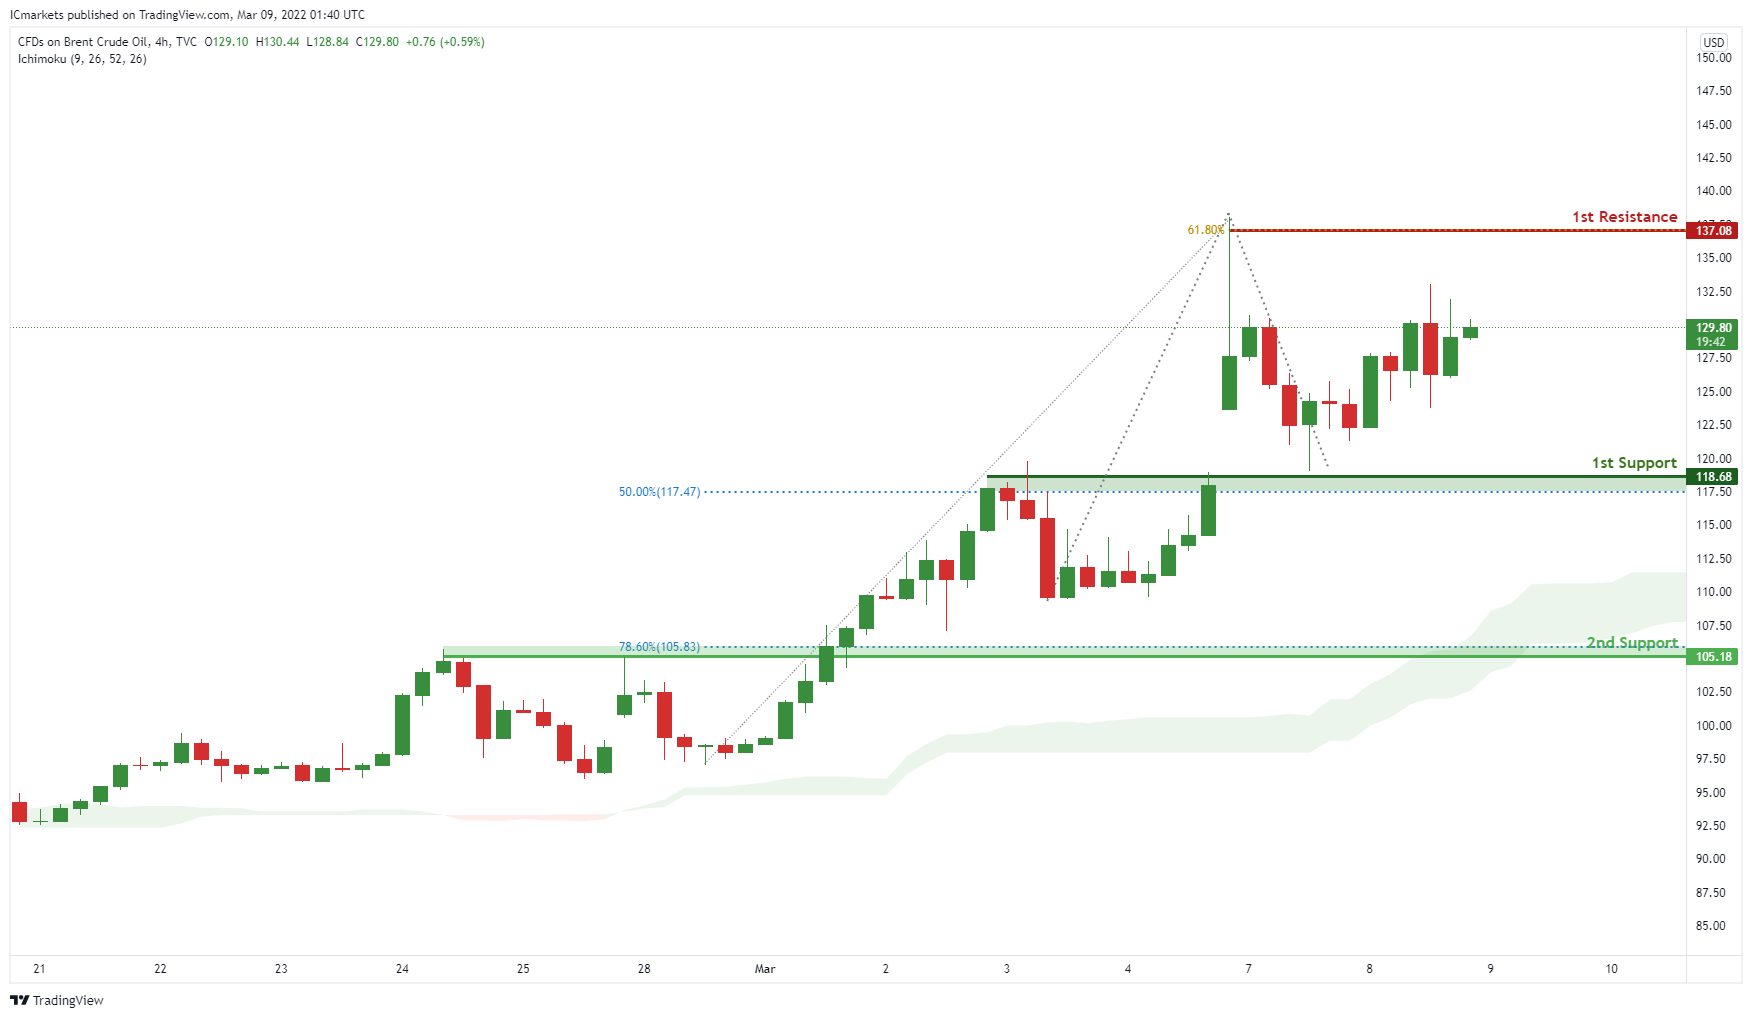
OIL:
On the H4 timeframe, price is near 1st support level of 118.68 in line with horizontal overlap support and 50% Fibonacci retracement. Price can potentially rise to the 1st resistance level of 137.08 in line with the swing high resistance. Alternatively, price may break 1st support and head for 2nd support at 105.18 where the 61.8% Fibonacci retracement is. Our bullsh bias is supported by how price is moving above the ichimoku cloud.
Areas of consideration:
- H4 time frame, 1st resistance of 137.08
- H4 time frame, 1st support of 118.68
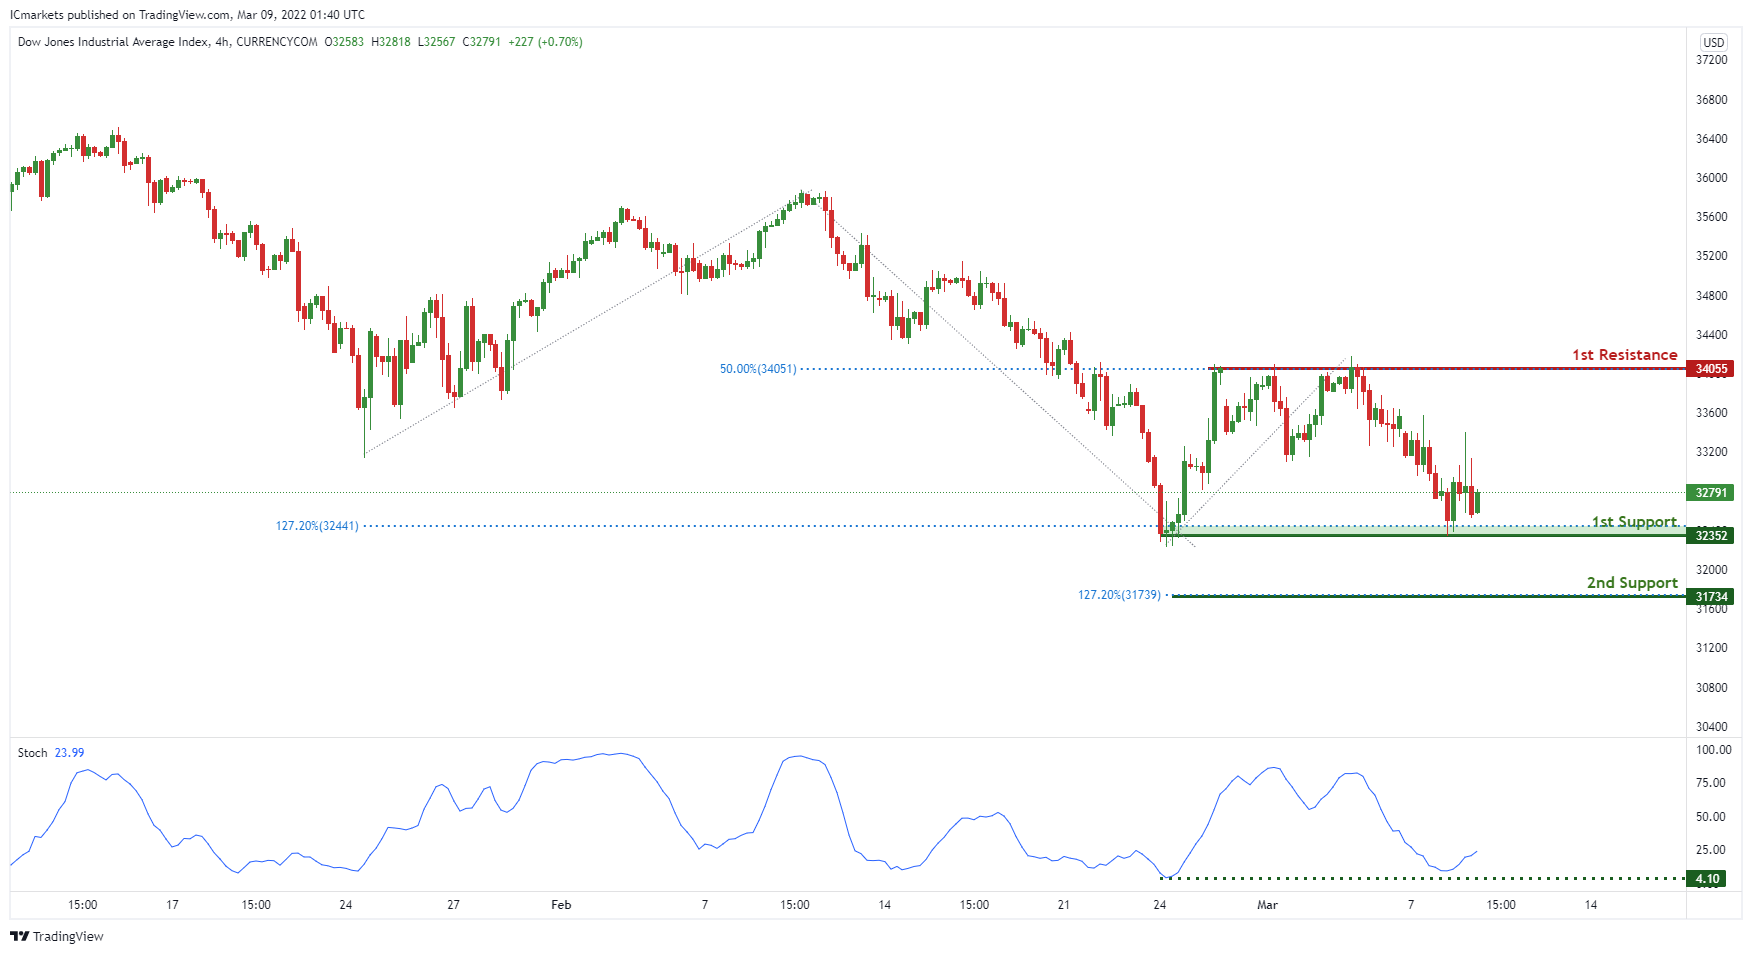
Dow Jones Industrial Average:
On the H4 timeframe, price is near 1st support level of 32352 in line with horizontal swing low support and 127.2% Fibonacci extension. Price can potentially rise to the 1st resistance level of 34055 in line with the swing high resistance and 50% Fibonacci retracement. Alternatively, price may break 1st support and head for 2nd support at 31734 where the127.2% Fibonacci extension is. Our bullsh bias is supported by how price is expected to bounce off the stochastics indicator.
Areas of consideration :
- H4 1st support at 32352
- H4 1st resistance at 34055


