EUR/USD
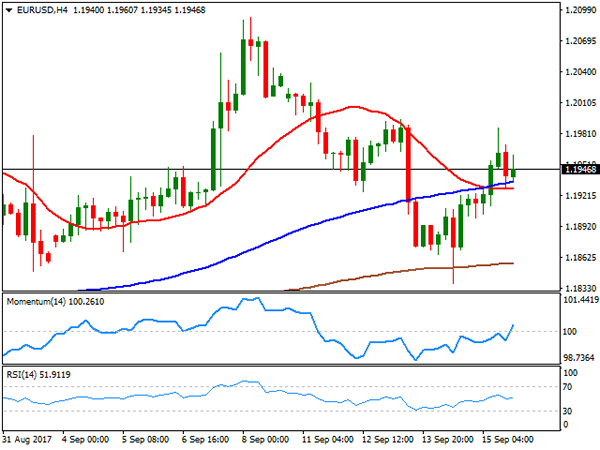
Despite advancing for a second consecutive day on Friday, the EUR/USD pair closed the week in the red at 1.1946. Friday’s advance was backed by soft US data, as August Retail Sales fell by 0.2% from a month earlier, which additionally suffered downside revisions. In the same month, Industrial Production fell by 0.9% while Capacity Utilization edged lower, to 76.1%. The pair eased from Friday’s high at the end of the day, as the Michigan consumer sentiment index for September beat expectations, coming in at 95.3, still below August reading of 96.8.
All through the week, attempts to regain the 1.2000 level failed, rather on upward exhaustion than on self dollar’s strength. The greenback can’t find its way higher, although some light have appeared at the end of the tunnel, as mid-week, the Trump administration hinted it will start working on the tax reform before the month end. Wall Street rallied to record highs on the news, but the dollar remained subdued. Anyway, the market is now focused on the upcoming Fed’s monetary policy decision this Wednesday. The Central Bank is expected to keep rates unchanged, but also to announce details on their plan to reduce the balance sheet. Additionally, the dot-plot will give some hints on how policymakers are positioned towards next rate hikes.
The pair consolidated near 2017 highs for a second consecutive week, settling above a bullish 20 DMA in the daily chart, and with technical indicators having regained the upside, limiting the risk of a deeper correction ahead that anyway will depend on market’s reaction to Fed’s decision. A long term ascendant trend line coming from April this year stands for this Monday around 1.1825, whilst August 31st low comes at 1.1822, making of the region a key support for the upcoming days, as below it, the pair could extend its slide down to 1.1667, the low set on August 17th. Short term, the 4 hours chart shows that the price has managed to recover above its 20 and 100 SMAs that anyway converge within a tight range, around 1.1910, whilst technical indicators have reentered positive territory by the end of the week, but lack enough momentum to support a new leg north.
Support levels: 1.1920 1.1860 1.1825
Resistance levels: 1.1965 1.2000 1.2045
USD/JPY
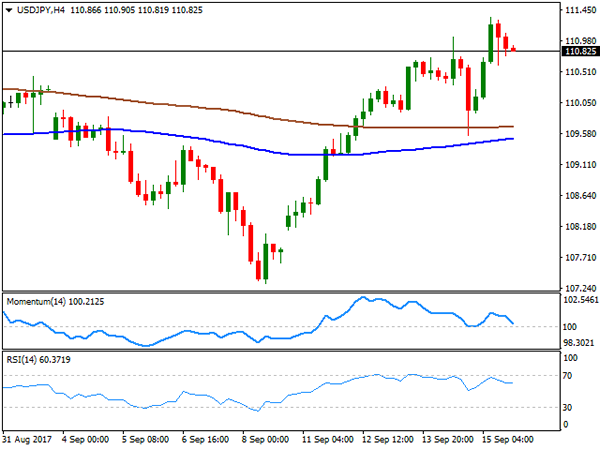
The USD/JPY pair had a rough week, but closed at its highest since late July, at 110.82, quickly reverting a slide down to 109.54 late Thursday, the result of another missile test from North Korea which spurred demand for safe-haven assets. However, the market is paying less attention to this kind of events lately, and the pair quickly recovered its previous upward strength. Also, the negative sentiment was offset by US Treasury yields which traded steady around their previous daily closes. The yield on the benchmark 10-year Treasury note stood at 2.20%, while the yield on the 30-year Treasury bond ticked lower to 2.77% from previous 2.78%. The pair posted a 7-week high on Friday of 111.33, but the daily chart shows that it was unable to sustain gains beyond the 100 DMA, settling around it. Furthermore, the same chart shows that the 200 DMA comes at 111.50, the level to break for a following bullish extension. The daily Momentum heads nowhere around its 100 level, but the RSI aims higher around 57, leaning the scale towards the upside. In the 4 hours chart, technical indicators present clear bearish divergences form price action, posting lower lows as the price advances since mid week, but still above their mid-lines, which limits the case for a steeper downward move. The 100 SMA in this last time frame aims modestly higher, still below the 200 SMA, both over 100 pips below the current level.
Support levels: 110.25 109.70 109.35
Resistance levels: 111. 05 111.50 111.90
GBP/USD
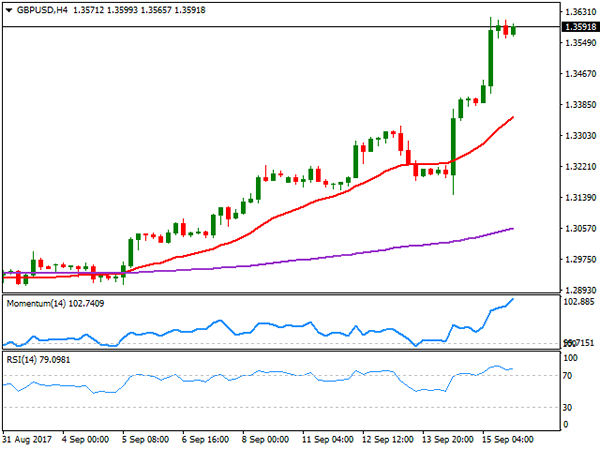
The GBP/USD pair surged to its highest since the Brexit vote back in June last year, hitting 1.3615 and settling not far below it, as hawkish surprises kept coming from MPC members. Following BOE monetary policy announcements on Thursday, in which most policymakers agreed that some withdrawal of monetary stimulus is likely to be appropriate over the coming months, MPC Vlieghe, a well-known dove said on Friday that a rate hike is possible for the coming months, and that more than one hike could be needed. The pair soared with the news, accumulating roughly 470 pips in the last two days of the week, and remained bid after disappointing US macroeconomic figures. Further gains seem likely now that the market is pricing in a rate hike for November, but a downward correction, or at least some consolidation could be expected at the beginning of the week. Technically, daily indicators maintain their strong bullish momentum, despite being in overbought territory, whilst the 20 DMA turned sharply north far below the current level, all of which supports an expected continuation. In the 4 hours chart, technical indicators also head higher within extreme overbought territory as the price develops well above a bullish 20 SMA, this last some 250 pips below the current level.
Support levels: 1.3560 1.3525 1.3480
Resistance levels: 1.3615 1.3650 1.3690
GOLD
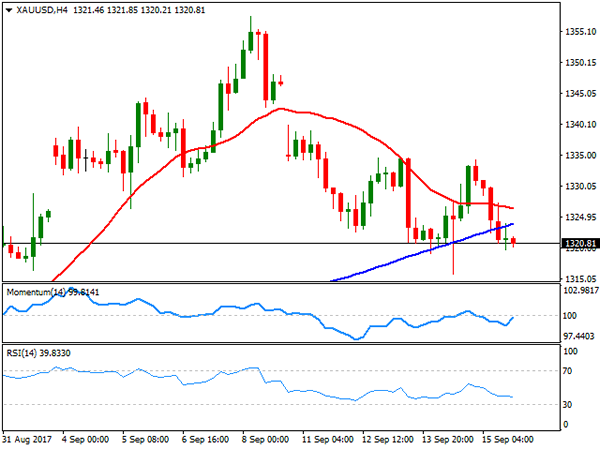
Spot gold posted its lowest settlement for this September on Friday, closing at $1,320.81 a troy ounce, sharply down for the week, undermined by increasing demand for riskier assets, as Wall Street rallied to record highs. Gold prices spiked late Thursday on news North Korea performed another missile test that landed in the Japanese sea, but changed course after London’s opening. One reason of gold’s decline is the upcoming Fed meeting, as despite chances of a rate hike are pretty much null, market expects a hawkish bias through definitions on the reduction of the balance sheet. Technically, the daily chart shows that the price settled slightly below a bullish 20 SMA, whilst technical indicators head sharply lower, dangerously close to their mid-lines, suggesting a bearish extension could be seen on a break below 1.1315,72, the weekly low and the immediate support. In the 4 hours chart, the price settled below its 20 and 100 SMAs, whilst technical indicators hold within bearish territory, also favoring a new leg lower ahead.
Support levels: 1,315.70 1,308.10 1,298.90
Resistance levels: 1,323.95 1,330.40 1,337.80
WTI CRUDE OIL
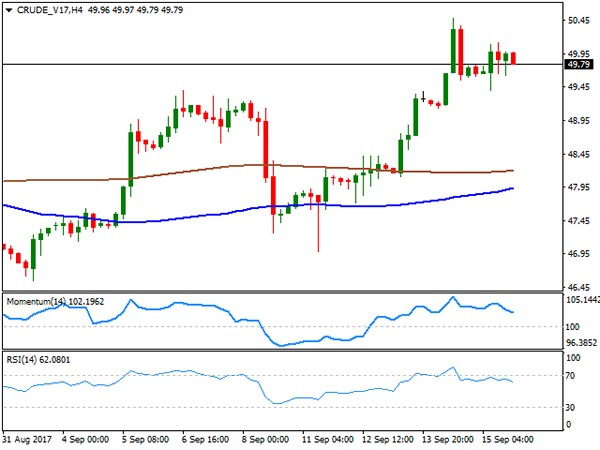
West Texas Intermediate crude futures ended Friday at $49.79 a barrel marginally higher on the day, but sharply up for the week, on a series of positive market news. Mid week, the International Energy Agency said that oil’s glut was shrinking amid strong demand from Europe and the US, coupled with production declines from OPEC. Additionally, the OPEC’s forecast indicated an expected increase in demand for 2018. On Friday, the US Baker Hughes report added to the bullish case, after reporting that active rigs drilling for oil fell by 7 the past week, down to 749 from previous 756. The commodity failed to regain the 50.00 mark earlier on the week, but seems poised to rally beyond it, given that in the daily chart, the price held firmly above its 100 and 200 SMAs, whilst technical indicators maintain their upward strength within positive territory. Shorter term, and according to the 4 hours chart, oil may correct lower, as technical indicators are retreating from overbought levels, whilst despite far below the current level, moving averages remain horizontal. In the case of further gains, WTI has a critical resistance around 52.00, and advances up to this last could trigger some strong profit taking, pushing prices down towards the 45.00 price zone.
Support levels: 49.40 48.80 48.25
Resistance levels: 49.90 50.50 51.20
DJIA
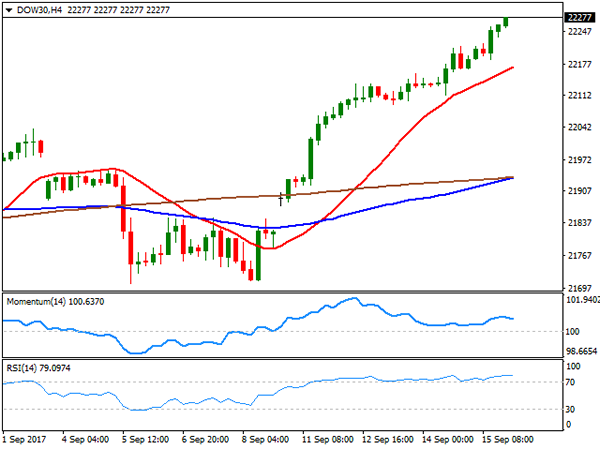
US major indexes closed with gains and at record highs on Friday, backed by solid earnings reports and hopes that the so-long promised US tax reform stands around the corner. The tech sector was the best performer on Friday, with the three major indexes ending the week up over 1.0%. On Friday, the DJIA added 64 points to 22,268.34, the Nasdaq Composite gained 0.30% to 6,448.47, while the S&P advanced 4 points, to 2,500.23. Boeing was the best performer within the DJIA, up 1.54%, while General Electric led decliners with a 1.36% loss. The daily chart shows that technical indicators resumed their advances after a short-lived period of consolidation, entering overbought territory as the index moves further above all of its moving averages, supporting further gains ahead. In the 4 hours chart, technical indicators present modest bearish divergences, with the RSI consolidating around 79 and the Momentum within positive territory, despite the index keeps posting higher highs, a first sign of warning over a possible downward corrective movement, whilst the benchmark remains far above all of its moving averages, with the 20 SMA providing an immediate support at 22,172.
Support levels: 22,236 22,196 22,162
Resistance levels: 22,300 22,345 22,390
FTSE100
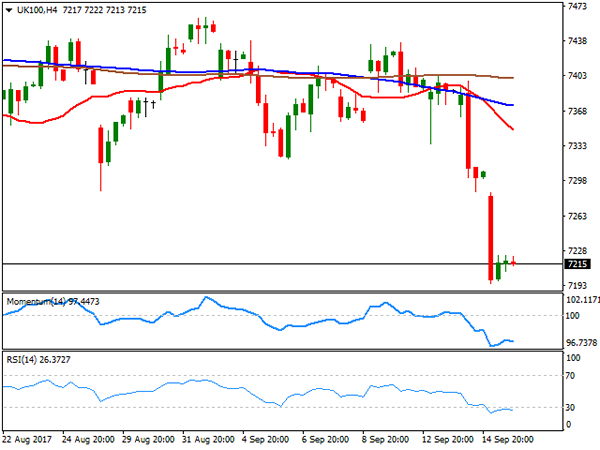
FTSE 100’s decline continued on Friday, with the index finishing the week at levels last seen in April, down on Friday 79 points or 1.10%, to 7,215.47. Strength in the Pound, which rallied to its highest since the Brexit referendum outcome late June 2016, weighed on the index, as most companies listed make the most of their gains abroad. Only 17 members managed to gain ground, led by Imperial Brands that added 2.05%, and followed by ITV which gained 1.41%. Carnival, on the other hand, was the worst performer, down 6.22%, followed by Provident Financial that shed 4.28%. The index heads into the next weekly opening with a strong bearish momentum according to technical readings in the daily chart, as technical indicators maintain their sharp bearish slopes, nearing oversold territory, whilst the 20 DMA is finally detaching from the 100 DMA, both anyway far above the current level. In the 4 hours chart, technical readings also favor a new leg lower ahead, as technical indicators resumed their declines within oversold territory, and after a limited upward corrective movement, whilst the index has settled far below all of its moving averages.
Support levels: 7,197 7,158 7,120
Resistance levels: 7,225 7,264 7,301
DAX
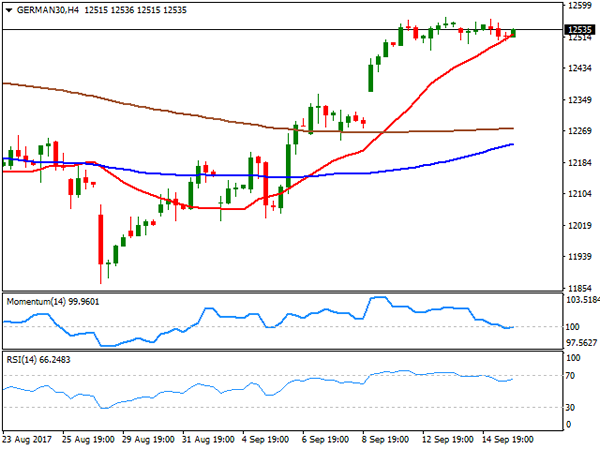
The German DAX lost 21 points to 12,518.81 on Friday, as European indexes were dragged lower by a plummeting FTSE which suffered from a wild Pound’s appreciation. Nevertheless, the index ended the week with strong gains, as risk sentiment receded at the beginning of the week, whilst hopes the US government will finally focus on the growth agenda sent Wall Street to record highs. Within the DAX, Continental was the best performer, up 1.43%, followed by Daimler that added 0.72%. Bayer led decliners, shedding 1.51%, followed by Deutsche Bank that lost 1.04%. The index achieved most of its gains at the beginning of the week, spending the second half of it consolidating, maintaining its bullish stance daily basis, as it settled above all of its moving averages, whilst technical indicators held well above their mid-lines, although with limited upward strength. In the 4 hours chart, the index hovers around a bullish 20 SMA, whilst the Momentum indicator is aiming to recover around neutral territory, and the RSI indicator turns marginally higher around 66, all of which favors a new leg higher on a break above 12,567 the weekly high.
Support levels: 12,489 12,443 12,401
Resistance levels: 12,567 12,603 12,646