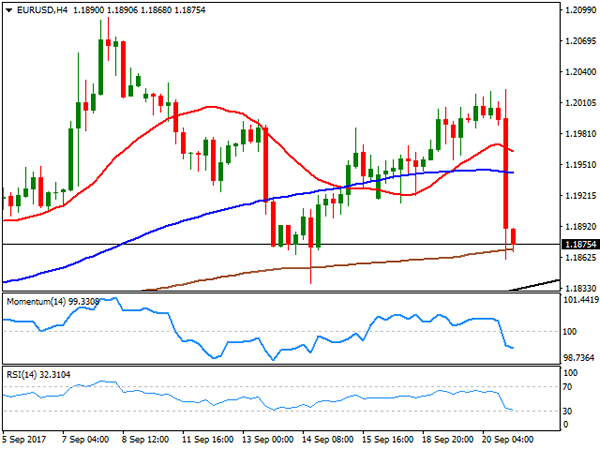
EUR/USD
Having surged to a daily high of 1.2023, the EUR/USD pair fell following Fed’s announcement, seen generally hawkish. Clear indications on how and when they will unwind their balance sheet and three rate hikes still seen for this year, were clearly dollar positive, at least short term. The Central Bank left rates unchanged, as largely expected, but indicated that it will start reducing its $4.5 trillion balance sheet by $10 billion per month, from next October. Also, the dot-plot showed that a third rake hike for this year is still on the table, as 11 of 16 Fed members consider it’s appropriate, with the Fed funds futures now suggesting a 72% chance of at least one more rate increase before year-end, up from previous 51%.
The pair fell down to 1.1861, recovering modestly within the Q&A, as Yellen said that falling inflation is somewhat a "mystery." Policymakers downgraded their short-term inflation forecast, lowered to 1.5% from previous 1.7%, for this year, whist growth was revised up, from 2.2% to 2.4%. Yellen has just made the ECB a big favor, as the European Central Bank was unable to fight a rising EUR, but seems possible that the decline extends now on profit taking, particularly considering USD shorts were overcrowded.
Anyway, the pair resumed its decline afterwards, heading into the Asian session at its lowest for the week, and poised to extend its decline towards the critical 1.1820/30 region, in where the pair has bottomed the previous two weeks, also having there a long term ascendant trend line coming from early April low of 1.0603. A break below the level should lead to a steeper decline that can extend during the upcoming sessions down to 1.1661, August 17th low. Technical readings in the 4 hours chart support a downward extension, albeit the price is now unable to break below its 200 SMA, whilst technical indicators partially lost downward momentum, remaining anyway near oversold readings.
Support levels: 1.1860 1.1820 1.1775
Resistance levels: 1.1910 1.1950 1.1995
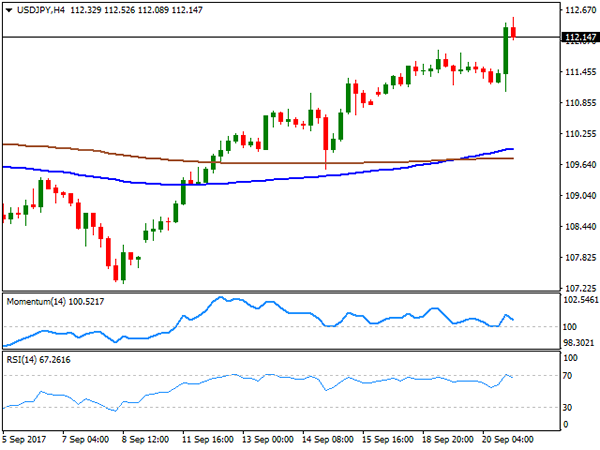
USD/JPY
The USD/JPY pair heads into the Asian session above 112.00, but off the daily high of 112.52 achieved post-Fed, also the highest since mid July. The Japanese yen is down for third consecutive day, underpinned by advancing US Treasury yields, up to their highest in six weeks, on news the US Central Bank will start unwinding its balance sheet, while keeping doors opened for a third rate hike for the year. The 10-year note benchmark settled at 2.28%, up from 2.24%, while the 30-year note yield posted a modest advance, to 2.82% from 2.81%. The Bank of Japan will have its monetary policy meeting during the upcoming Asian session, but is largely anticipated to be a non-event. Japan will also release July’s industrial activity index, expected at -0.1% from previous 0.4%. From a technical point of view, the 4 hours chart maintains the risk towards the upside, despite the late US session pullback, as indicators just retreated from overbought readings, but are far above their mid-lines, whilst the 100 SMA keeps advancing modestly above the 200 SMA, both well below the current level. Tuesday’s high at 111.87 is key, as a break below it will likely anticipate some further slides ahead.
Support levels: 111.90 111.50 111.20
Resistance levels: 112.50 112.85 113.30
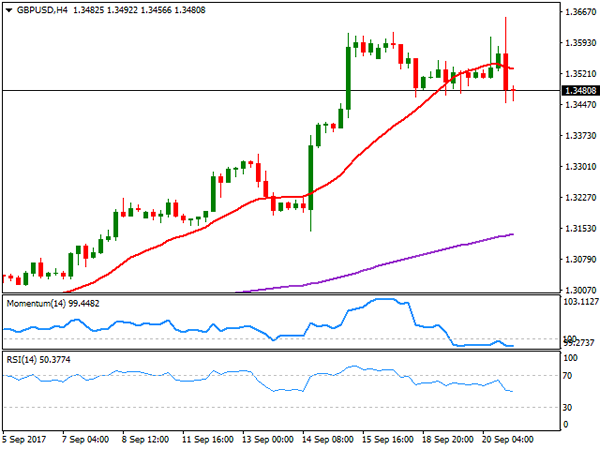
GBP/USD
The GBP/USD pair peaked at 1.3653, its highest since the Brexit referendum following Fed’s initial release, in which it left rates unchanged, but the dollar gained traction on news the US Central Bank will begin unwinding its balance sheet starting next October. The Pound ended the day just 30 pips lower against its American rival, boosted at the beginning of the day by upbeat UK Retail Sales figures for August. Sales increased by 1.0% compared with July, and by 2.4% when compared to a year earlier, more than doubling market’s expectations. The core readings, excluding fuel prices, were also sharply higher, while all July readings were revised modestly higher. The news sent the pair briefly above the 1.3600 level but pulled back ahead of Fed, holding anyway above 1.3500. Anyway, the pair is heading into the Asian opening around 1.3480, having set a low of 1.3451 on dollar’s strength. From a technical point of view, the 4 hours chart shows that the risk has turned towards the downside, as the price is currently below a modestly bearish 20 SMA, whilst the RSI indicator hovers within neutral territory, and the Momentum entered bearish territory, with not enough directional strength at the time being. An extension below 1.3440 is now required to confirm a bearish continuation for this Thursday, with scope then to test the 1.3350/70 region.
Support levels: 1.3440 1.3410 1.3370
Resistance levels: 1.3530 1.3560 1.3595
GOLD
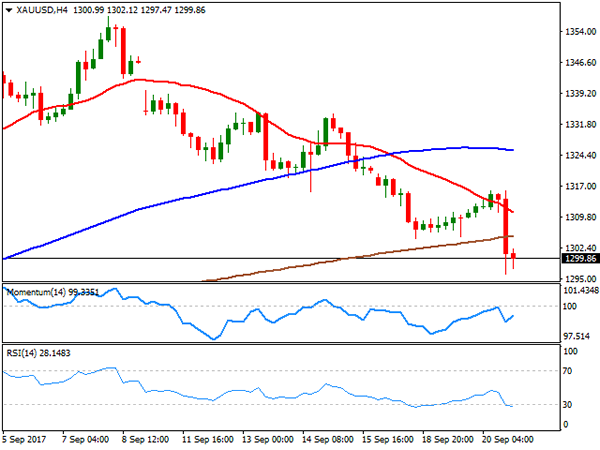
Gold prices fell to fresh September lows, with spot down to $1,295.99 a troy ounce, to settle a few cents below the 1,300.00 mark. News that the US Federal Reserve is still open to raise rates next December, while it will also begin unwinding its balance sheet, dented further demand gold, usually sensitive to higher rates. Moreover, market has shown no signs of worry on the latest verbal menaces between the US and North Korea, limiting the demand for the safe-haven metal. Struggling to regain the 1,300 level, the daily chart for the commodity indicates that the bearish momentum has just accelerated, as the price is well below its 20 SMA, now turning south, whilst technical indicators extended their bearish slopes, now nearing oversold territory. In the 4 hours chart, gold has broken below all of its moving averages, settling below the 200 SMA for the first time since mid July, whilst technical indicators pared losses, but so far posted shallow bounces within negative territory, not enough to confirm an upcoming recovery.
Support levels: 1,296.00 1,288.10 1,280.45
Resistance levels: 1,304.60 1,311.60 1,319.80
WTI CRUDE OIL
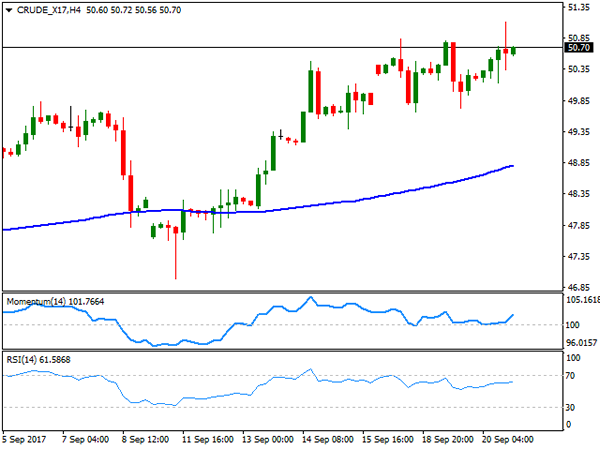
Crude oil prices surged to their highest since last May, as a disappointing EIA report was offset by hopes the OPEC will extend its production-cut deal. West Texas Intermediate crude futures traded as high as $51.10 a barrel, level reached on a volatile dollar after Fed’s decision, to finally settle at 50.70. The EIA weekly report released early Wednesday showed that domestic crude supplies climbed by 4.59 million barrels for the week ended September 15h, surpassing market’s expectations of 3.49 million but below previous 5.88M. The API report released late Tuesday also showed a 1.443M build, below previous 6.181M. US crude futures are at the higher end of the their yearly range, having topped back in January at 55.22, which means that the pace of the advance may begin moderating. Anyway, the bullish stance persists, as in the daily chart, WTI posted a higher high and a higher low daily basis, extending further beyond its 100 and 200 SMAs, whilst technical indicators picked up near overbought readings after being consolidating for most of the week. Shorter term, and according to the 4 hours chart, the commodity is also bullish, far above bullish moving averages, and with a strong upward momentum. Beyond the mentioned daily high, the 51.52, May high is the next probable target, en route to the 52.00 price zone.
Support levels: 50.20 49.60 49.10
Resistance levels: 51.10 51.55 52.00
DJIA
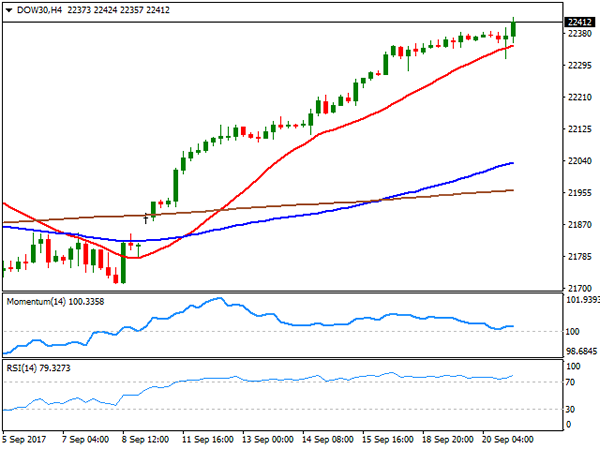
Wall Street closed mixed, but with the DJIA up for ninth day in-a-row, up 41 points to 22,412.59. The S&P added 0.06%, to end at 2,508.24, although the Nasdaq Composite ending the day down 5 points, at 6,456.04. The Federal Reserve decided to leave rates unchanged, but also indicated that a hike remains likely before the end of the year, and that three additional hikes are possible for the next one, while announcing also they will unwind their balance sheet. Bank-related equities were among the best performers, as they benefit from higher bond yields because it means they can charge higher interest rates on loans. Apple was the worst performer, down 1.68%, followed by Johnson & Johnson that shed 1.48%. McDonald’s on the other hand, was the best performer, up 1.56%. The daily chart supports additional gains ahead, although the risk of a downward correction keeps increasing. Indicators in the mentioned time frame, however, keep heading north above their mid-lines, whilst moving averages accelerated further north well below the current level. Being at unexplored territory, round numbers are clear market targets for speculators, now looking to test 22,500. Shorter term, and according to the 4 hours chart, the risk is also towards the upside, as the index bounced sharply after attempting to break below a bullish 20 SMA, whilst technical indicators also turned higher, and particularly the RSI now stands at 79.
Support levels: 22,370 22,334 22,288
Resistance levels: 22,424 22,475 22,500
FTSE100
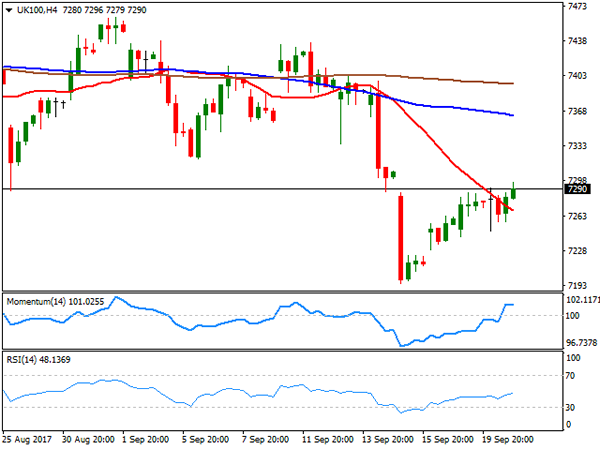
The London benchmark, the FTSE 100, ended Wednesday at 7,271.95, down 3 points, as the Pound surged on upbeat UK Retail Sales figures for August. Nevertheless, the decline was limited amid the prevalent cautious mode ahead of the US Federal Reserve’s September policy decision. Babcock International Group led advancers, adding 5.81%, followed by Kingfisher that gained 5.60% after saying it’s on track to meet targets in the second year of its five-year restructuring plan, also raising its dividend. Diageo, a drinks company, was the worst performer, shedding 2.78%. The index added some 20 points after the close, now struggling around 7,290, but still looking bearish in the daily chart, as the index has multiple relevant lows in the region from these last few months as the index develops below all of its moving averages, whilst technical indicators remain within bearish territory gaining downward strength. In the 4 hours chart, the RSI indicator remains below its mid-line, whilst the Momentum lost upward strength within positive territory. In this last time frame, the index stands a few points above a strongly bearish 20 SMA, also limiting chances of a steeper recovery for this Thursday, particularly if the Pound maintains its strength.
Support levels: 7,268 7,236 7,195
Resistance levels: 7,317 7,344 7,380
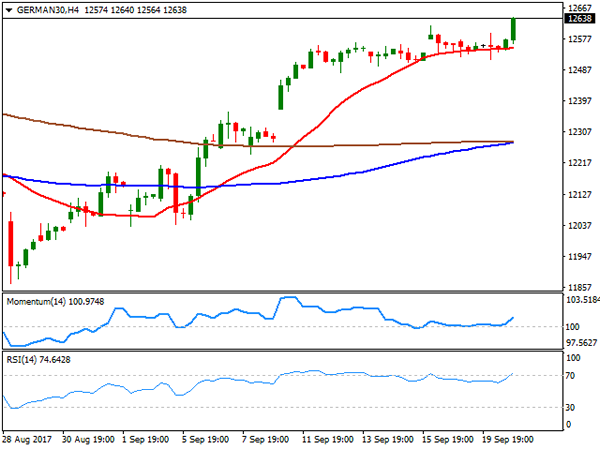
DAX
European equities ended the session little changed, with the German DAX managing to add 7 points, to 12,569.17, amid wait-and-see stance ahead of Fed’s announcement. Higher oil prices kept equities afloat, whilst German equities found additional support in rising producer price inflation up by 0.2% in August from the previous month, and by 2.6% from a year earlier. RWE AG led advancers, closing the day 3.50%, followed by Commerzbank that added 2.51%, while Deutsche Bank led decliners, down 1.68%. The index surge in after-hours trading, amid Wall Street’s reaction to the Fed’s announcement, now heading into the Asian opening at 12,638, its highest in over two months, helped by a weaker EUR. Technically, the daily chart for the index favors further gains ahead, given that technical indicators have resumed their advance near overbought levels, whilst it extended further above its moving averages. Shorter term, and according to the 4 hours chart, the index is also biased higher, as an early decline was contained by buying interest around its 20 SMA, whilst technical indicators turned strongly up with the Momentum above its 100 level and the RSI entering overbought territory.
Support levels: 12,584 12,537 12,489
Resistance levels: 12,677 12,720 12,769