
- Nasdaq 100 broke resistance level 12180.00
- Likely to rise to resistance level 12920.00
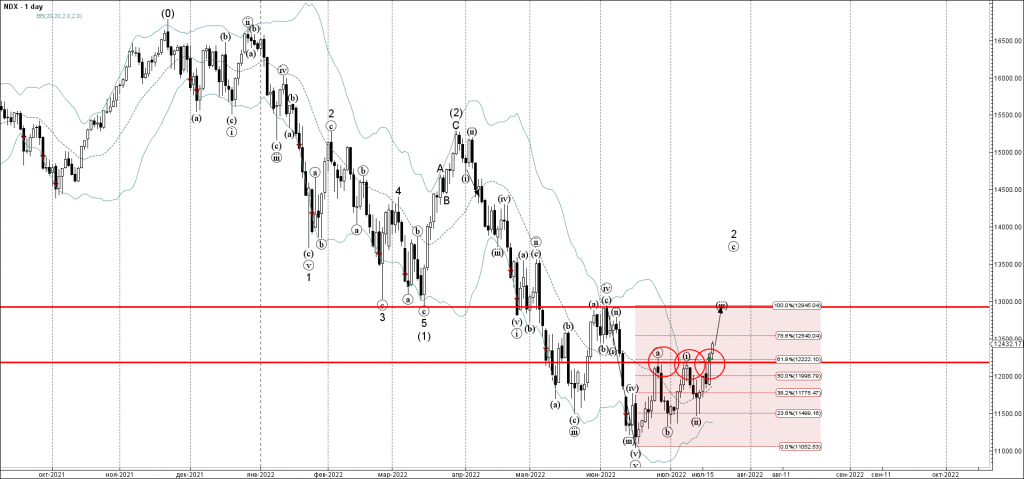
Nasdaq 100 index recently broke the resistance area located at the intersection of the resistance level 12180.00 (which stopped the previous waves (a) and (i), as can be seen below) and the 61.8% Fibonacci correction of the downward impulse from the start of June.
The breakout of this resistance area should accelerate the active short-term impulse wave (iii) of wave 2 from last month.
Nasdaq 100 can be expected to rise further toward the next key resistance level 12920.00 (former monthly low from March and also the monthly high from June).


