
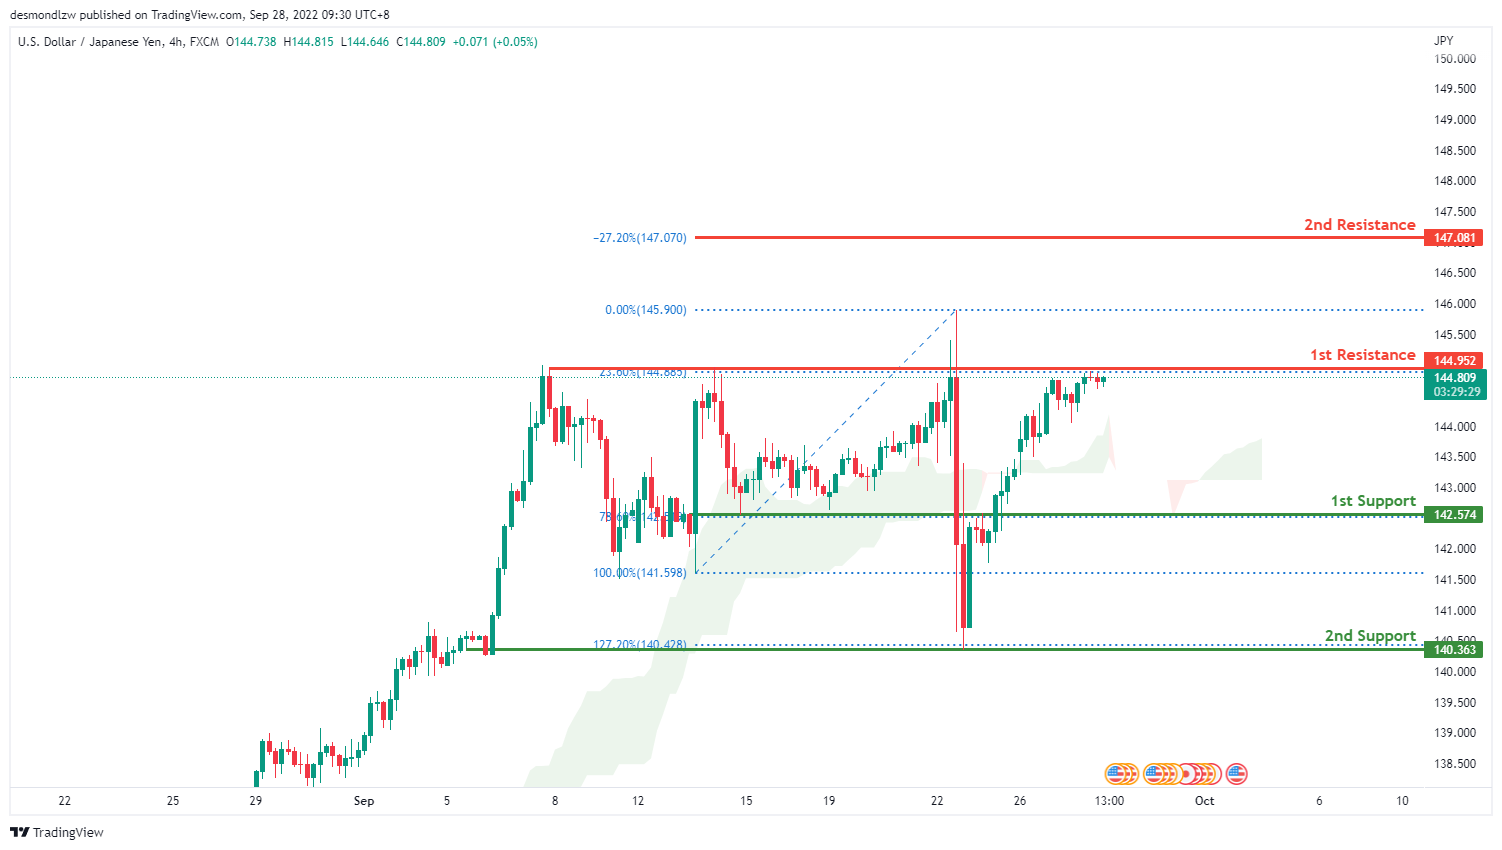
USD/JPY:
On the H4 chart, price has pushed through very strongly through the 1st support at 142.574 where the 78.6% Fibonacci line lies. Price has tapped and looks to be consolidating below the 1st resistance at 144.952 where the 23.6% Fibonacci line lies. Looking for price to potential break through the 1st resistance and head towards the 2nd resistance at 147.070 where the -27.2% Fibonacci expansion line is. Alternatively, price could reflect back down from the 1st resistance back down towards the 1st support at 142.574 where the 78.6% Fibonacci line is.
Areas of consideration:
- H4 time frame, 1st resistance at 144.952
- H4 time frame, 1st support at 142.574
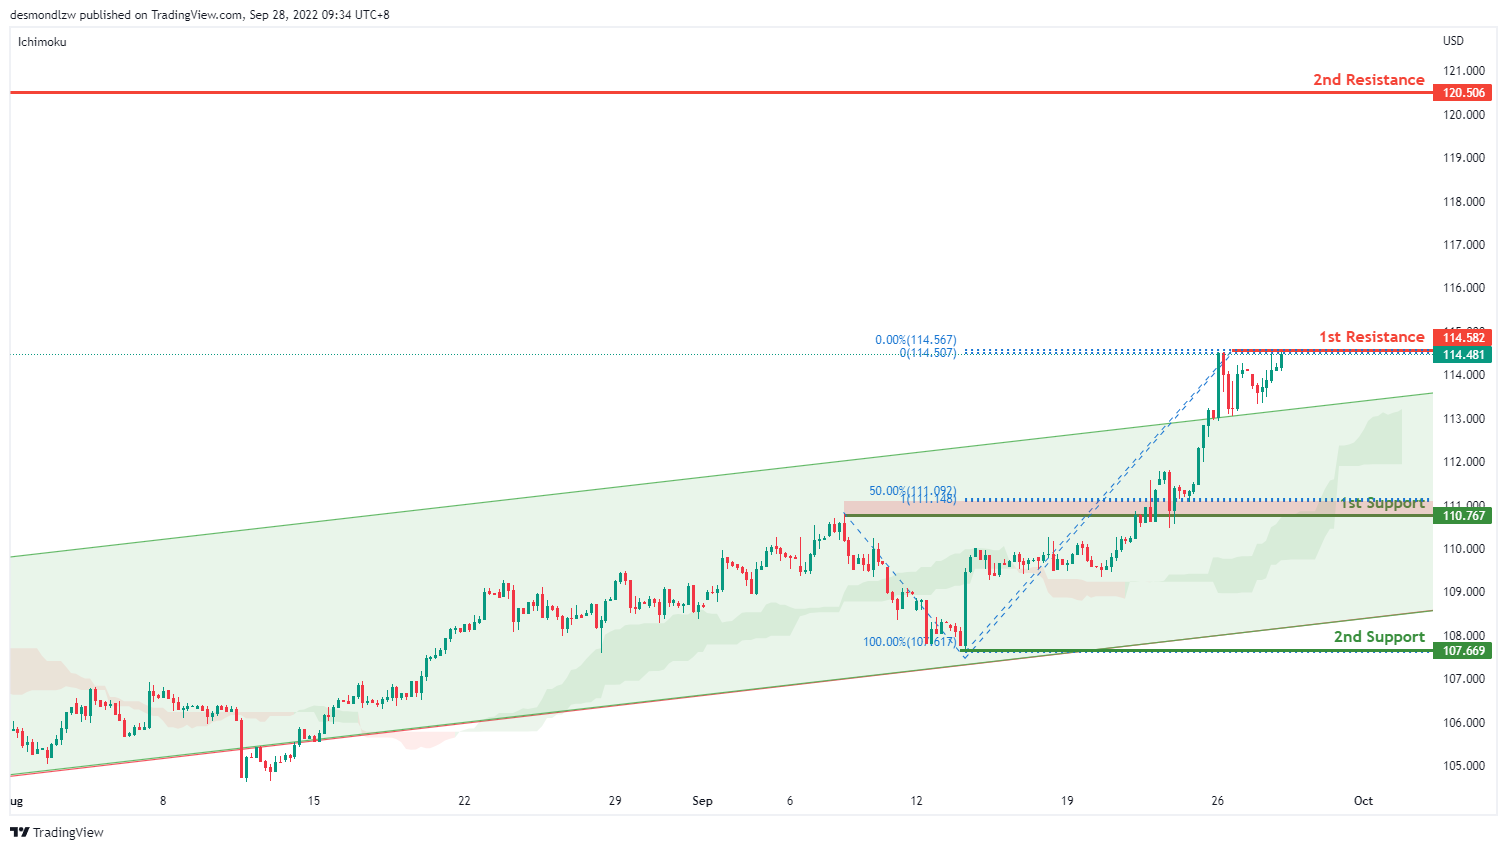
DXY:
On the H4, price is still respecting the bullish channel and we are bullish bias. Price is currently testing the first resistance at 114.582 where the previous swing high sits. If it breaks this level, there is a confirmation for strong bullish momentum and price might test the second resistance at 120.506 where the previous swing high sits. Alternatively price could pull back to test the first support at 110.767 where the 50% retracement and 100% projection sits. If price breaks this support it should test the second support at 107.669 where the previous swing low sits
Areas of consideration:
- H4 time frame, 1st resistance at 114.582
- H4 time frame, 1st support at 110.767
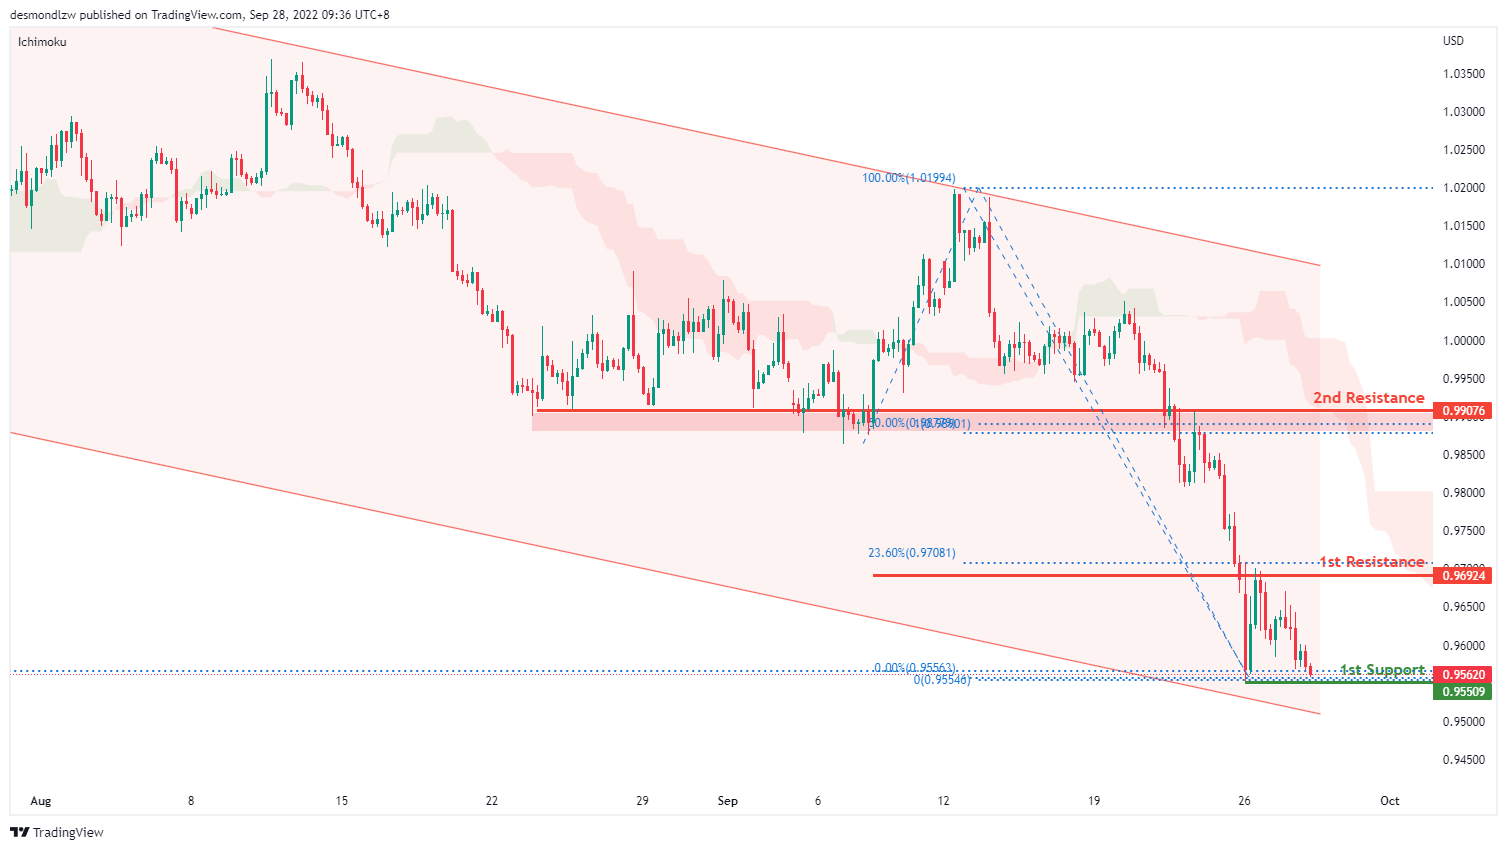
EUR/USD:
On the H4, price is moving within the channel in a descending manner- we are bearish biased. Price is testing the first support at 0.9550 where the previous swing low and 161.8% extension sits. If it breaks this level, we have a strong bearish confirmation to bring price down to 0.8497 levels where the previous swing low sits. Alternatively it might pull back to test the first resistance at 0.9692 where the 23.6% retracement and 145% extension sits, then the second resistance at 0.9907 where the 50% retracement and 100% projection sits.
Areas of consideration :
- H4 1st resistance at 0.9692
- H4 1st support at 0.9550
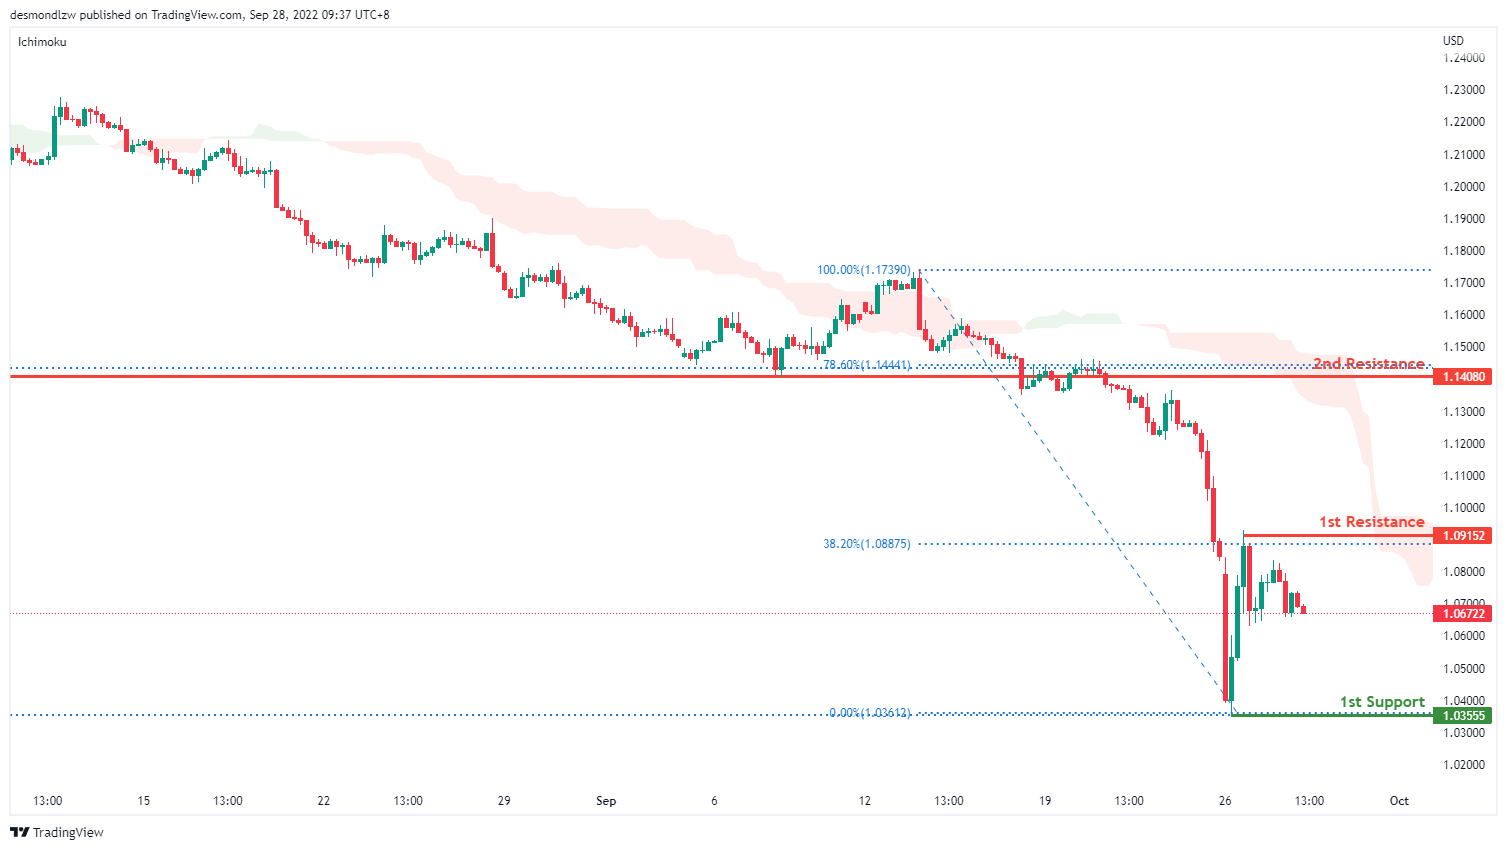
GBP/USD:
On the daily time frame, prices are still moving in a bearish momentum hence we are bearish biased. Price has already tested the previous swing low at 1.0355 where the 138.2% extension sits. If bearish momentum continues, it should bring price to 0.9665 where the 161.8% extension sits. Alternatively price could pull back to test the first resistance at 1.0915 where the 38.2% retracement sits then the second resistance at 1.1408 where the previous swing low and 78.6% retracement sits
Areas of consideration:
- H4 1st resistance at 1.0915
- H4 1st support at 1.0355
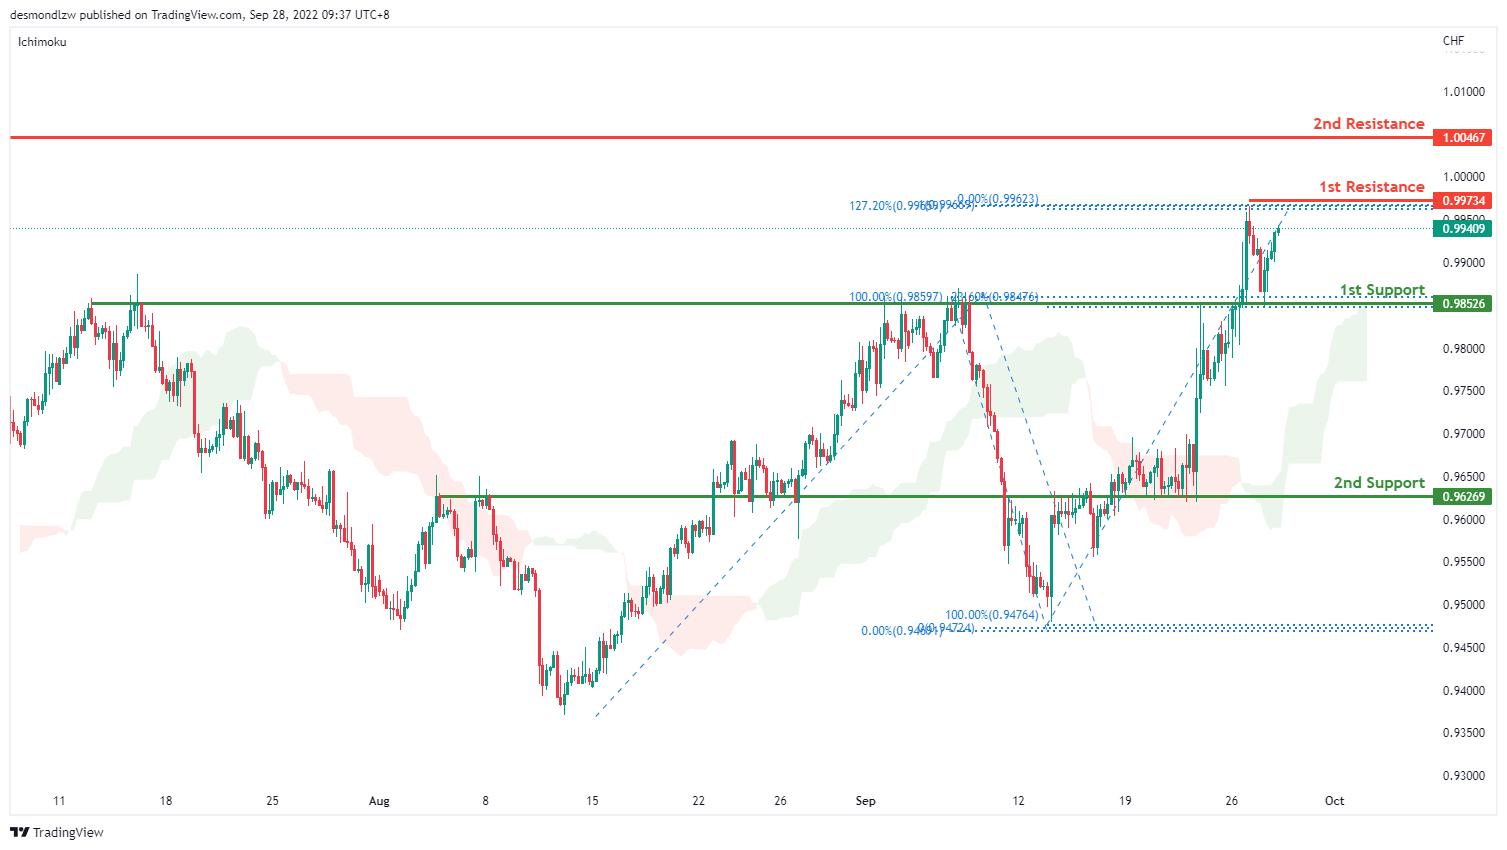
USD/CHF:
On the H4, prices have broken the descending channel and are moving above the ichimoku cloud- we are currently bullish biased. Price has broken the first support and is moving toward the first resistance at 0.9973 where the 100% projection,127.2% extension and swing high sits. If bullish momentum continues, it should bring price to the second resistance at 1.0046 where the previous swing high sits. Alternatively, price could pull back to test the first support at 0.9852 where the 23.6% retracement and overlapping resistance sits. If it breaks the first support, it should bring price to the second support at 0.9626 where the previous swing low sits.
Areas of consideration
- H4 1st support at 0.9852
- H4 1st resistance at 0.9973
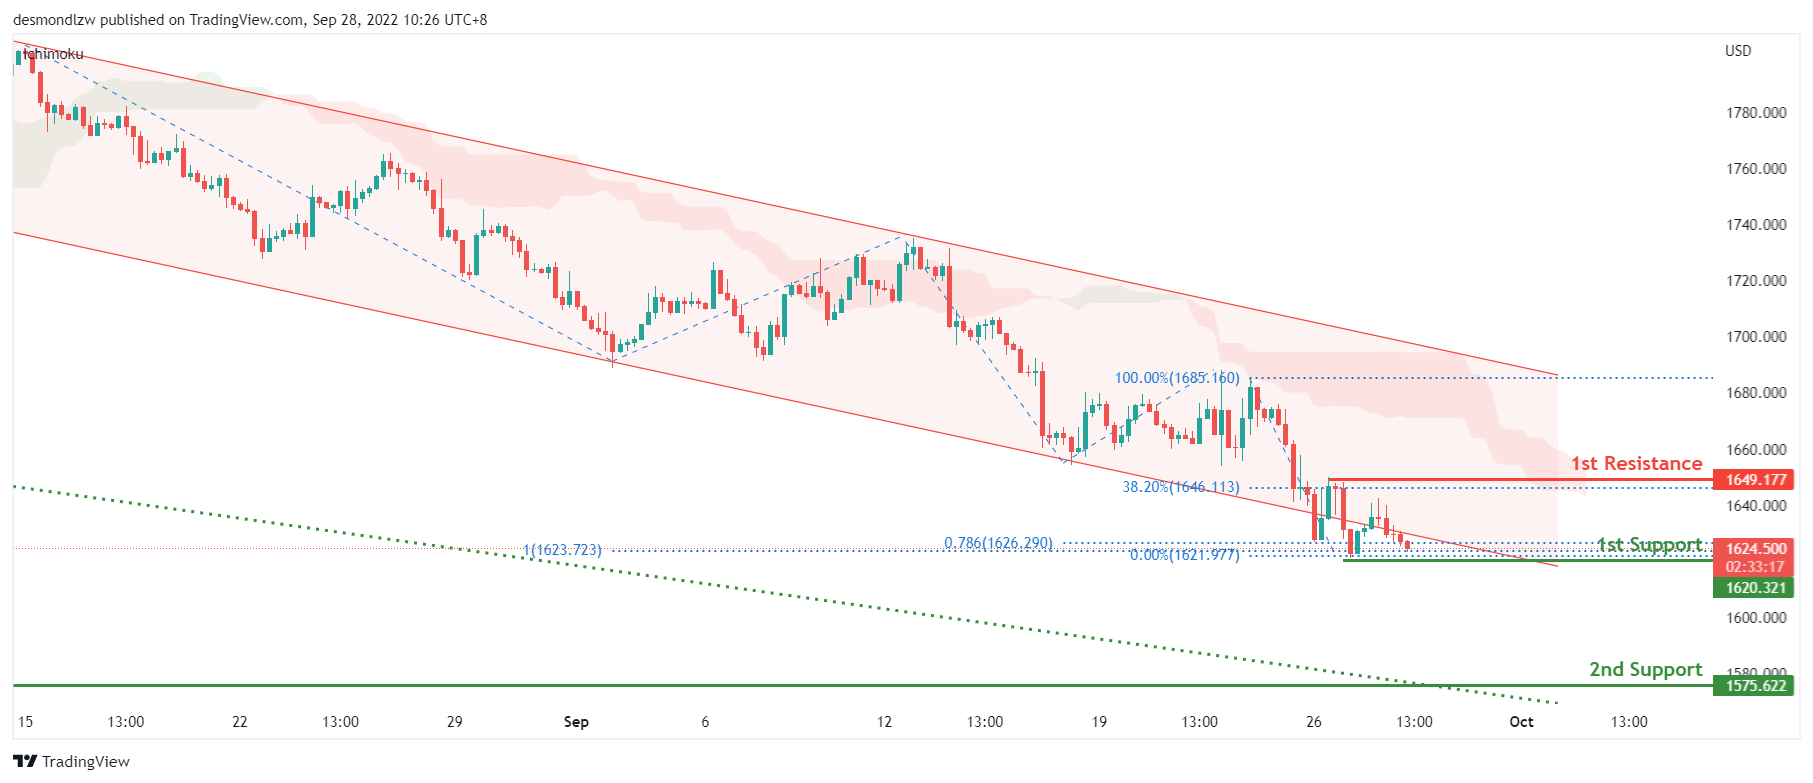
XAU/USD (GOLD):
On the H4, with the price breaking lower from the bearish channel and maintaining below the ichimoku cloud, leading to a bearish bias that price may drop to the 2nd support of 1575, which is in line with the swing low from March 2020. The 1st support of 1620, which is in line with the 100% fibonacci extension level needs to be broken to trigger the next move down to the 2nd support level.
Areas of consideration:
- H4 time frame, 1st resistance at 1649
- H4 time frame, 1st support at 1620
- H4 time frame, 2nd support at 1575
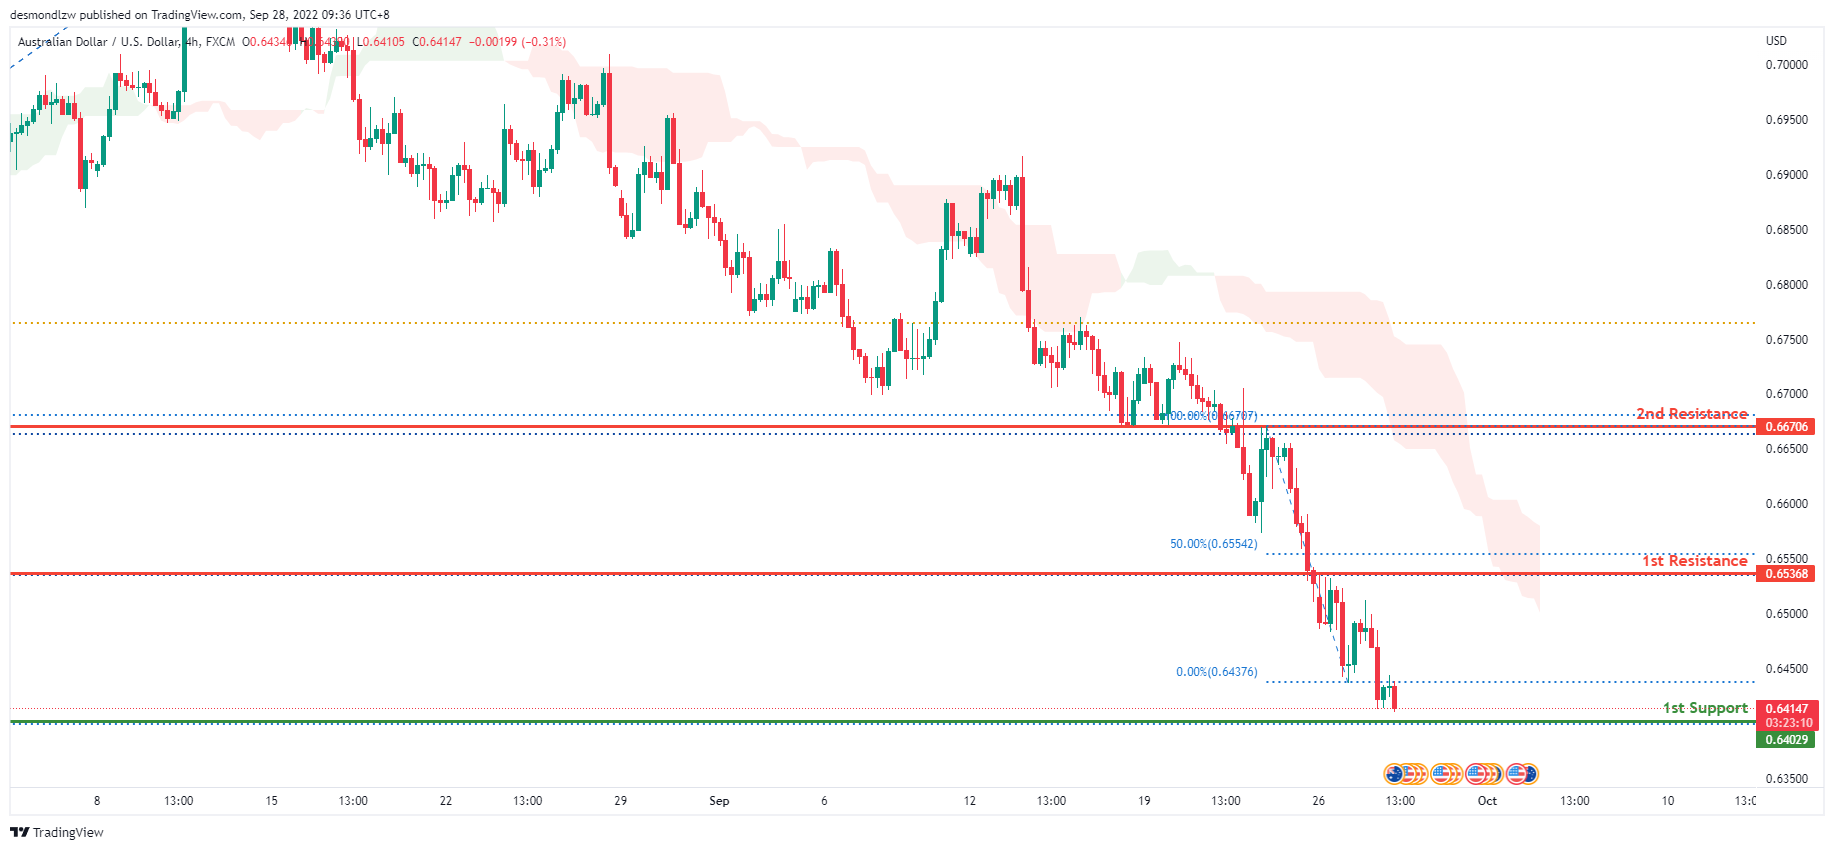
AUD/USD:
On the H4, the price is moving in a strong bearish trend. To add on confluence to this bias, price is below the Ichimoku cloud which indicates a bear market. Price has broken below the 1st resistance where the 100% Fibonacci line lies. Price has also tried multiple times to break back up the 1st resistance and failed to do so. With such a strong bearish momentum, expect price to tap the 1st support at 0.64029 where the 161.8% Fibonacci extension line lies within the day.
Areas of consideration
- H4, 1st resistance at 0.65368
- H4, 1st support at 0.64029
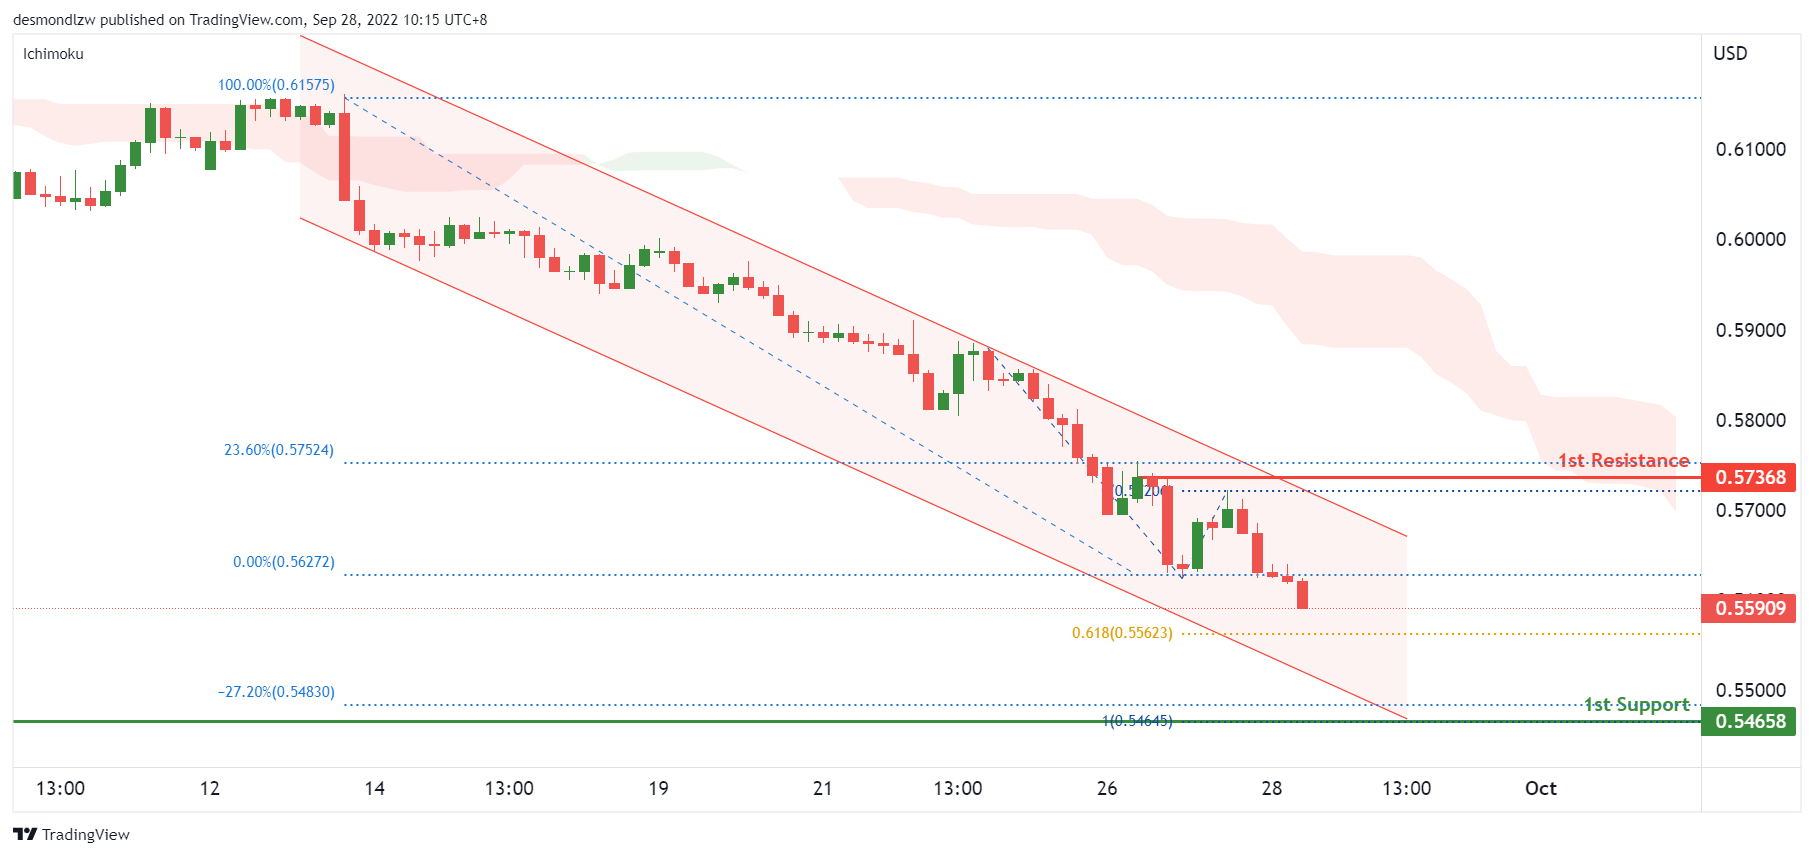
NZD/USD:
On the H4, with the price continuing to move within the descending channel and below the ichimoku cloud, we maintain a bearish bias that the price may drop to the 1st support at 0.5464, which is in line with the 27.20% fibonacci expansion level, 100% fibonacci extension and swing low from March 2020. There is a risk level at 0.5562 which is where our intermediate support and the 61.8% fibonacci extension is, which needs to be broken to trigger the next move down to the support level .
Areas of consideration:
- H4 time frame, 1st support at 0.5465
- H4 time frame, 1st resistance at 0.5736
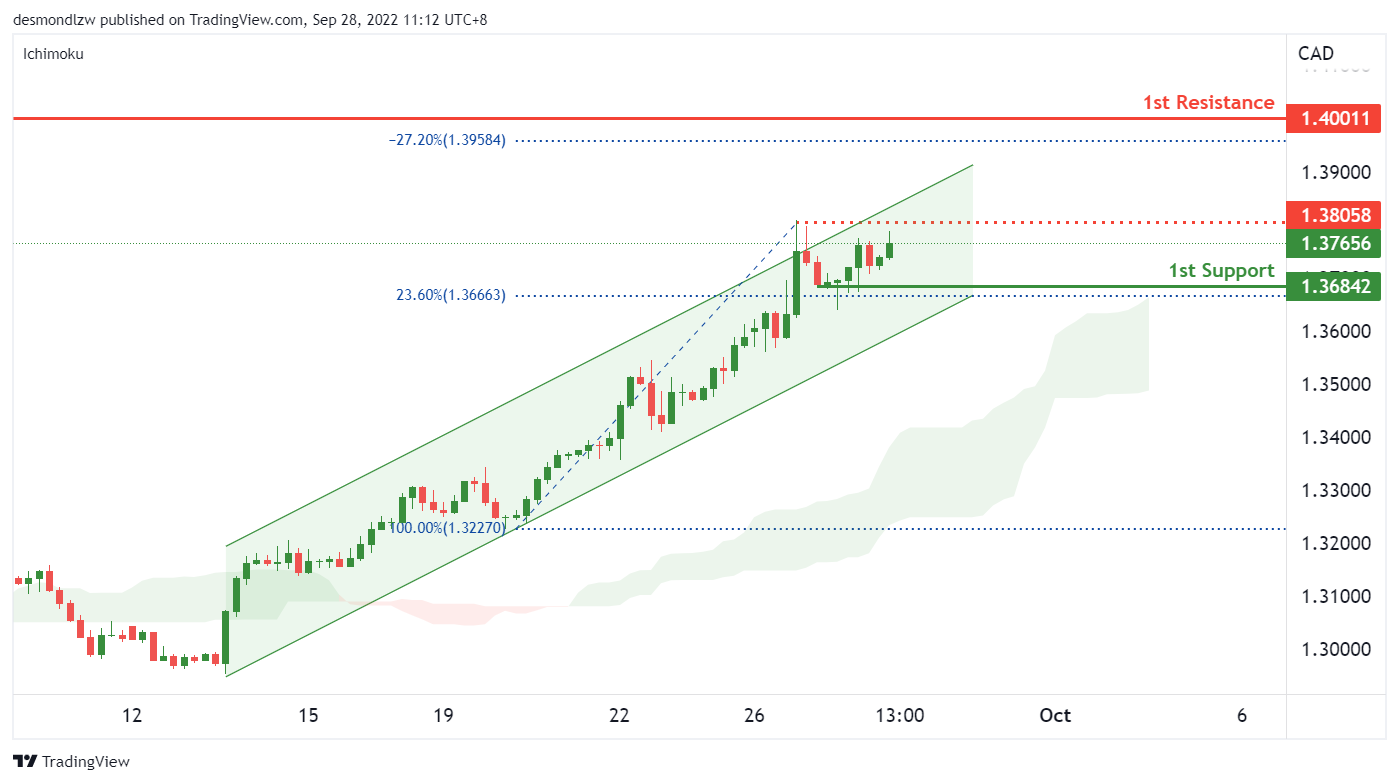
USD/CAD:
On the H4, with the price trading within the ascending channel and staying above the ichimoku cloud, we have a bullish bias that the price may rise to the 1st resistance at 1.40, major swing high from May 2020 and in line with the 27.20% fibonacci expansion. There is a risk level at 1.38 which is our intermediate resistance, this level needs to be broken to trigger the next move up to our resistance level.
Areas of consideration:
- H4 time frame, 1st resistance at 1.40
- H4 time frame, 1st support at 1.3684
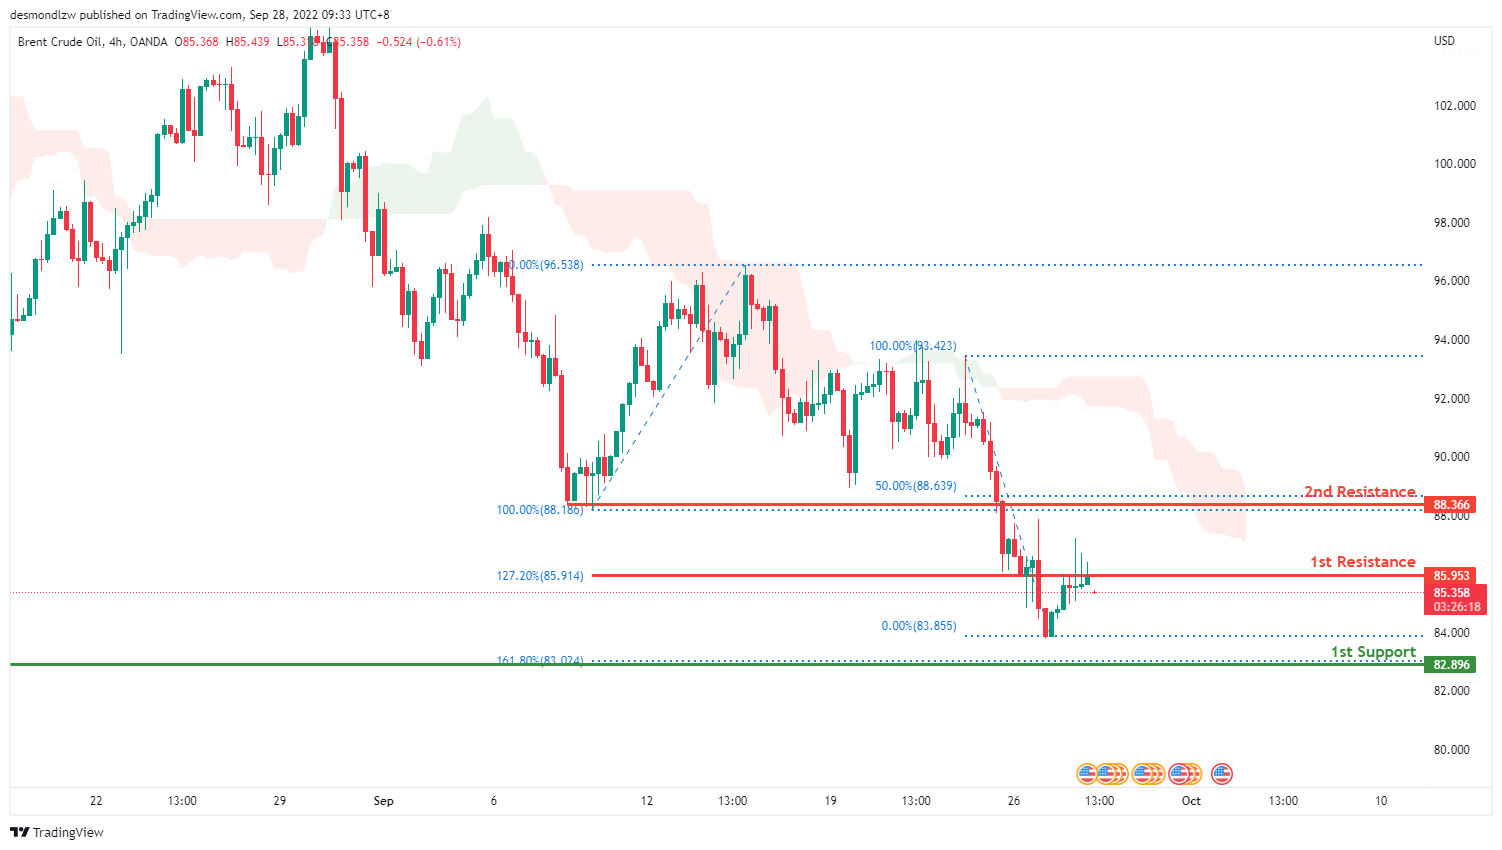
OIL:
On the H4, oil is on a bearish trend and to add confluence to this, the price is below the ichimoku cloud which indicates a bear market. Price has broken through the 1st resistance at 85.380 where the 141.4% Fibonacci extension lies. Price also tried multiple times to break back up through the 1st resistance but failed to do so. Expect price to go to the 1st support at 82.896 where the 161.8% Fibonacci extension line is.
Areas of consideration:
- H4 time frame, 1st resistance at 85.953
- H4 time frame, 1st support at 82.896
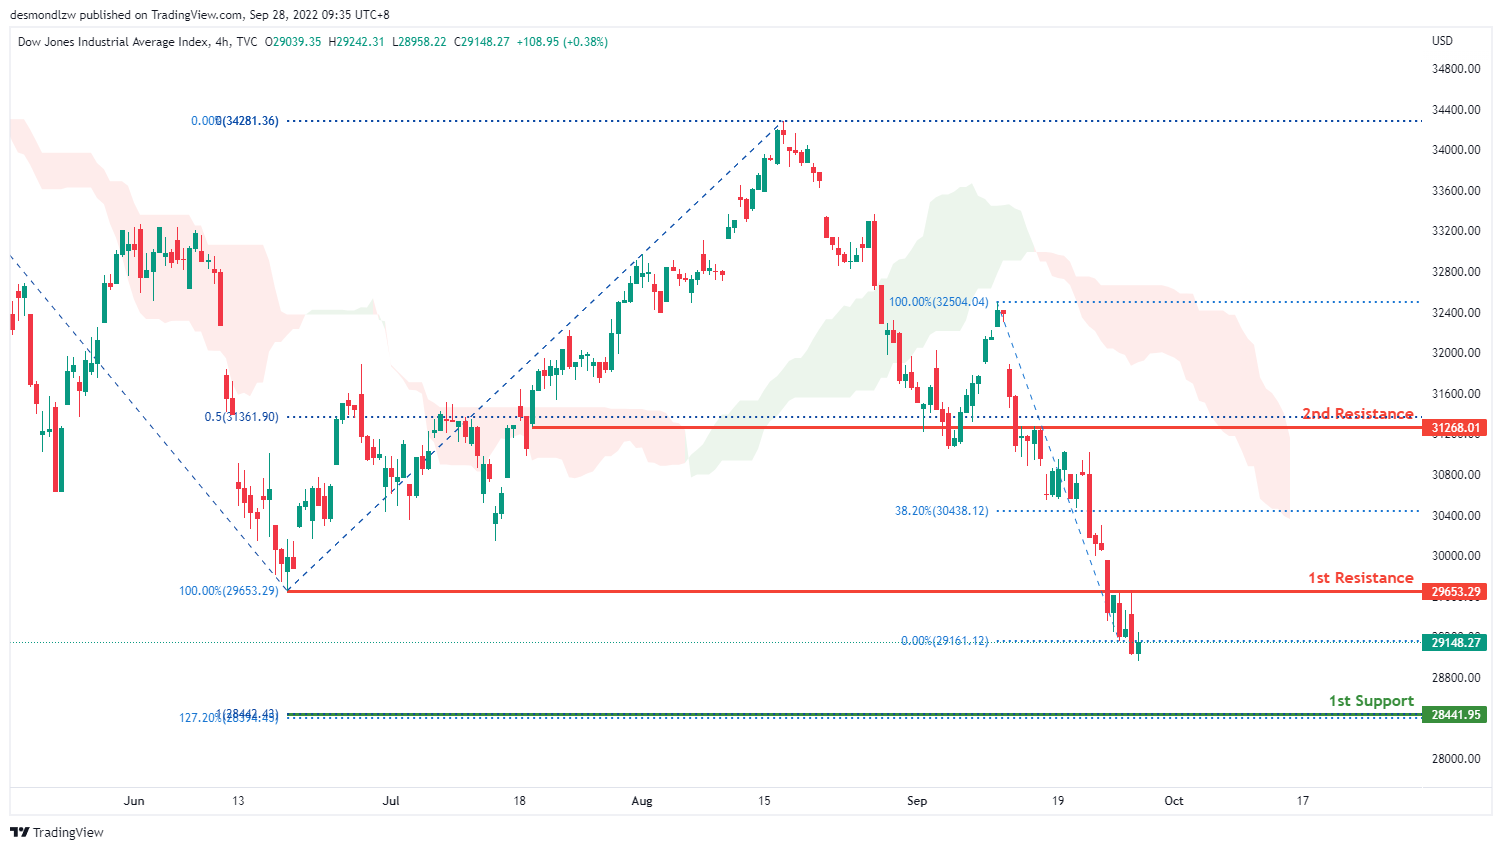
Dow Jones Industrial Average:
On the H4, price is on a very bearish trend. To add confluence to this, price is below the ichimoku cloud which indicates a bearish market. Price has also broke through the 1st resistance at 29653.29, where the 100% Fibonacci line and previous swing low lies. Price also tried multiple times to break back up but failed to do so. If this bearish momentum continues, expect price to continue heading downwards towards the 1st support at 28458.52 where the 127.2% Fibonacci extension and 100% Fibonacci projection line is.
Areas of consideration:
- H4 time frame, 1st support at 28458.52
- H4 time frame, 1st resistance at 29653.29
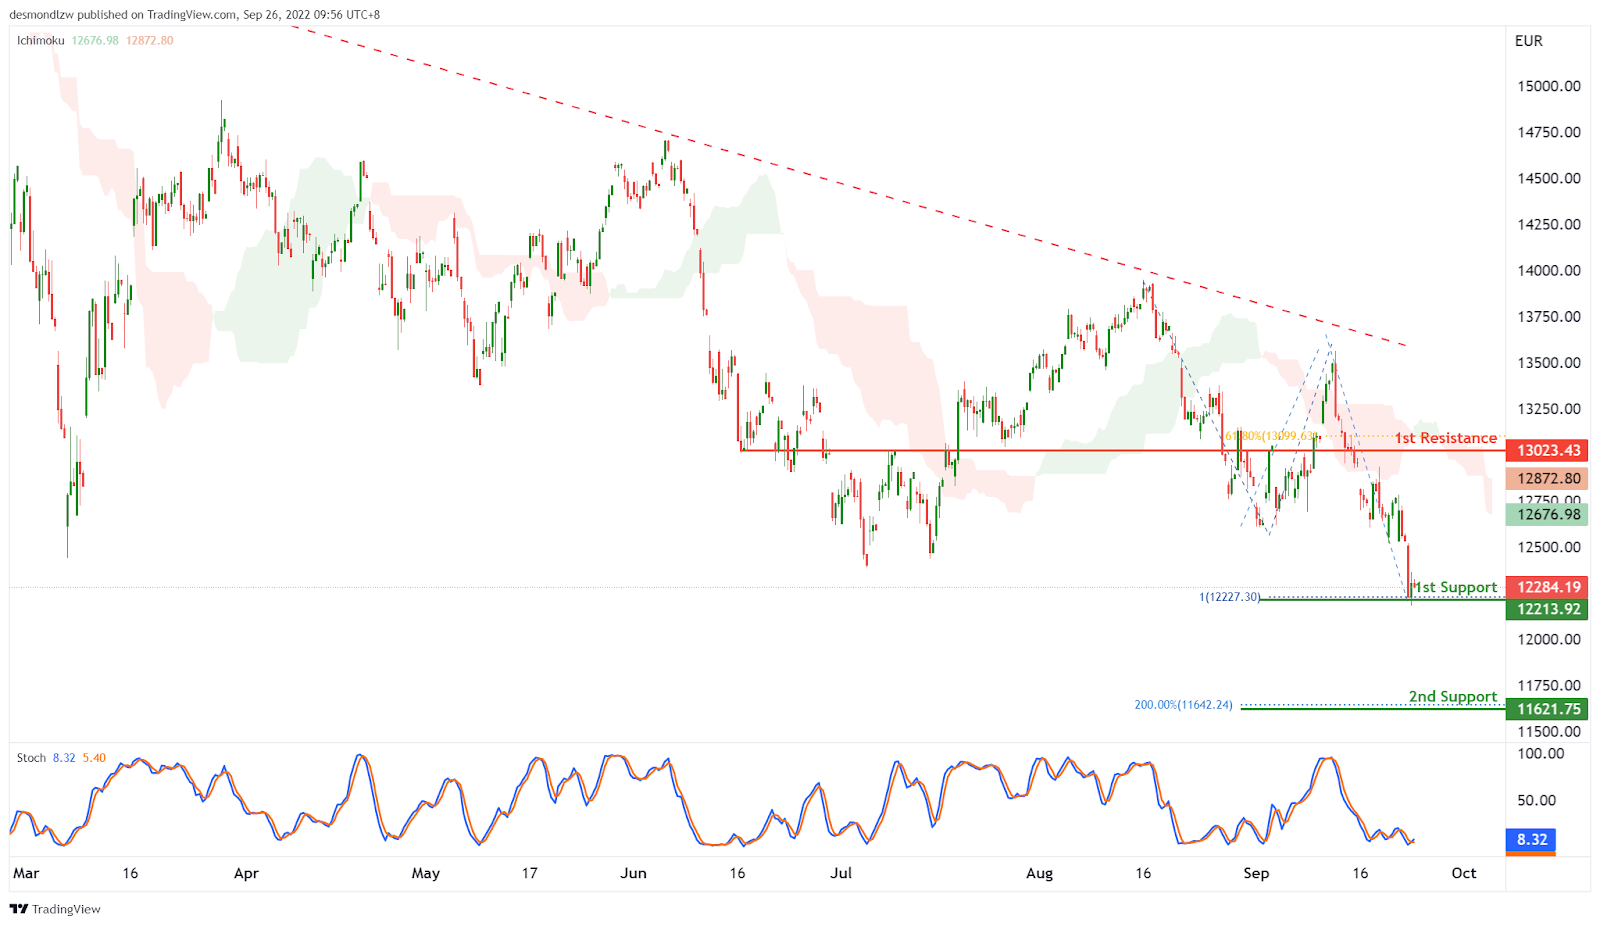
DAX:
On the H4, with the price moving below the descending trendline and below ichimoku cloud, we have a bearish bias that the price may drop from the 1st support at 12213.92, which is in line with the swing lows and 100% fibonacci projection. If the 1st support is broken, the next support level could be at 11621.75, where the 200% fibonacci extension is. Alternatively, the price may rise to the 1st resistance at 13023.43, where the 61.8% fibonacci retracement and overlap resistance are.
Areas of consideration:
- H4 time frame, 1st support at 12213.92
- H4 time frame, 2nd support at 11621.75
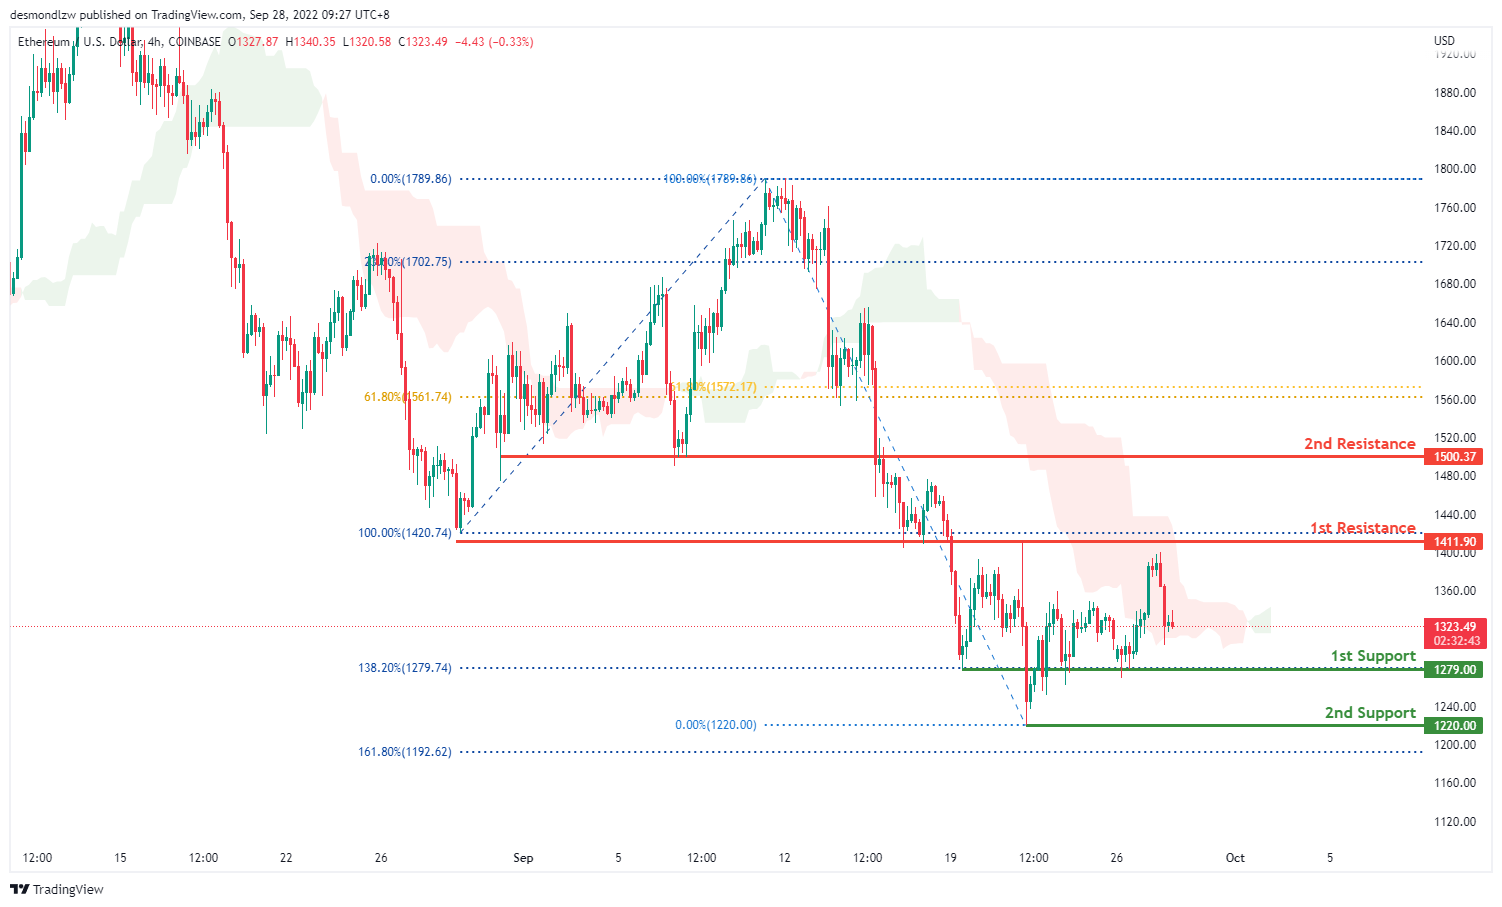
ETHUSD:
On the H4, overall price is very bearish on ETHUSD. Price has reflected off the 1st support at 1279.74 where the 138.2% Fibonacci line lies 3 times which indiciates a retail triple bottom. Price nearly tapped onto the 1st resistance at 1411.90 where the 100% Fibonacci projection is before reversing back down towards the 1st support at 1279.00 where the 138.2% Fibonacci extension line lies. Watching for price to potentially break through the 1st support and head towards the 2nd support at 1220.00 where the 0% Fibonacci line and low is.
Areas of consideration:
- H4 time frame, 1st resistance of 1411.90
- H4 time frame, 1st support at 1279.00
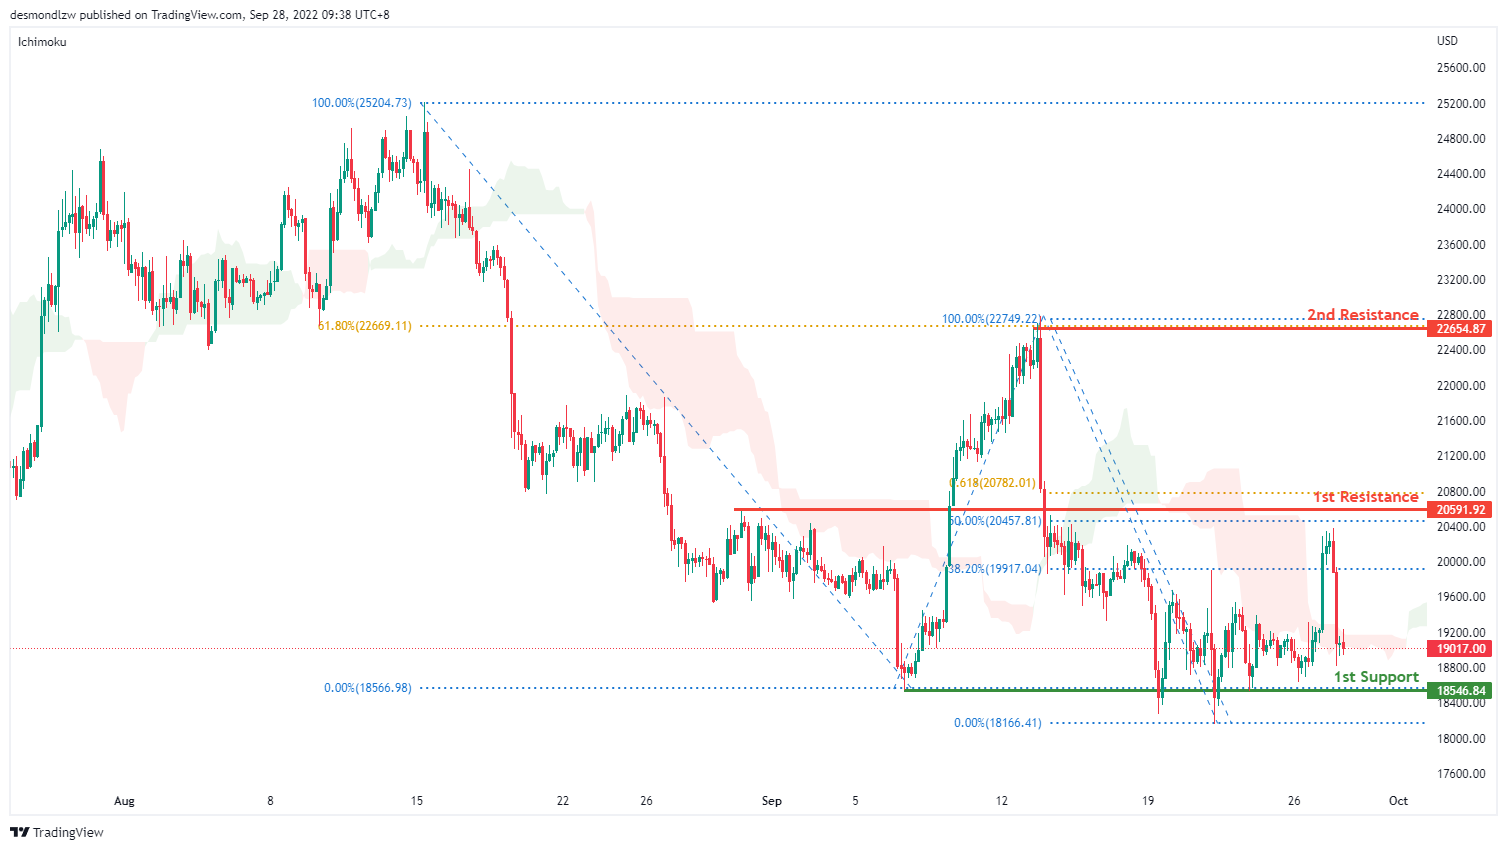
BTCUSD:
On the H4, price has pulled back to test the first support at 18546.84 where my previous swing low sits. If price breaks this level, bearish momentum would bring price to test the 17648.80 levels where the previous swing low sits. Alternatively price could pull back to test the first resistance at 20591.92 where the 50% retracement and 61.8% projection sits. If it breaks this level, it should move to the second resistance at 22654.87 where the 100% projection and 61.8% retracement sits.
Areas of consideration:
- H4 time frame, 1st support at 18546.84
- H4 time frame, 1st resistance at 20591.92
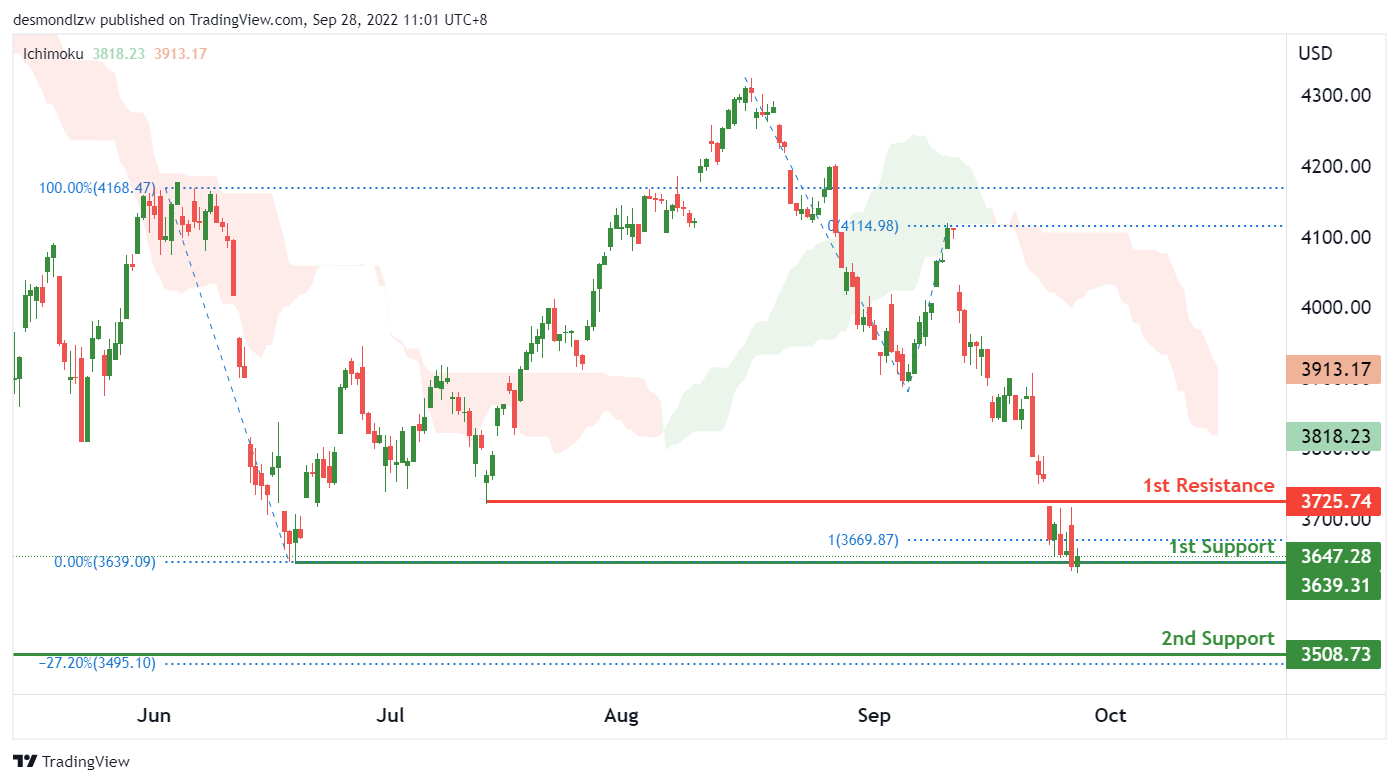
S&P 500:
On the H4, with the price on a strong bearish trend and below the ichimoku cloud, we have a bearish bias that price may drop to the 2nd support of 3508, which is in line with the 27.2% fibonacci expansion and previous swing low from November 2020. The 1st support of 3639and previous swing low from June 2022 needs to be broken to trigger the next move down to the 2nd support level.
Areas of consideration:
- H4 time frame, 1st resistance at 3725
- H4 time frame, 1st support at 3639
- H4 time frame, 2nd support at 3508


