
USD/JPY:
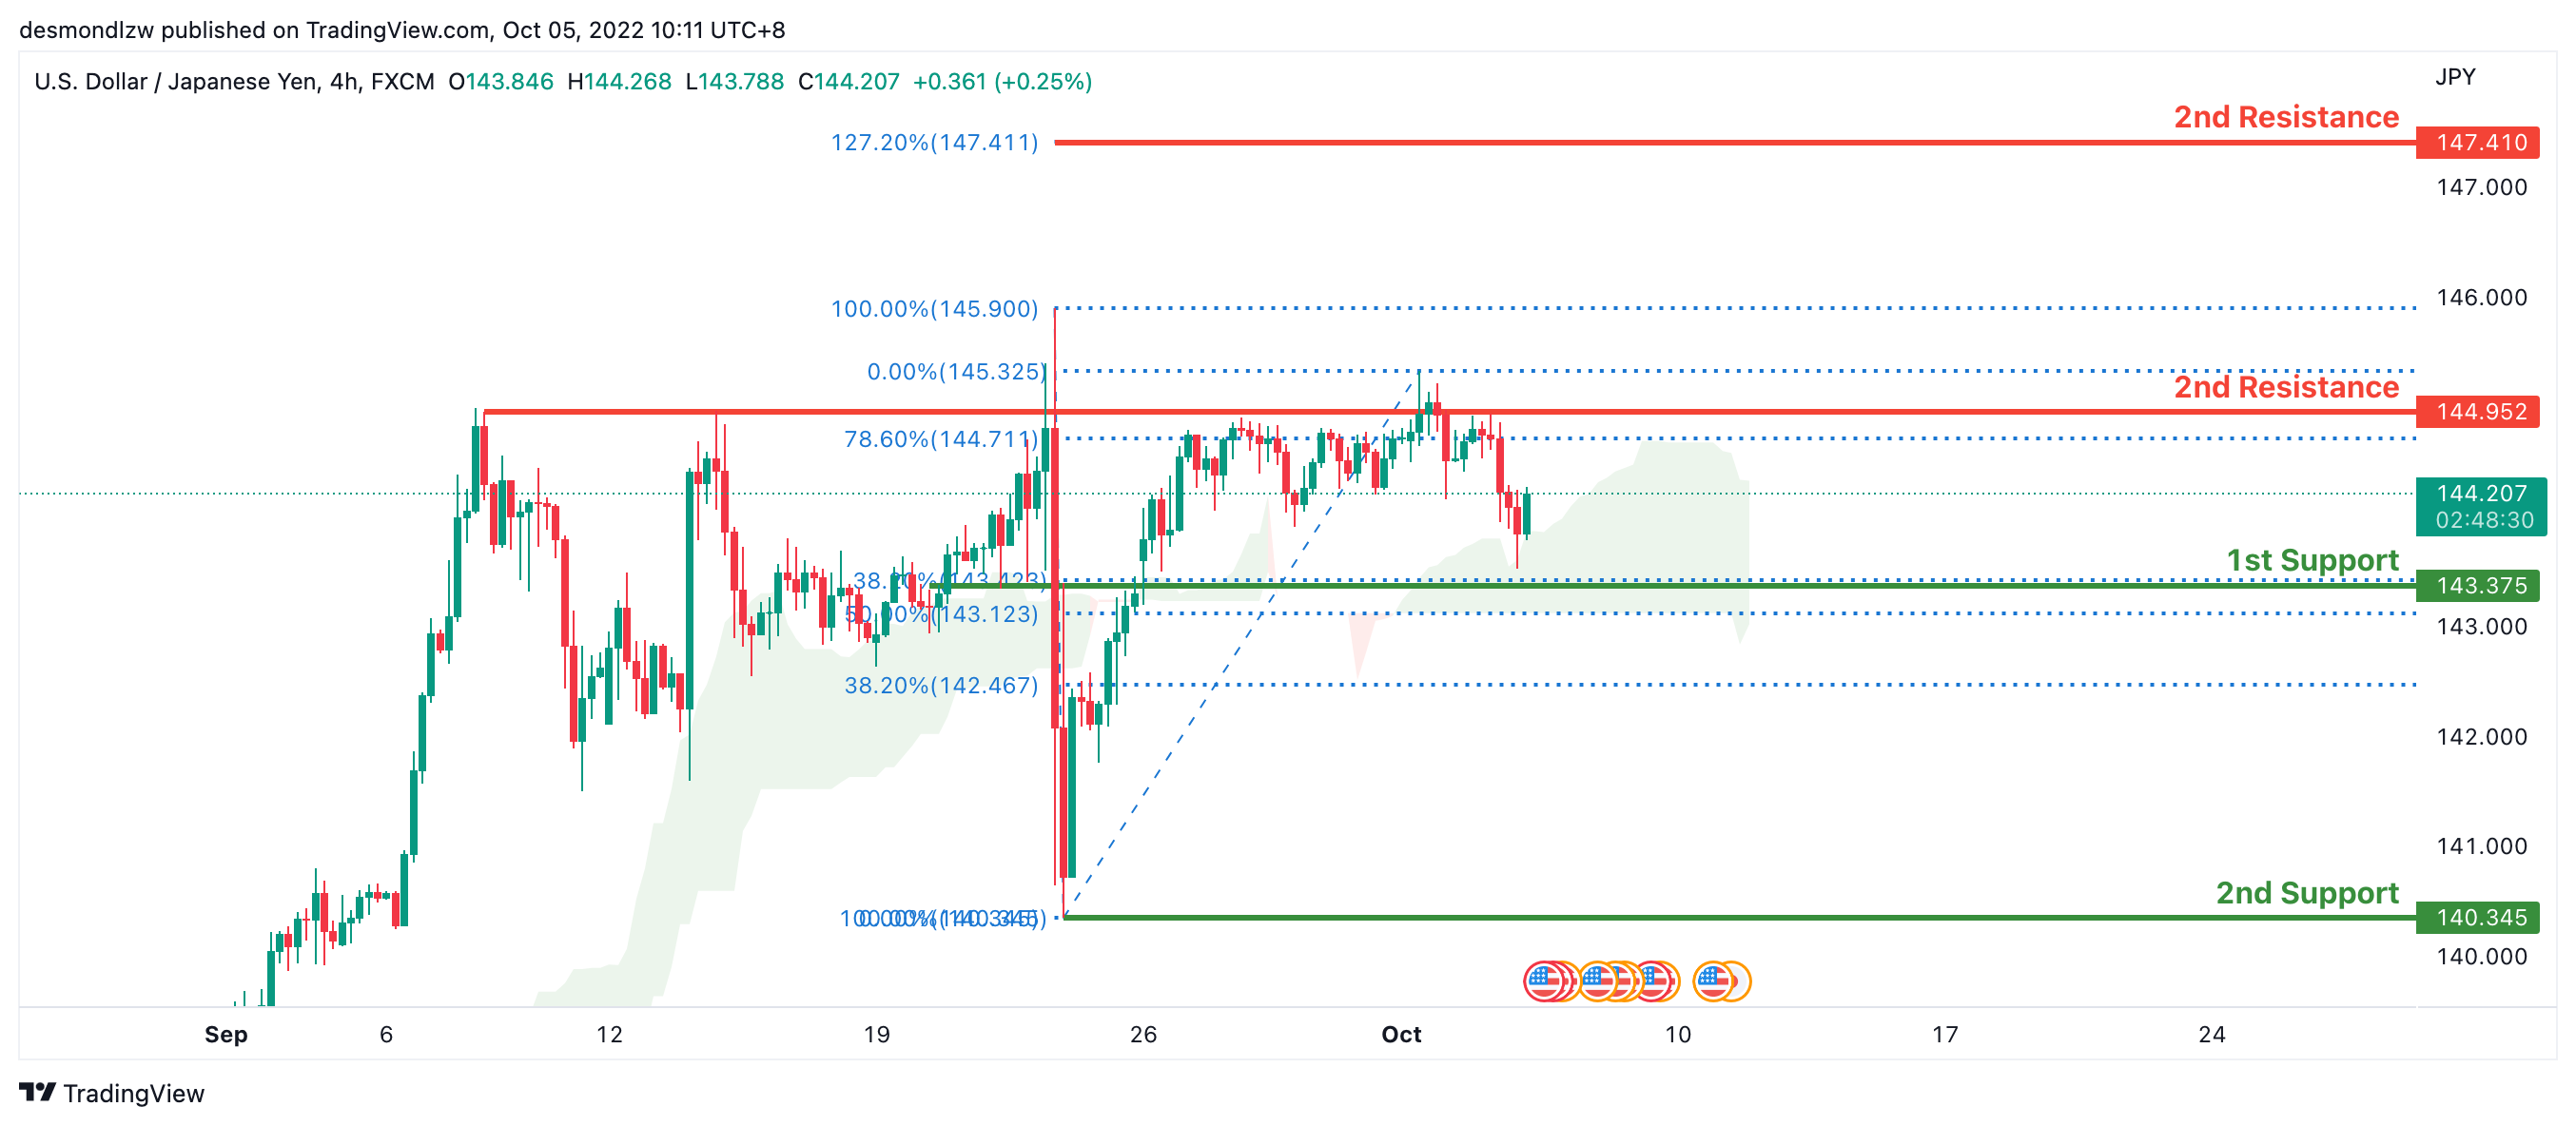
The price is moving in a clear bullish trend on the H4 chart. In addition, the price is above the ichimoku cloud, a bullish market indicator. Overnight, the price responded lower off of the 145 level with a frail bearish momentum. Price is anticipated to move towards the first support level at 143.375, which contains the 38.2% and 50% Fibonacci lines.
Areas of consideration:
- H4 time frame, 1st resistance at 144.952
- H4 time frame, 1st support at 143.474
DXY:
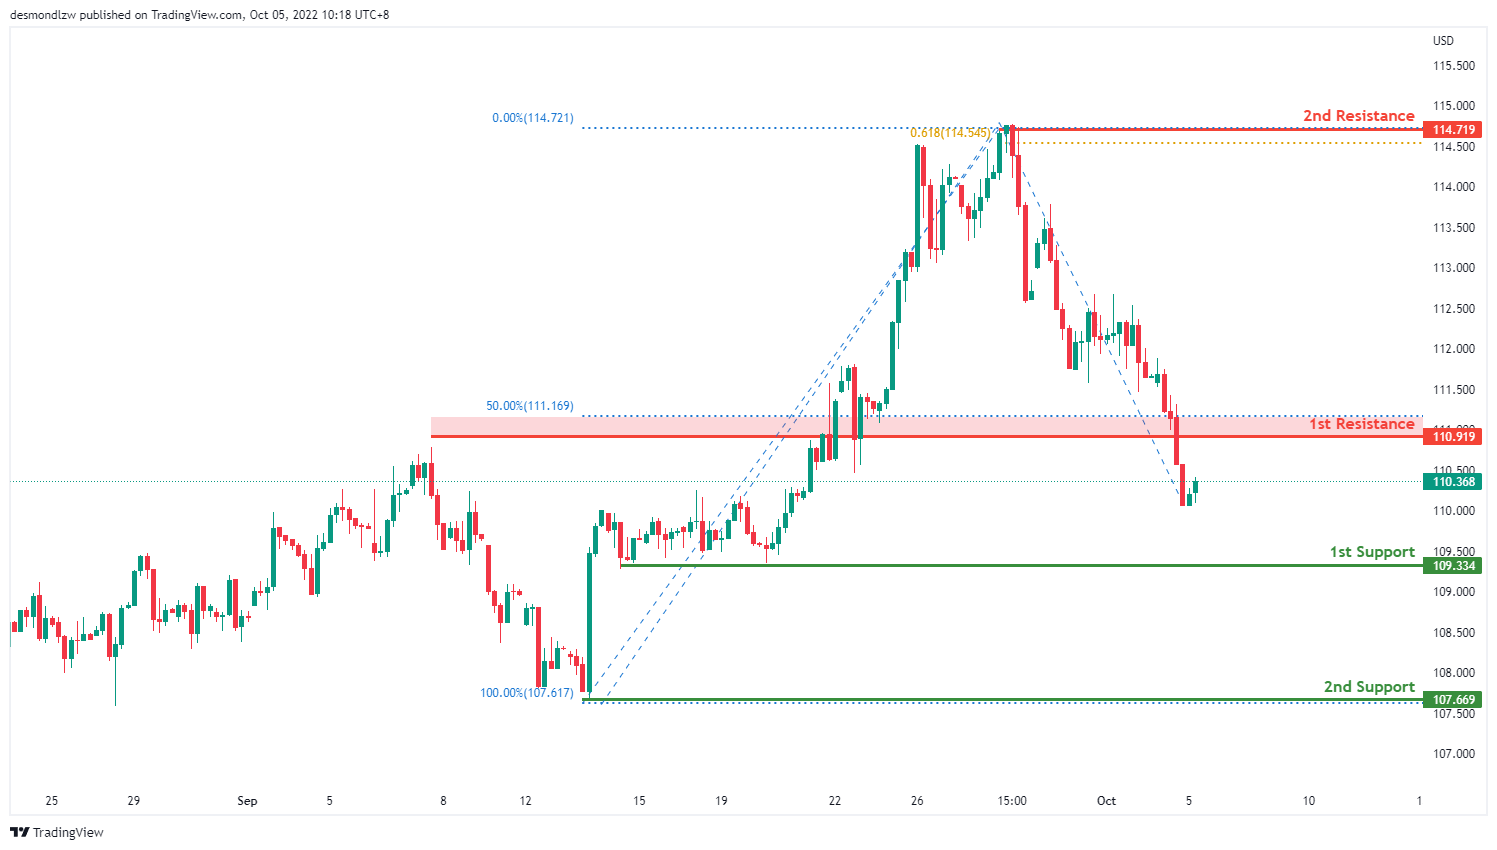
On the H4, price has broken lower from the ichimoku cloud and is moving in a descending manner hence we are bearish bias. It has broken the resistance and is moving toward the first support at 109.334 where my swing low sits. If bearish momentum continues, it will bring price to my second support at 107.669 where my second support and previous swing low sits. Alternatively price could bounce back to test the first resistance at 110.919 where my 50% retracement sits then the second resistance at 114.719 where the 61.8% projection and previous swing high sits
Areas of consideration:
- H4 time frame, 1st resistance at 110.919
- H4 time frame, 1st support at 109.334
EUR/USD:
On the H4, price is moving within the descending trendline but in an ascending manner, with the price above ichimoku cloud- we are slightly bullish biased. Price has bounced off the first support and is moving toward the first resistance at 1.00473 where the 78.6% projection sits. If price breaks this level, it will test the second resistance at 1.0194, where the previous swing high sits. Alternatively, the overall bearish momentum could bring price back to test the first support at 0.9907 where the previous swing low and 50% retracement sits. If it breaks this level, we have a strong bearish confirmation to bring price down to 0.9750 where the swing low and 61.8% projection sits
Areas of consideration :
- H4 1st resistance at 1.0047
- H4 1st support at 0.9907
GBP/USD:
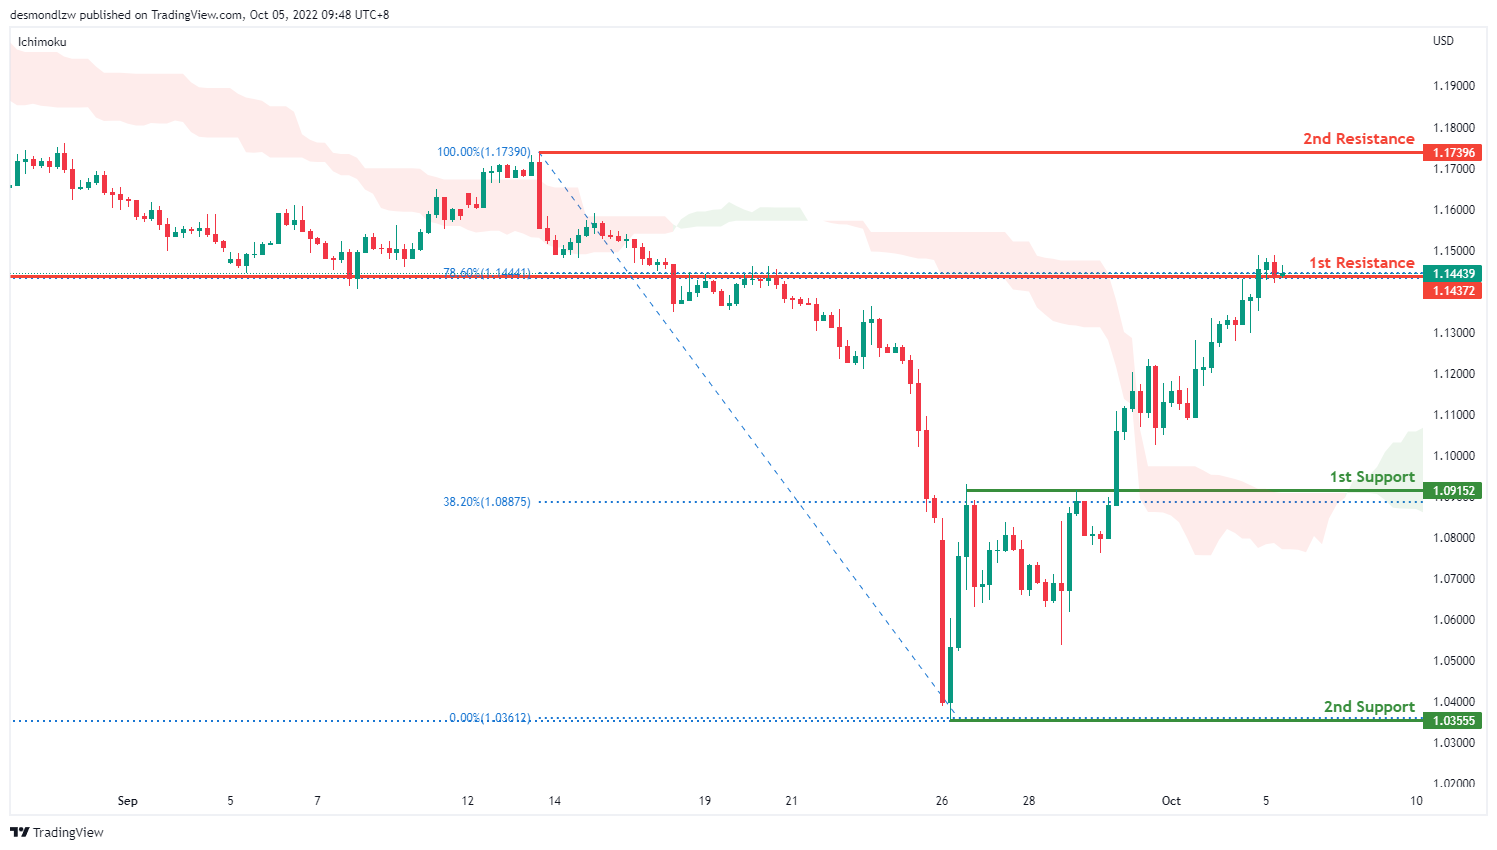
On the H4 time frame, prices have bounced off the support level and are moving in an ascending manner, we are slightly bullish. Price is moving toward the first resistance at 1.1443, where the 78.6% retracement and overlap resistance sits. If it breaks this level, its bullish momentum will bring price to second resistance at 1.1739 where the previous swing high sits. Alternatively, price could pull back to test the first support at 1.0915, where the 38.2% retracement sits then the second support at 1.0355 where the 138.2% extension sits
Areas of consideration:
- H4 1st resistance at 1.1443
- H4 1st support at 1.10915
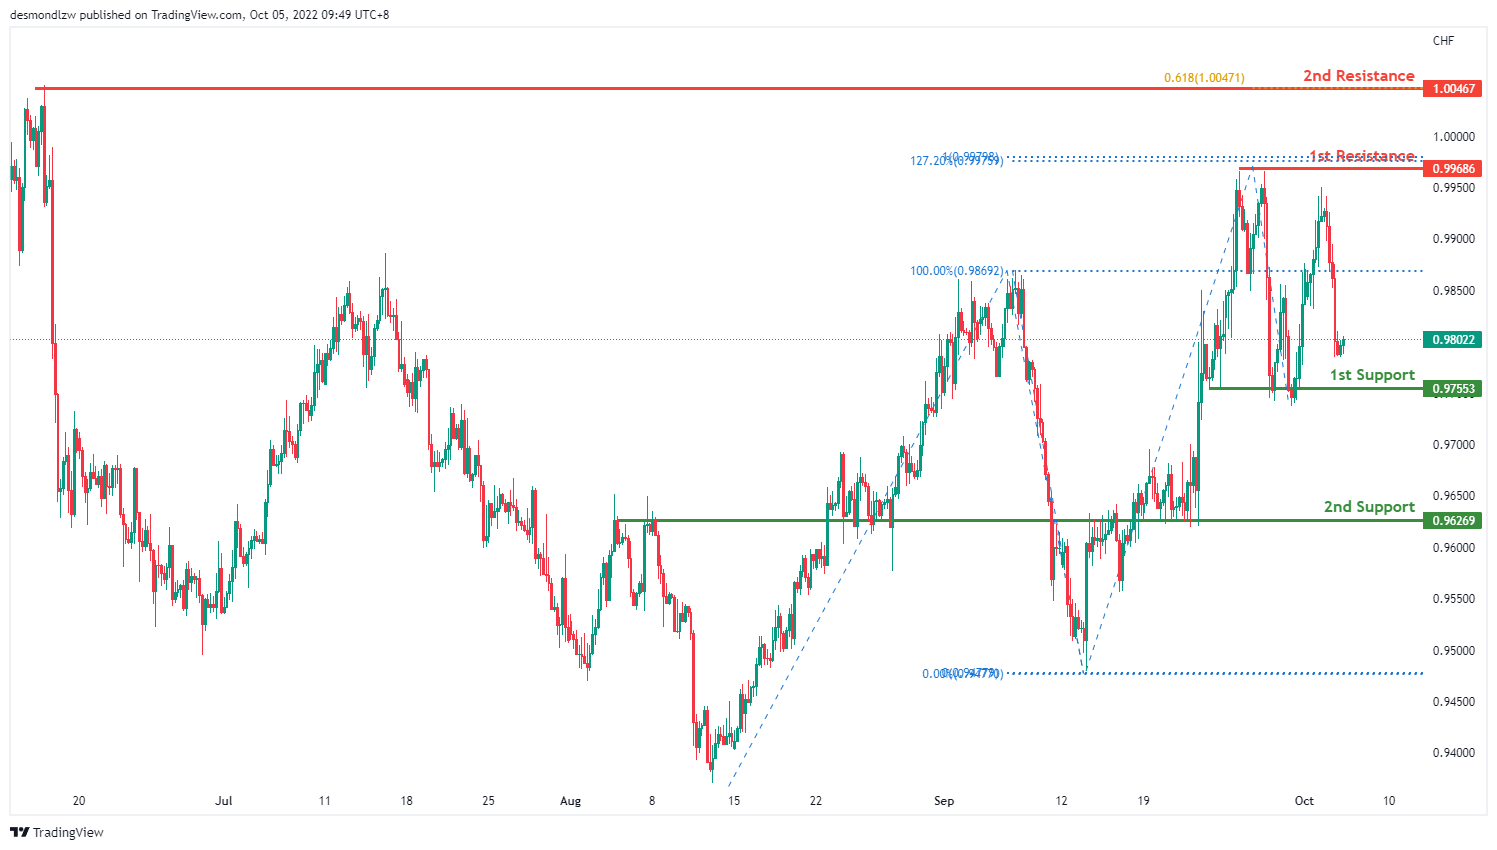
USD/CHF:
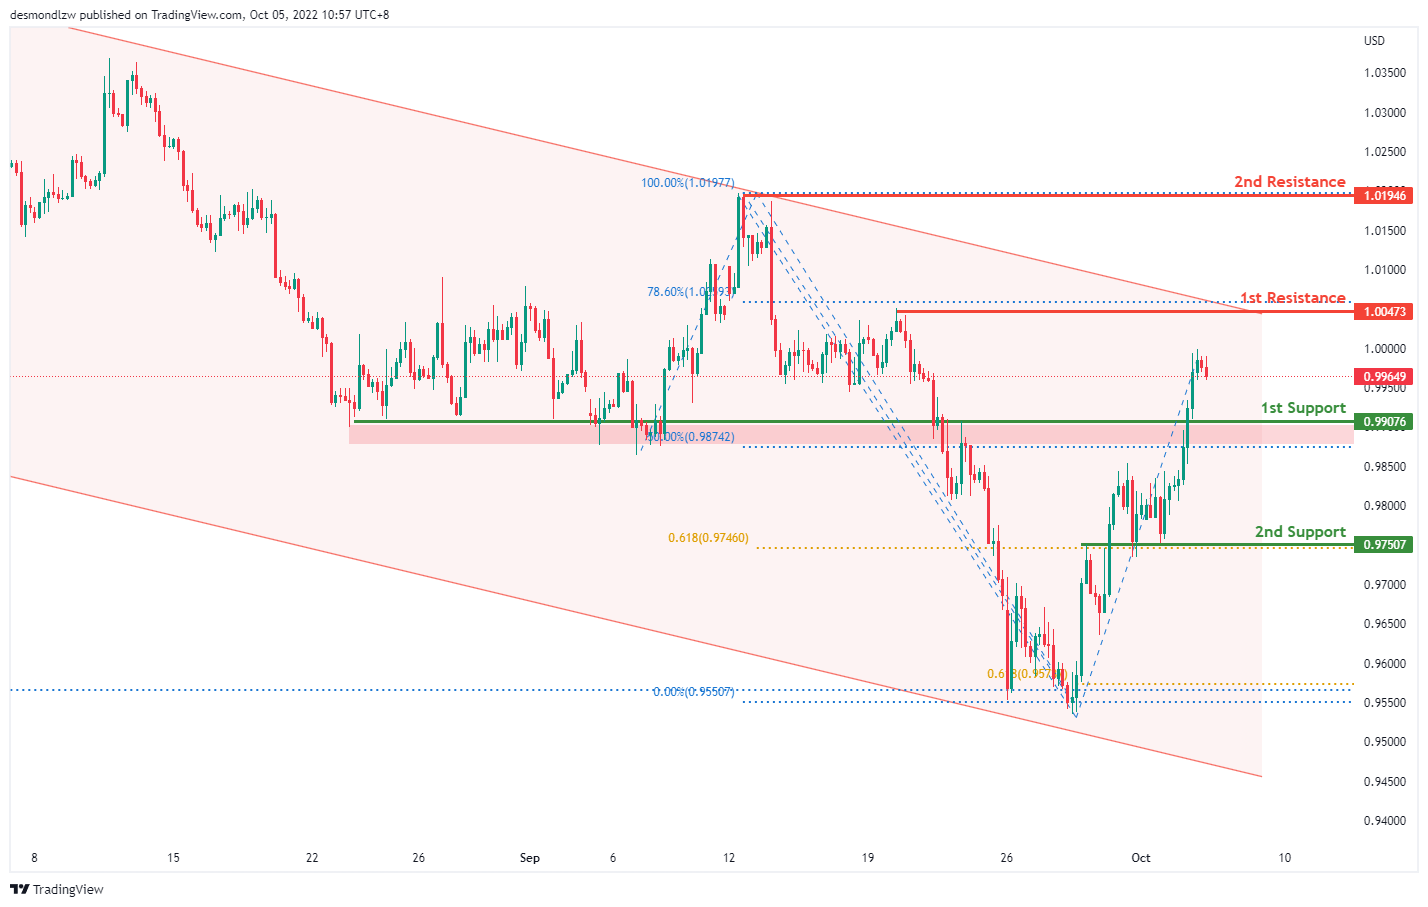
On the H4 chart, price has rejected the resistance level and is moving in a descending manner hence we are bearish bias- prices are moving toward the first support at 0.9755 where the previous swing low sits. If bearish momentum continues, it will bring price down to the second support at 0.9626 where the overlap support sits. Alternatively, price could bounce back to test the first resistance at 0.9968 where the 127.2% extension and 100% projection sits then to test the second resistance at 1.0046
Areas of consideration
- H4 1st support at 0.9755
- H4 1st resistance at 0.9968
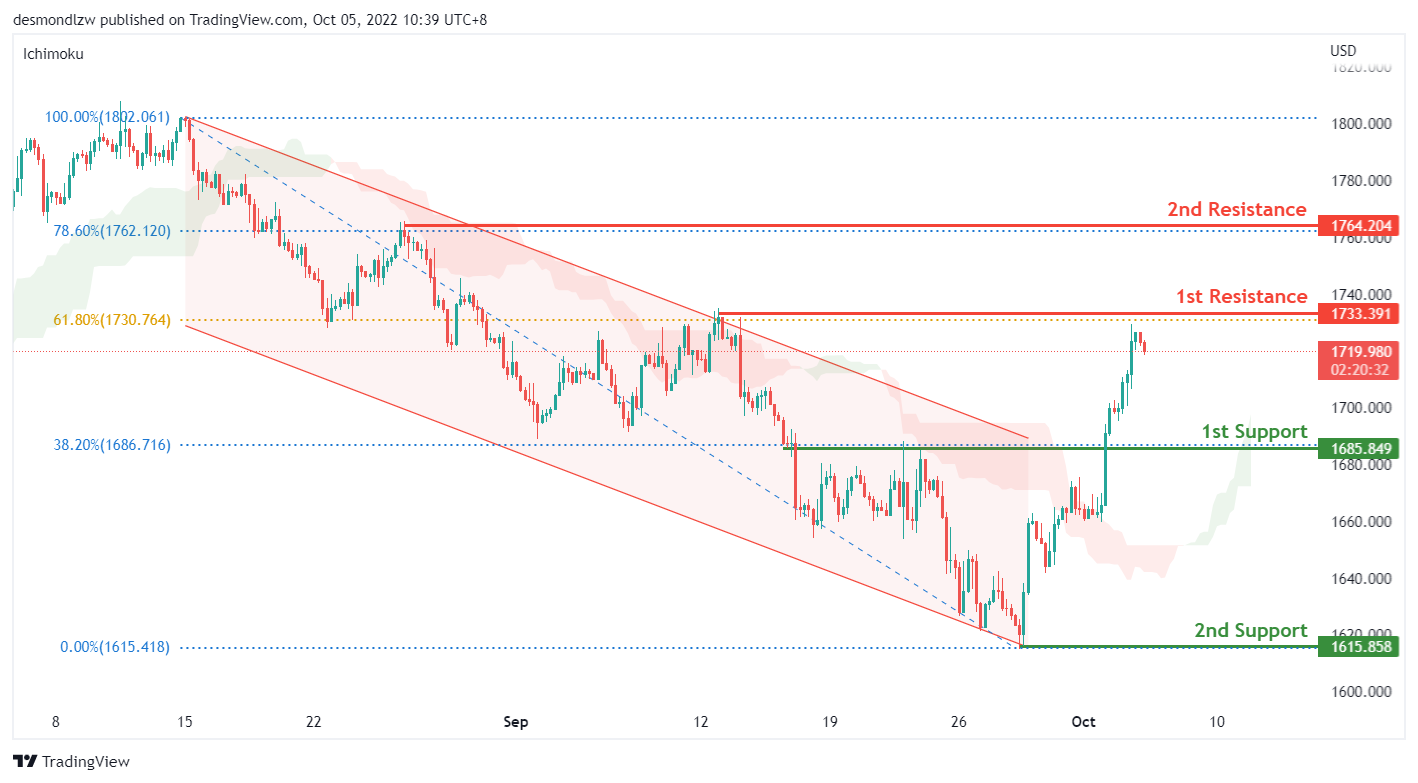
XAU/USD (GOLD):
On the H4, price trades strongly higher above the ichimoku cloud as it approaches the 1st resistance of 1733 which is the previous swing high from 12 September 2022 and the 61.80% fibonacci retracement level. We continue to have a bullish bias that price could trade higher to the 2nd resistance of 1764 which is in line with the 78.60% fibonacci retracement level and previous swing high from end August 2022. However, before the move higher, the price could first retrace towards the risk level of 1708 which is the 50% fibonacci retracement level.
Areas of consideration:
- H4 time frame, 1st resistance at 1733.39
- H4 time frame, 1st support at 1685
- H4 time frame, 2nd resistance at 1764
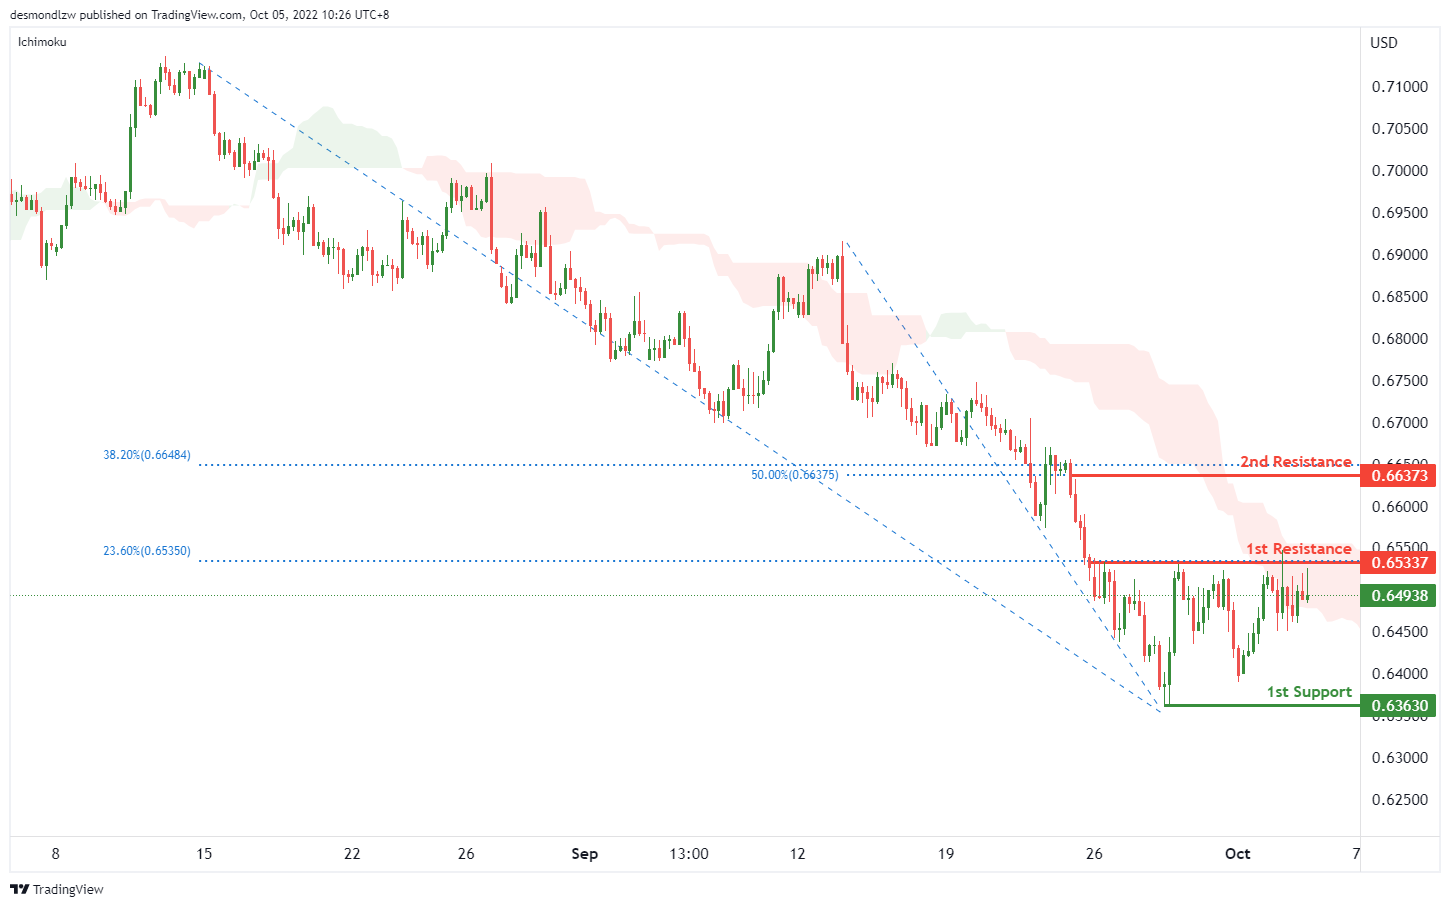
AUD/USD:
On the H4, with the price testing the 1st resistance at 0.65337, where the 23.6% fibonacci retracement sits, and crossing ichimoku cloud, if the price can break the 1st resistance successfully, we can expect the price rise to the 2nd resistance at 0.66373, which is in line with the 50% and 38.2% fibonacci retracement. Alternatively, the price may drop back to the 1st support at 0.63630, where the swing low is.
Areas of consideration
- H4, 1st resistance at 0.65337
- H4, 2nd resistance at 0.66373
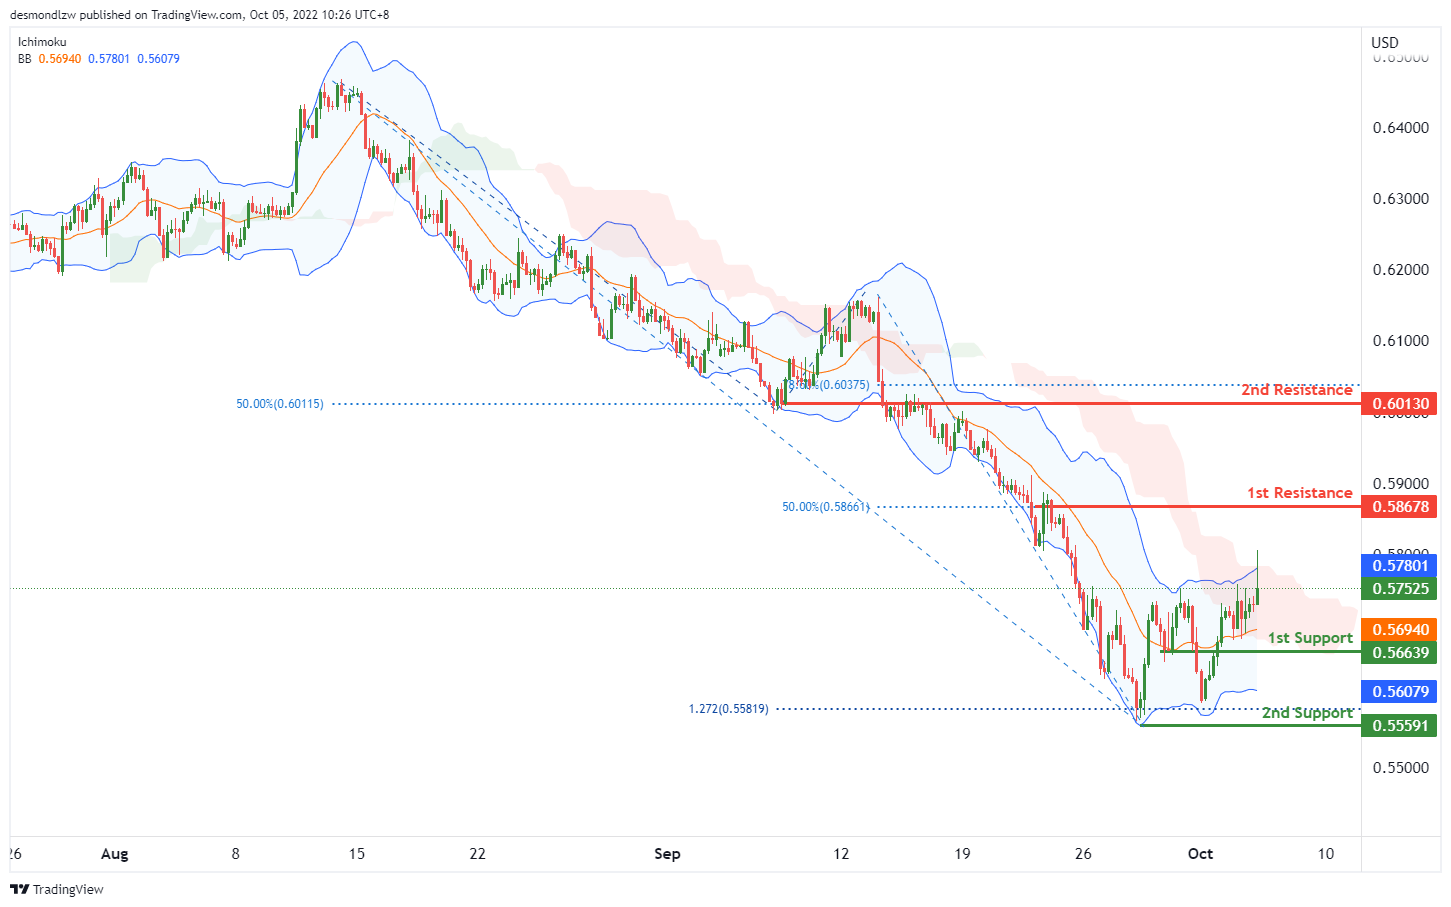
NZD/USD:
On the H4, with the price crossing the ichimoku cloud and still within the bollinger bands, we have a bullish bias that the price may rise to the 1st resistance at 0.58678, which is in line with the 50% fibonacci retracement. If the 1st resistance is broken, we can expect the price to rise to the 2nd resistance at 0.60130, where the 78.6% fibonacci retracement and 50% fibonacci retracement are. Alternatively, the price may drop to the 1st support at 0.56639, where the previous swing low is. If the 1st support is broken, the next support level could be at 0.55591, which is in line with the significant swing low.
Areas of consideration:
- H4 time frame, 1st resistance at 0.58678
- H4 time frame, 1st support at 0.56639
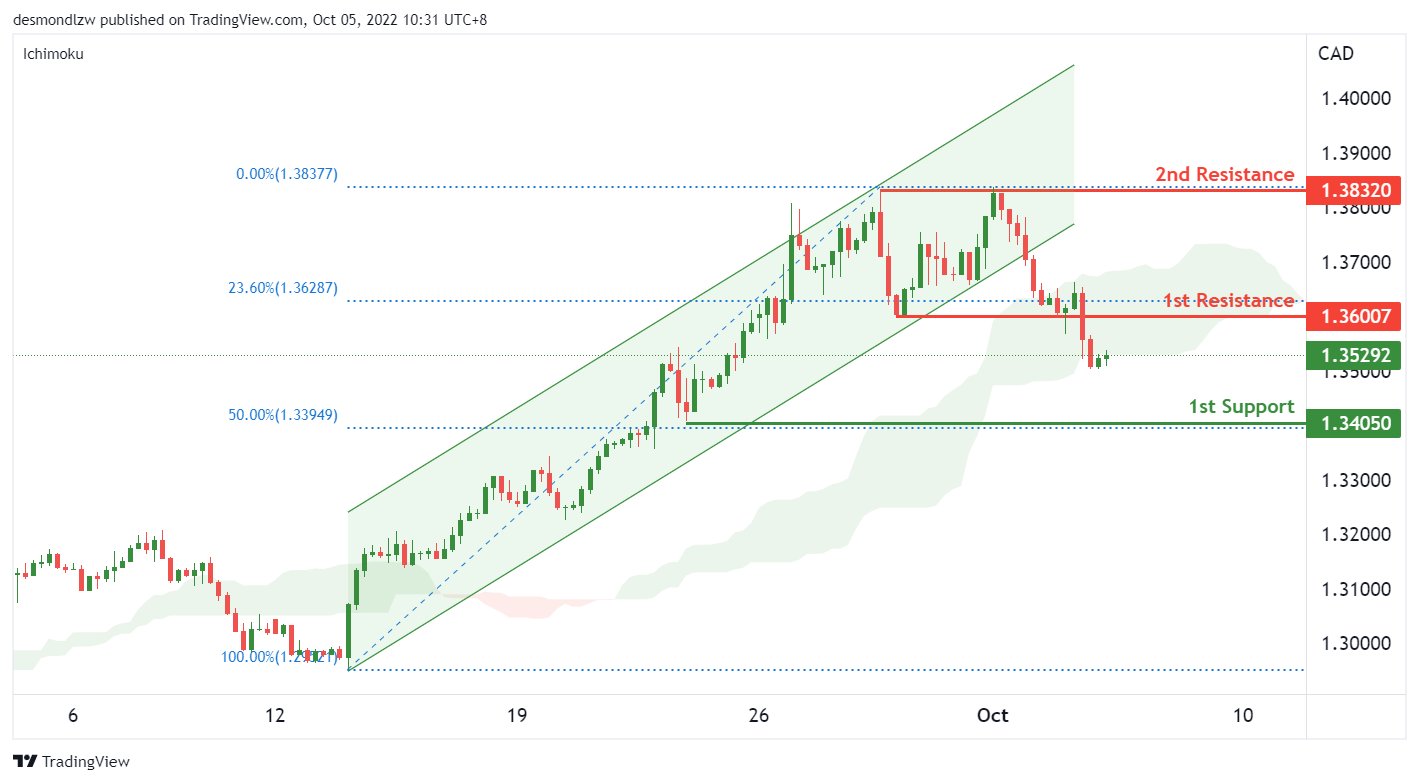
USD/CAD:
On the H4, the price broke lower from the support turned 1st resistance level of 1.36 which is in line with the 23.60% fibonacci retracement level. With the price trading below the ascending channel and the ichimoky cloud, we have a short term bearish bias. Price could fall to the 1st support of 1.34 which is in line with the 50% retracement level and the previous swing low. However, the price could retest the 1st resistance before trading lower. Alternatively, if price breaks above the 1st resistance level, the USDCAD could trade higher towards the 2nd resistance of 1.3832 which is the previous swing high.
Areas of consideration:
- H4 time frame, 1st resistance at 1.36
- H4 time frame, 1st support at 1.34
- H4 time frame, 2nd resistance at 1.3832
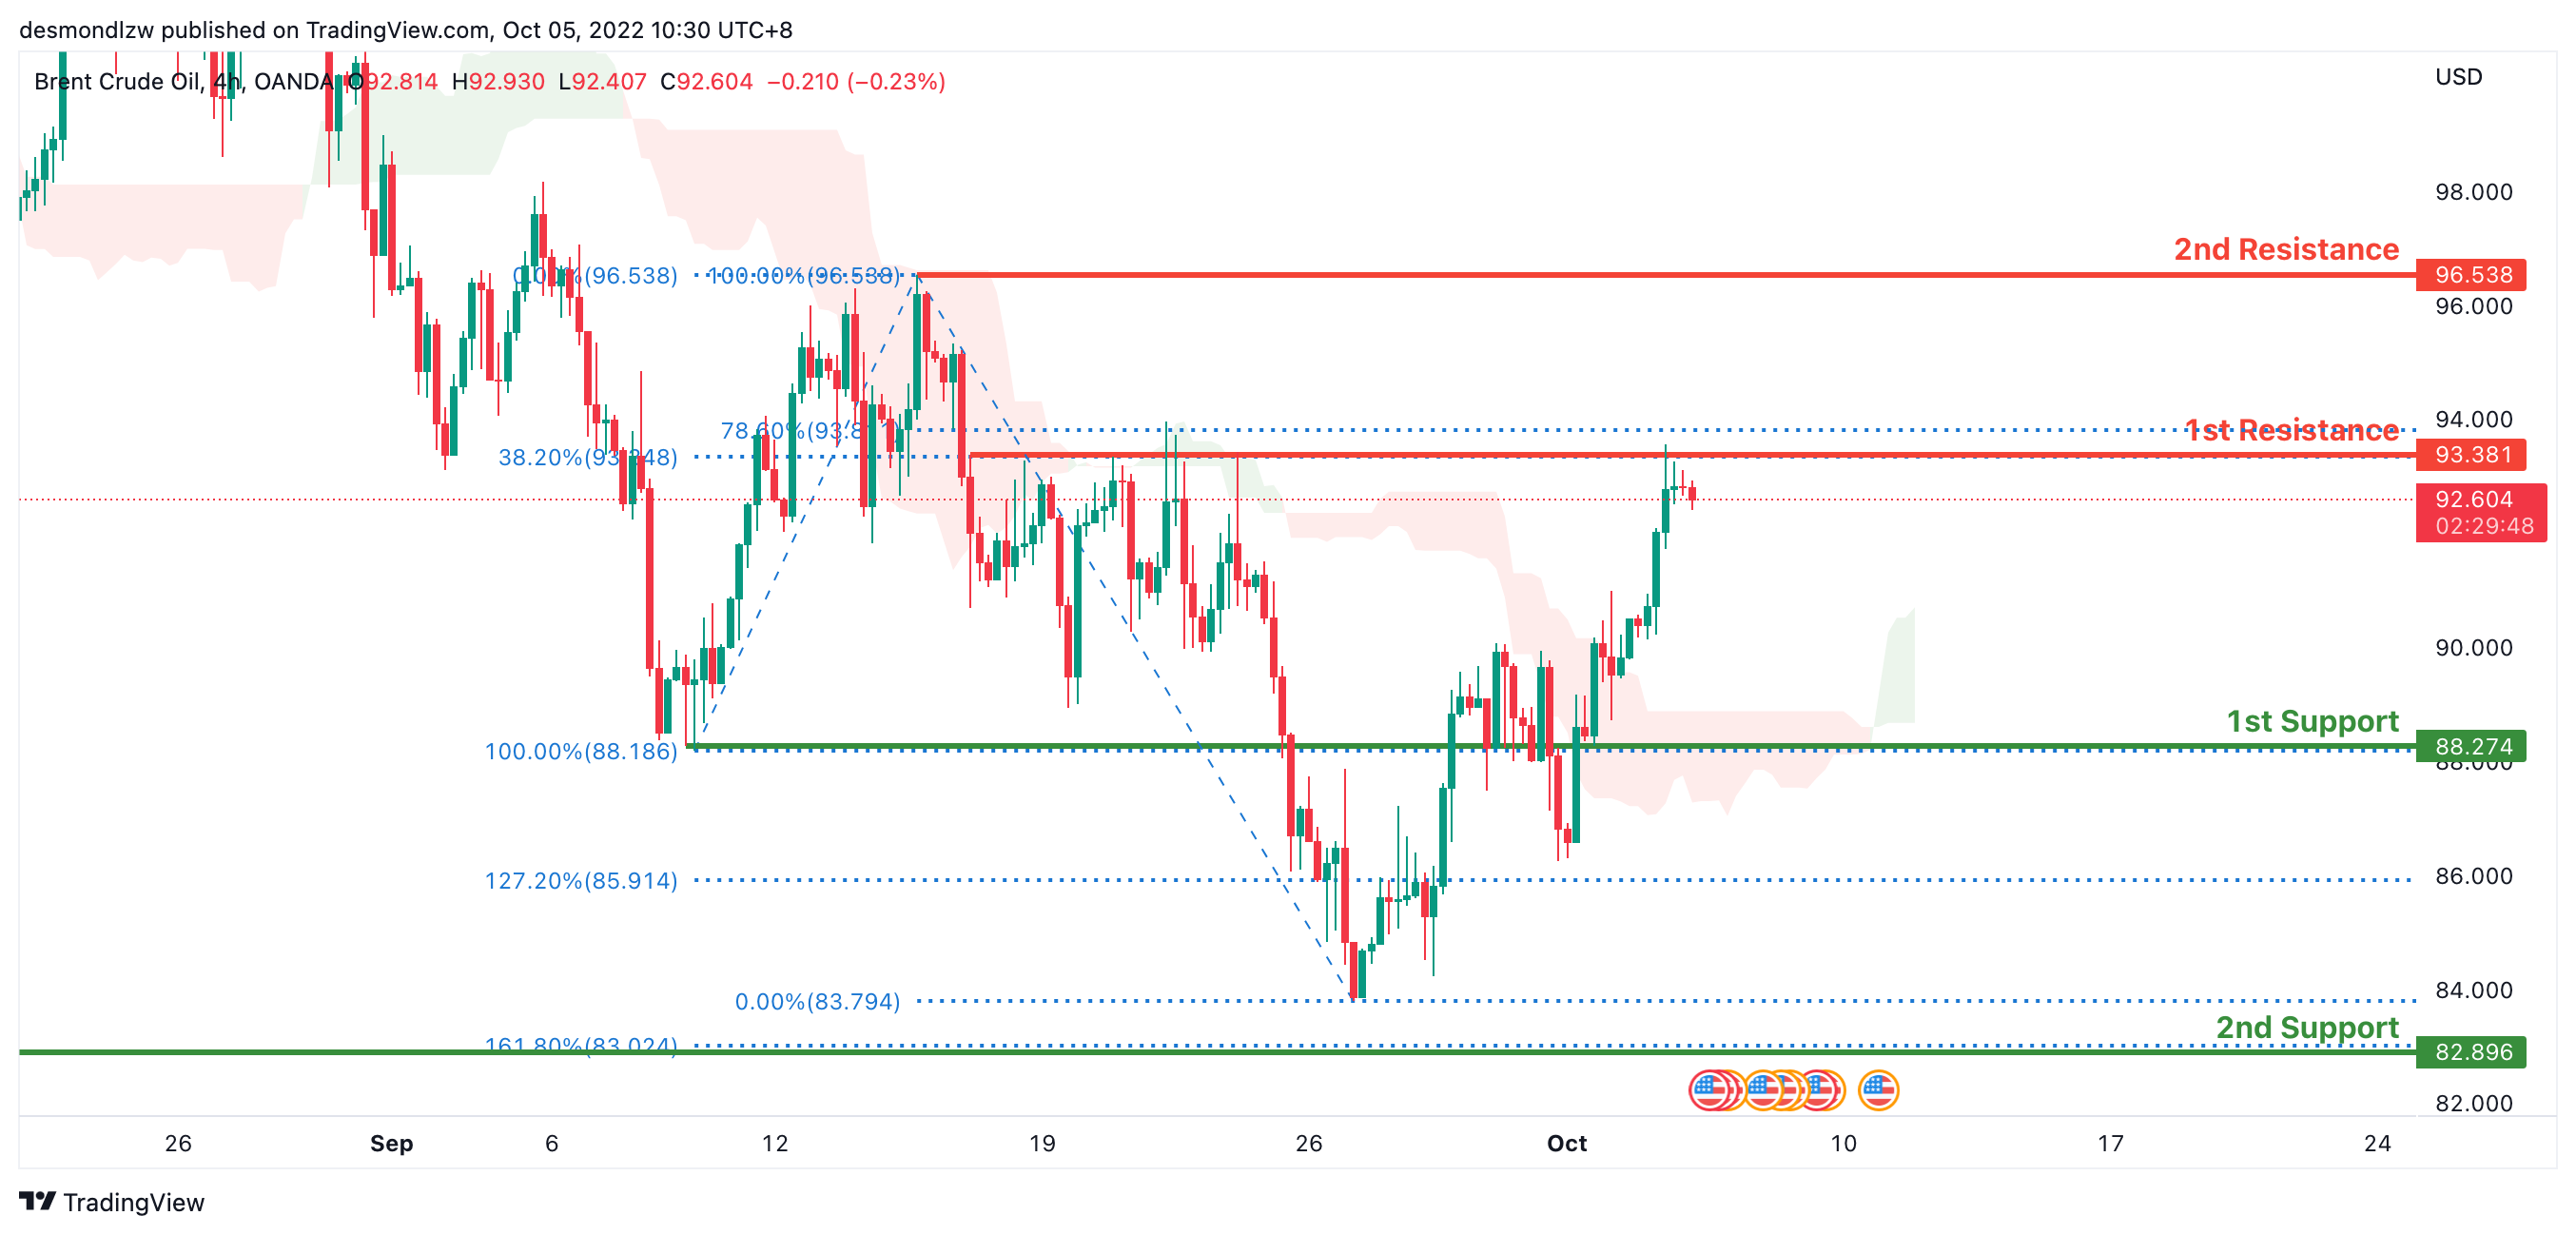
OIL:
Oil is in a bearish trend on the 4-hour chart. However, price is now above the Ichimoku cloud, indicating that the market is bullish at the moment. Price has broken through the first support level, which has a 100% Fibonacci extension and served as the previous swing low, at 88.788. Overnight, price has tapped onto the first resistance level, where the 38.2% Fibonacci extension line is at 93.381. Expecting price to consolidate around this area.
Areas of consideration:
- H4 time frame, 1st resistance at 93.381
- H4 time frame, 1st support at 88.366
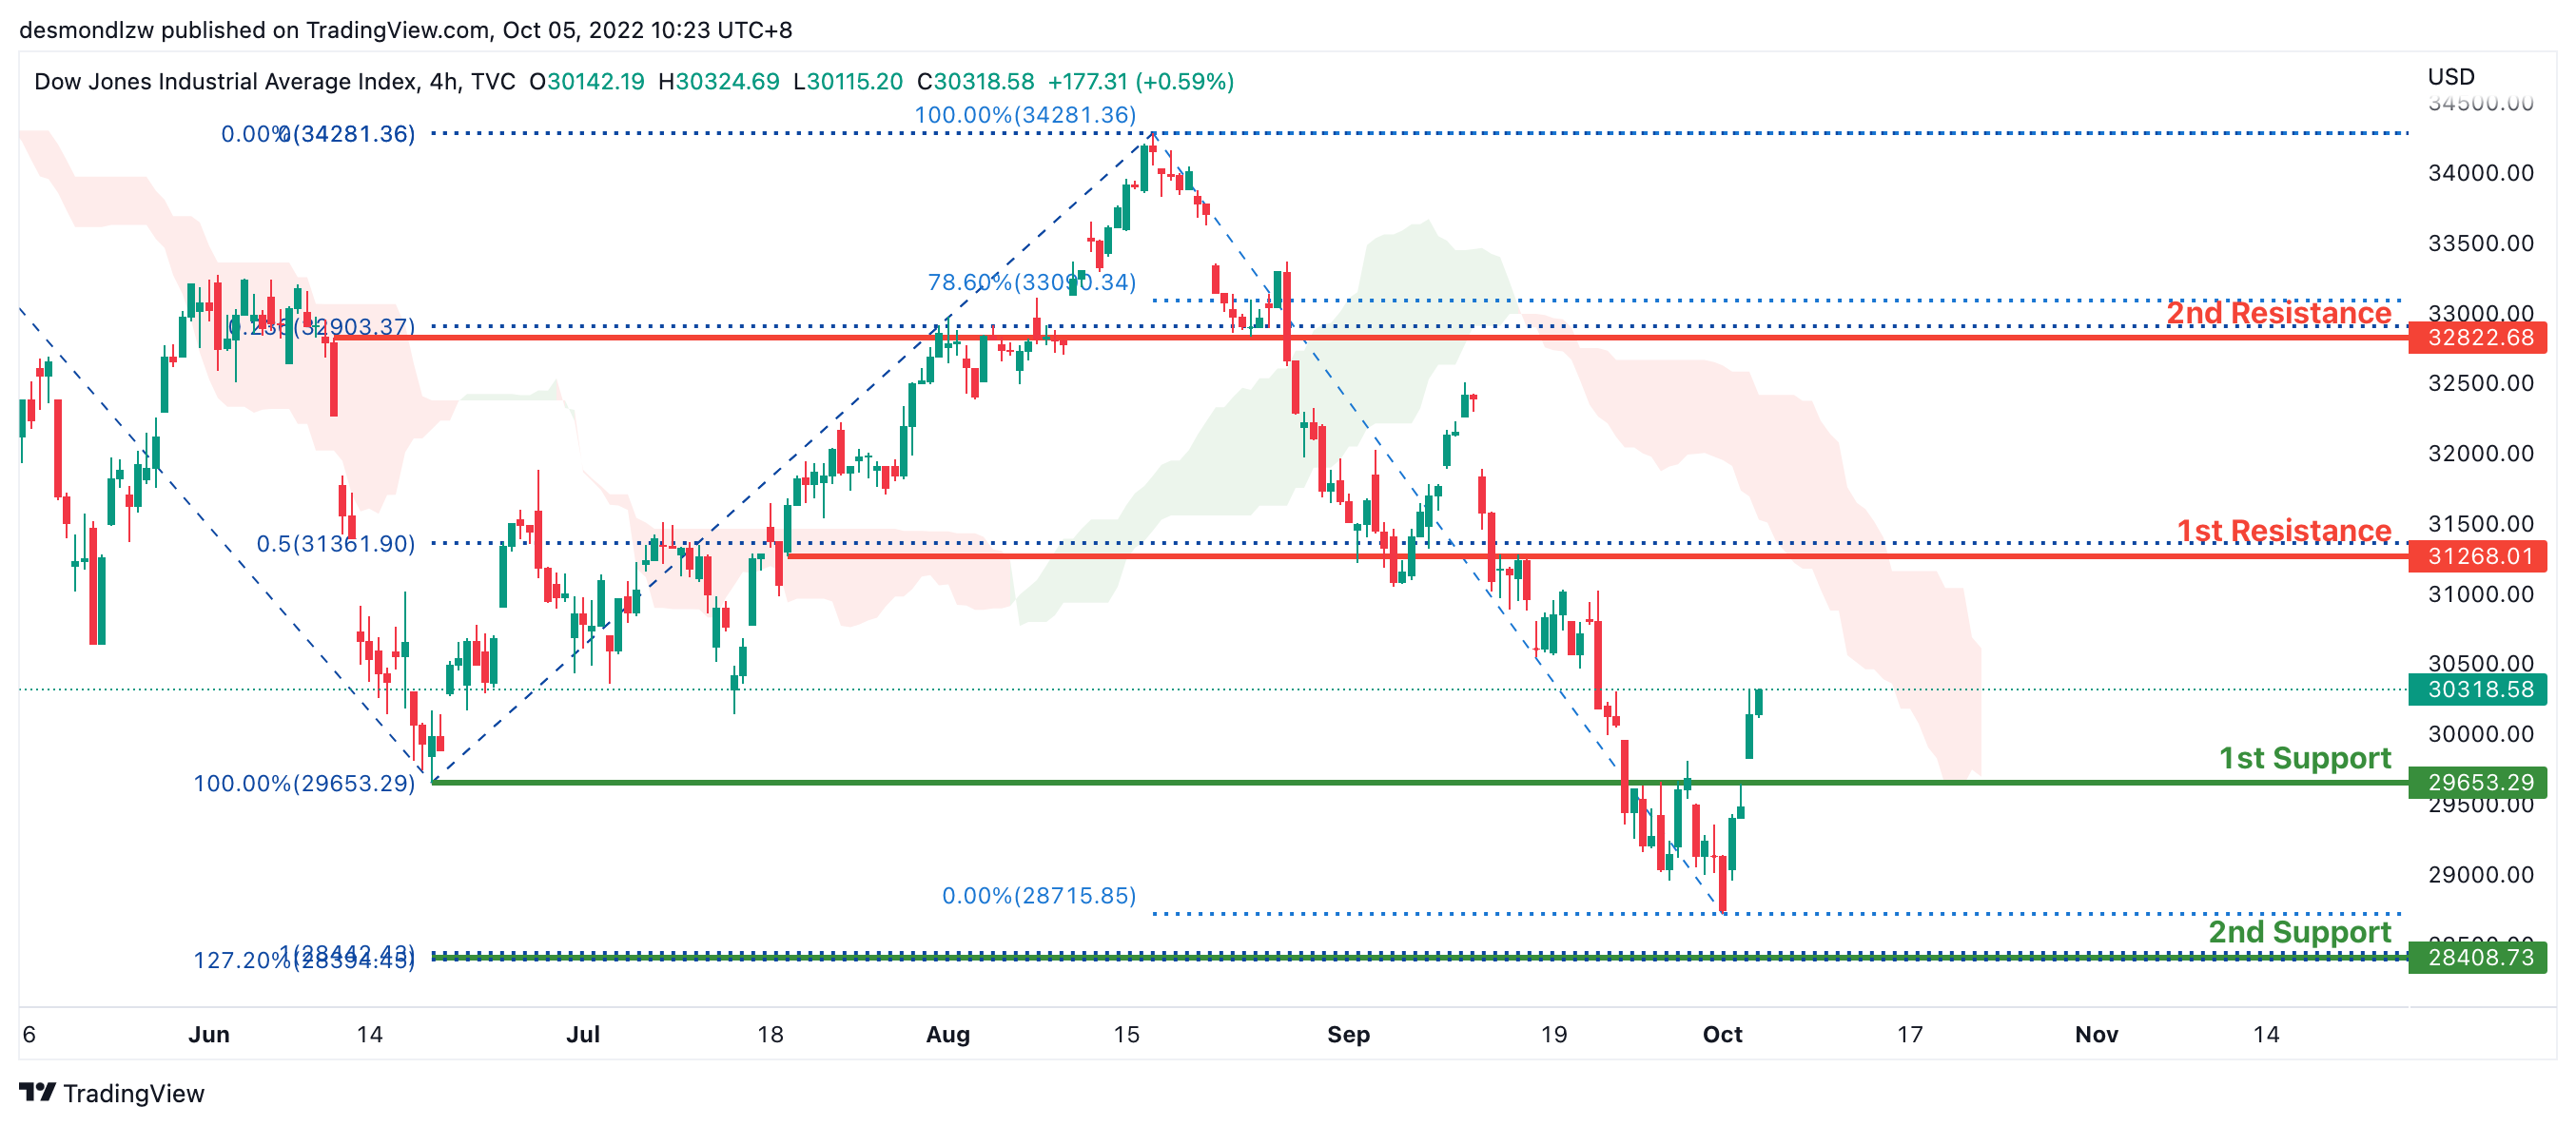
Dow Jones Industrial Average:
The price is moving downward on the H4 chart. The first support level at 29653.29 has also been breached by the price. Price moved away from the first support level overnight, continuing its upward bullish momentum. The initial resistance level around 28422.42, which is where the 50% Fibonacci line is situated, is where price is anticipated to move.
Areas of consideration:
- H4 time frame, 1st support at 29653.29
- H4 time frame, 1st resistance at 31268.01
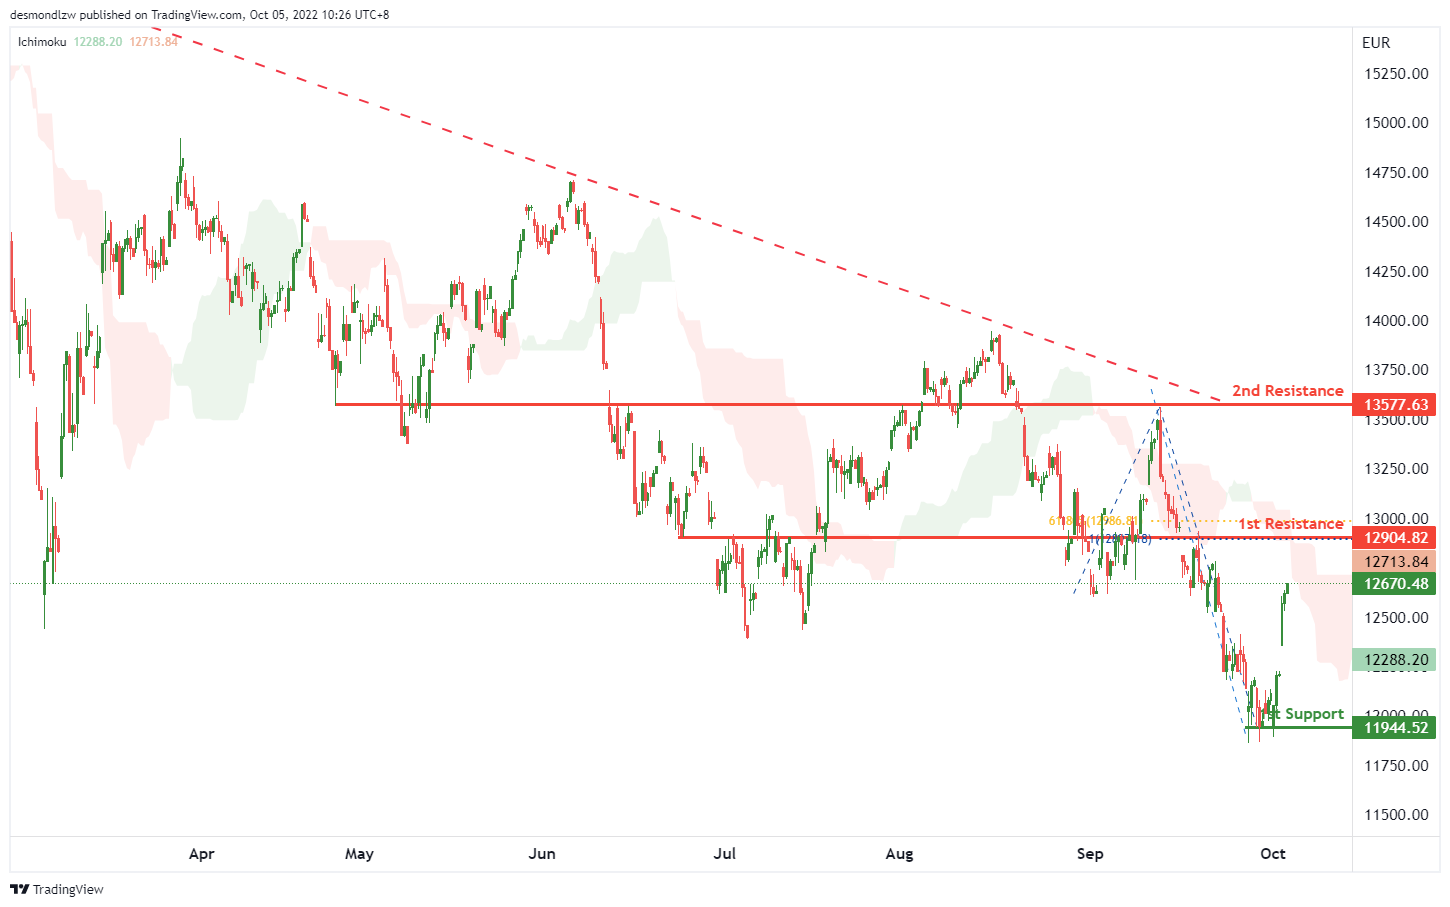
DAX:
On the H4, with the price bouncing from the 1st support at 11944.52, the price may test the 1st resistance at 12904.82, which is in line with the 100% fibonacci projection and 61.8% fibonacci retracement. If the 1st resistance is broken, the price may rise to the 2nd resistance at 13577.63, where the overlap resistance is. Alternatively, the price may drop back to the 1st support at 11944.52, which is in line with the swing low.
Areas of consideration:
- H4 time frame, 1st resistance at 12904.82
- H4 time frame, 2nd resistance at 13577.63
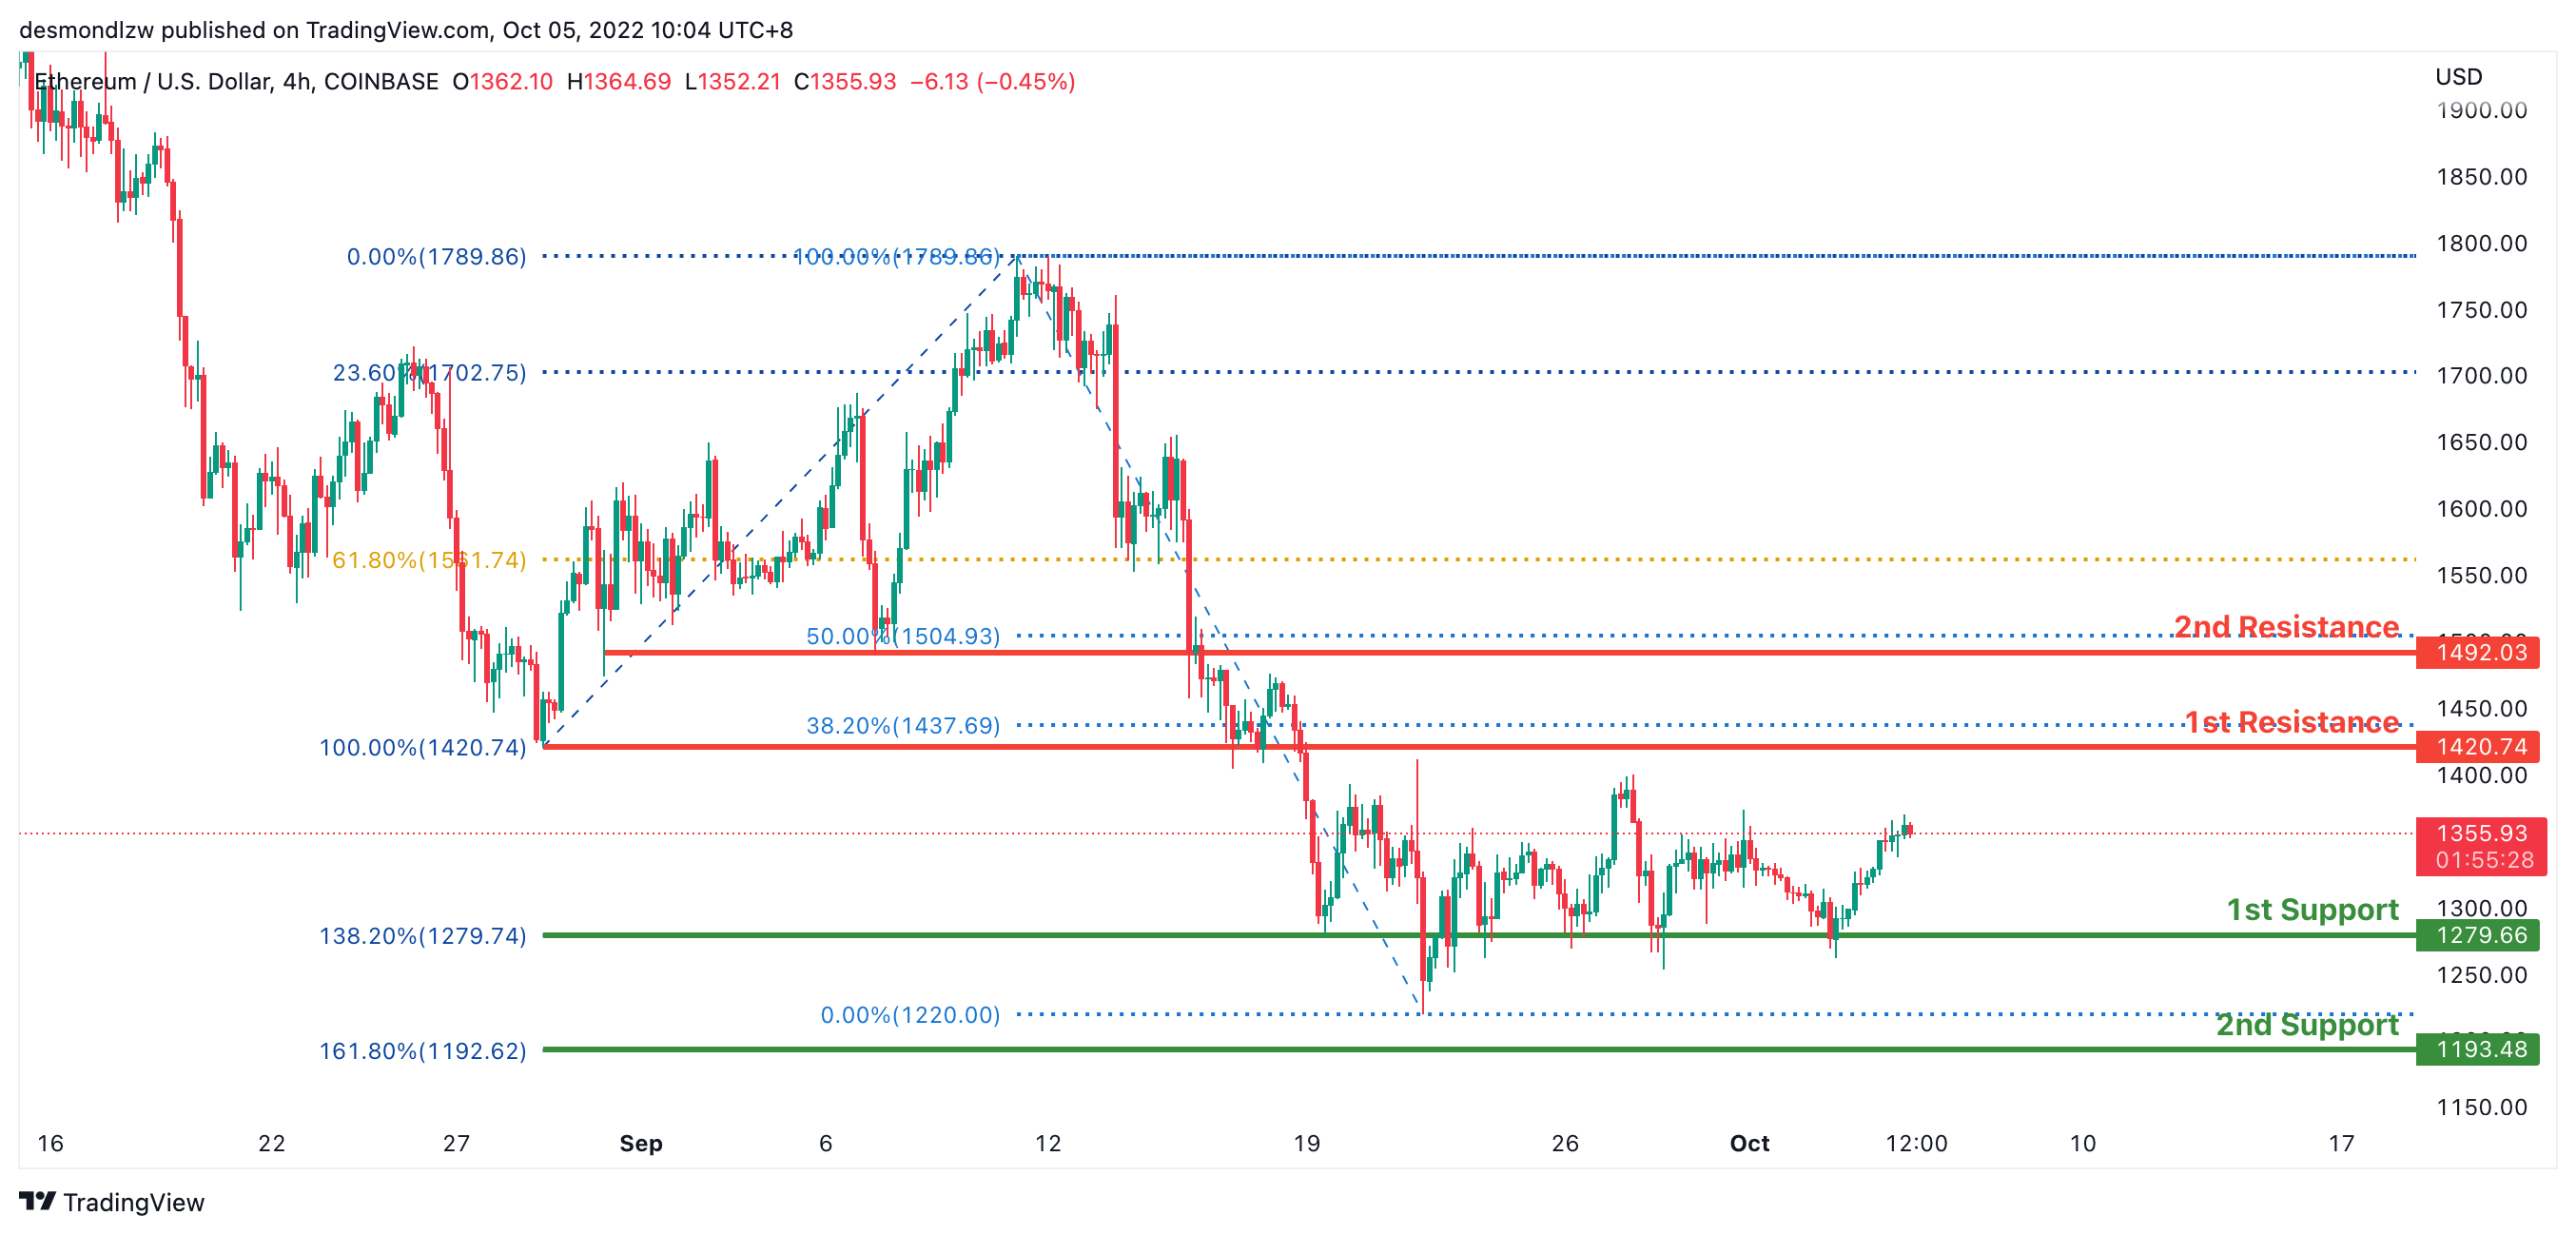
ETHUSD:
The overall price of ETHUSD is quite bearish on the H4. Price has now closed above the Ichimoku cloud, suggesting a potential short-term trend change. Overnight, ETHUSD kept moving upward from the first support level at 1279.74, which is the 138.2% Fibonacci extension line. We anticipate a price reversal to the 100% Fibonacci and 38.2% Fibonacci lines at 1420.74, which is the first resistance line.
Areas of consideration:
- H4 time frame, 1st resistance of 1420.74
- H4 time frame, 1st support at 1279.00
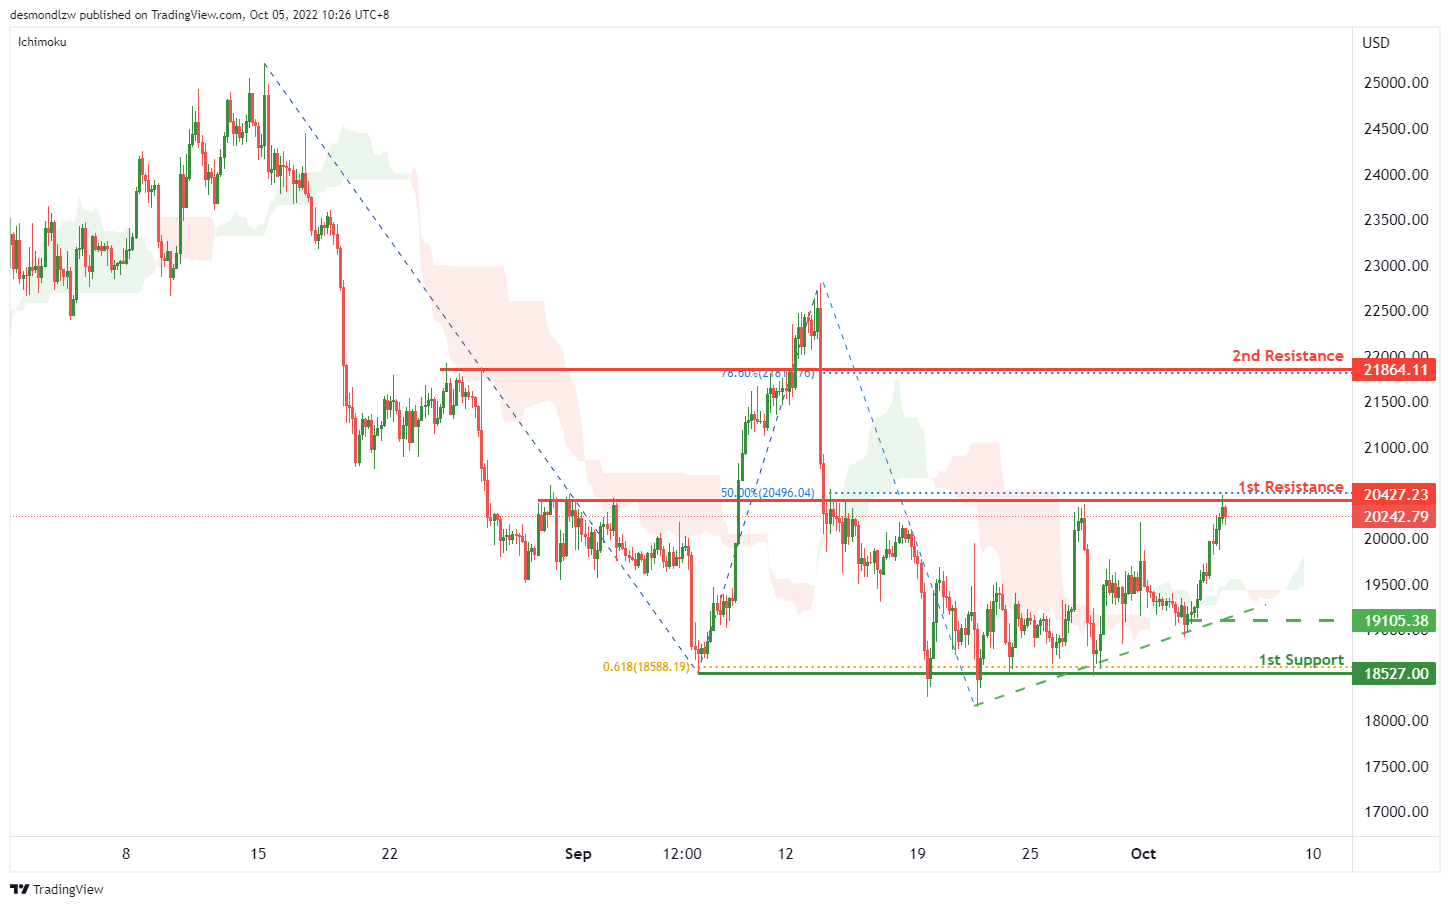
BTCUSD:
On the H4, price is showing a short term ascending trendline and testing the 1st resistance at 20427.23, where the overlap resistance and 50% fibonacci retracement are. If the 1st resistance is broken, the next resistance could be at 21864.11, which is in line with the 78.6% fibonacci retracement. Alternatively, the price may pull back from the 1st resistance and drop to the 1st support at 18527, which is in line with the swing lows and 61.8% fibonacci projection. Take note the 19105.38 could be the intermediate support.
Areas of consideration:
- H4 time frame, 1st resistance at 20427.23
- H4 time frame, 2nd resistance at 21864.11
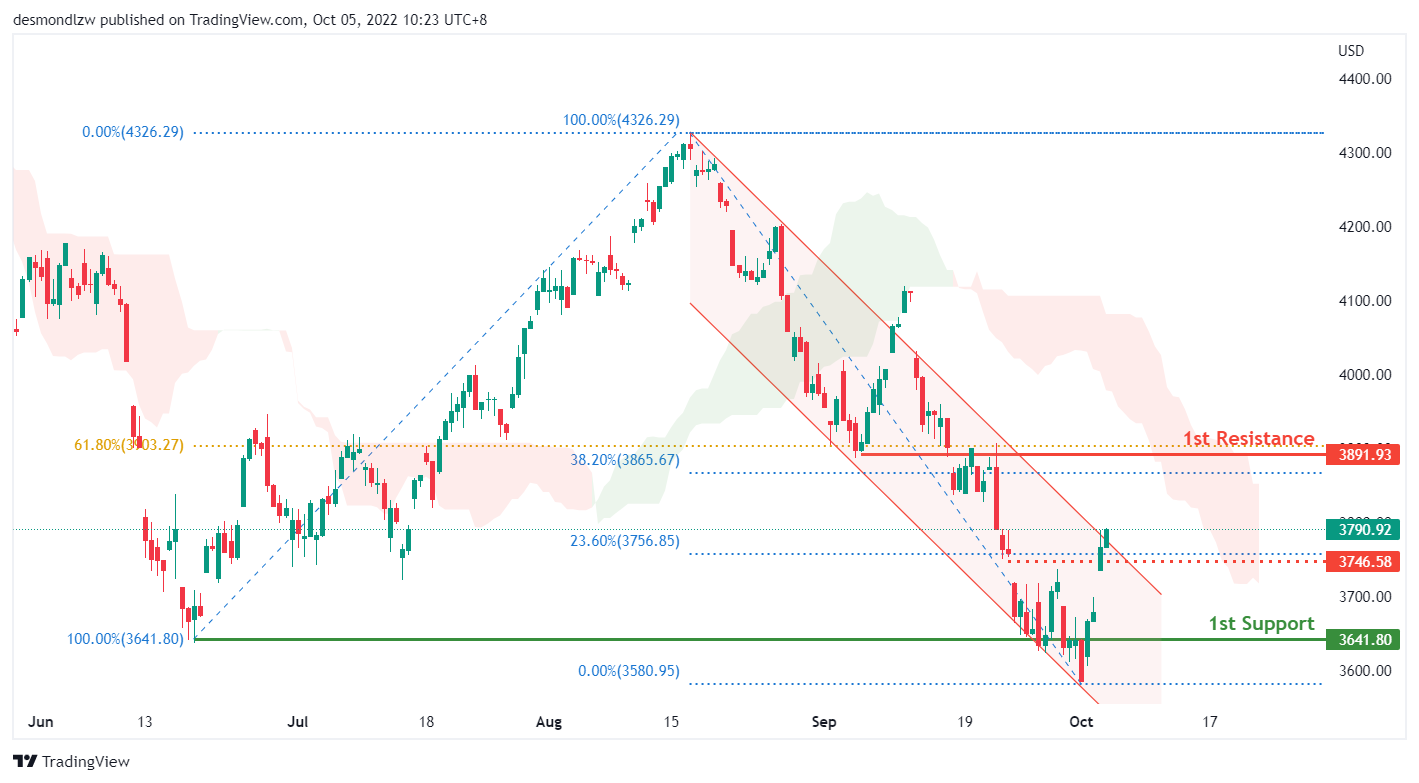
S&P 500:
On the H4, with the price trading higher from 1st support of 3642, previous swing low of June 2022 and the interim risk level of 3746.58 which is in line with the 23.60% fibonacci retracement level, we continue to have a bearish bias. With the price breaking out of the descending channel but below the ichimoku cloud, the price could continue trading higher to the 1st resistance of 3892.
Areas of consideration:
- H4 time frame, 1st resistance at 3892
- H4 time frame, 1st support at 3642


