
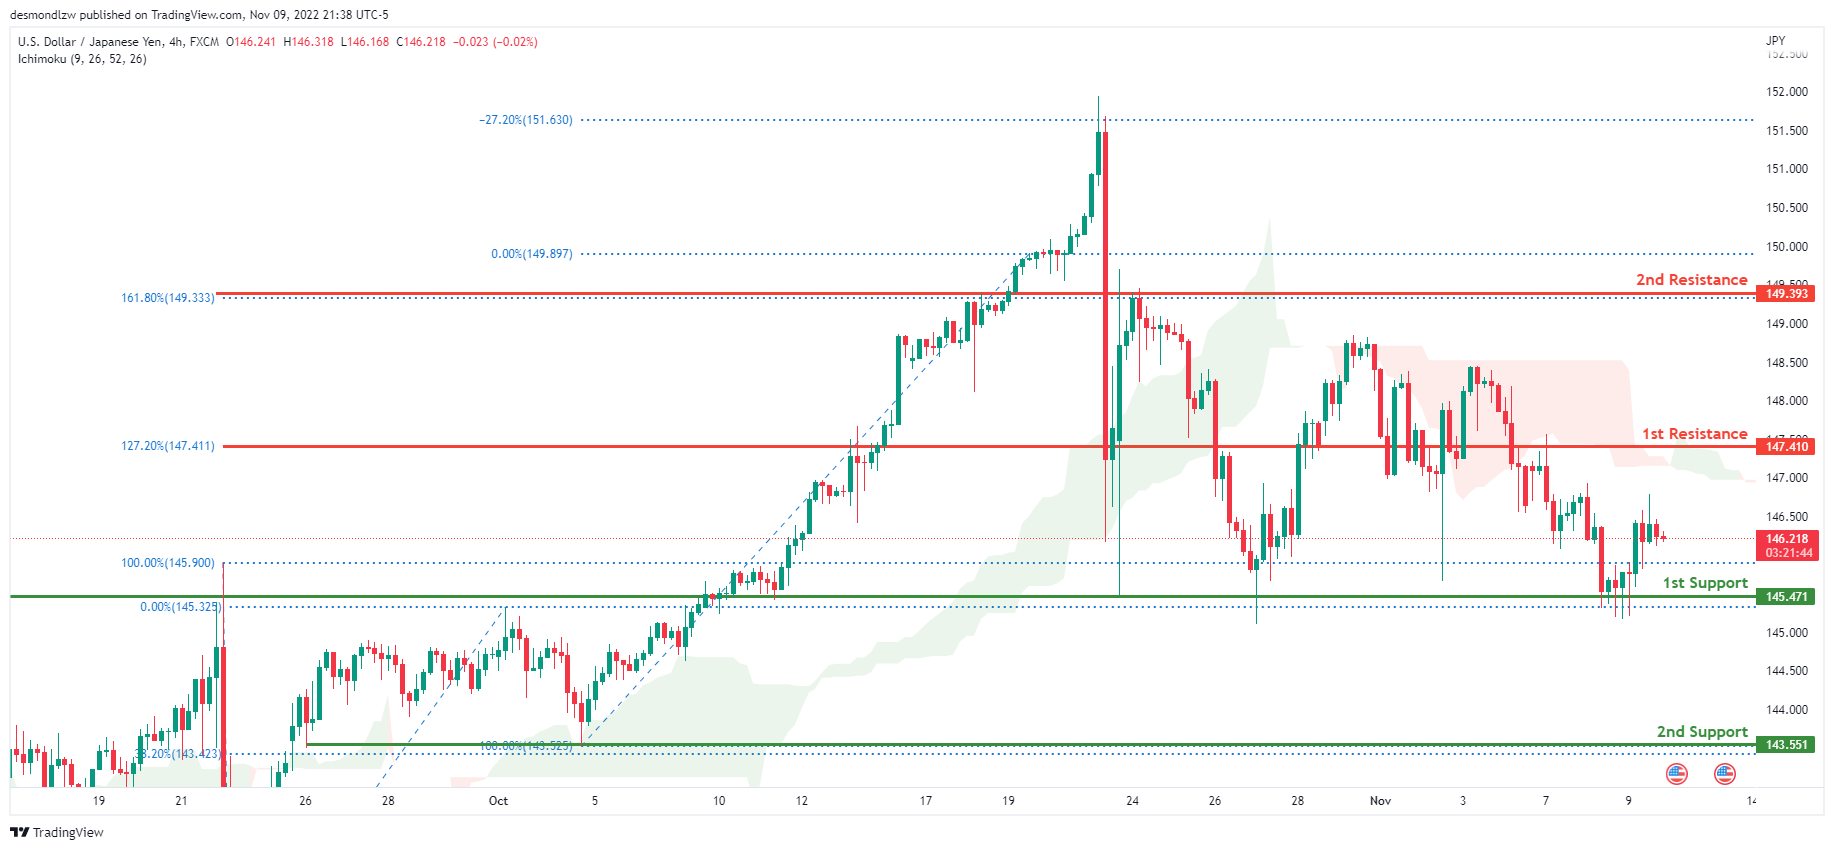
USD/JPY:
The current general bias for USDJPY on the H4 chart is bearish. To add confluence to this, the price is below the Ichimoku cloud which indicates a bearish market. Overnight, USDJPY had some bullish momentum with price heading upwards away from the 1st support line. Price is currently trading at 146.253 at time of writing. If the bearish momentum continues, expect USDJPY to break the 1st support line at 145.471, where the 100% and 0% Fibonacci lines are located and head towards the 2nd support line at 143.551 where the 38.2% and 100% Fibonacci lines are located. In an alternative scenario, price could break above the 1st resistance and head towards the 2nd resistance at 149.393 where the 161.8% and 0% Fibonacci lines are located.
Areas of consideration:
- H4 time frame, 1st resistance at 147.410
- H4 time frame, 1st resistance at 149.393
- H4 time frame, 1st support at 145.471
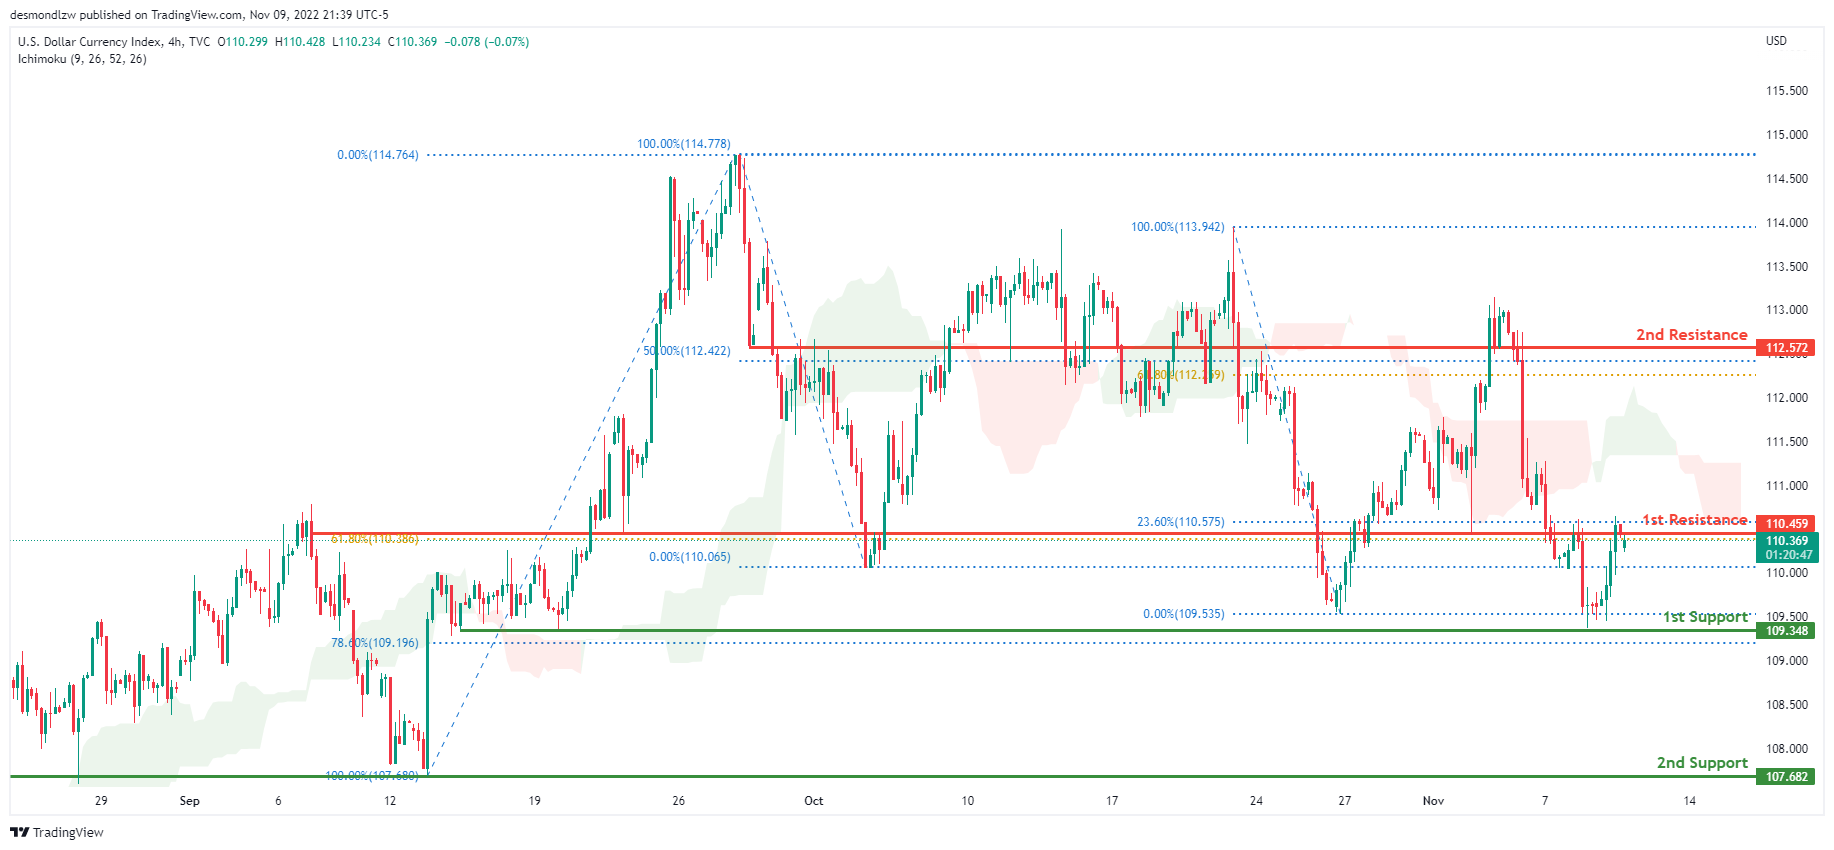
DXY:
On the H4 chart, the overall bias for DXY is bearish. To add confluence to this, the price is below the Ichimoku cloud which indicates a bearish market. Overnight, price had bullish momentum upwards with the price closing just under the 1st resistance at 110.459 where the 61.8% and 23.6% Fibonacci lines are located. The price is currently trading at 110.335 at the time of writing. If this bearish momentum continues, price could head towards the 1st support line at 109.348 where the 78.6% Fibonacci line and previous low are located. In an alternative scenario, price could head back up and break the 1st resistance line before heading towards the 2nd resistance line at 112.572 where the 50% and 61.8% Fibonacci lines are located.
Areas of consideration:
- H4 time frame, 1st resistance at 110.459
- H4 time frame, 2nd resistance at 112.572
- H4 time frame, 1st support at 109.348
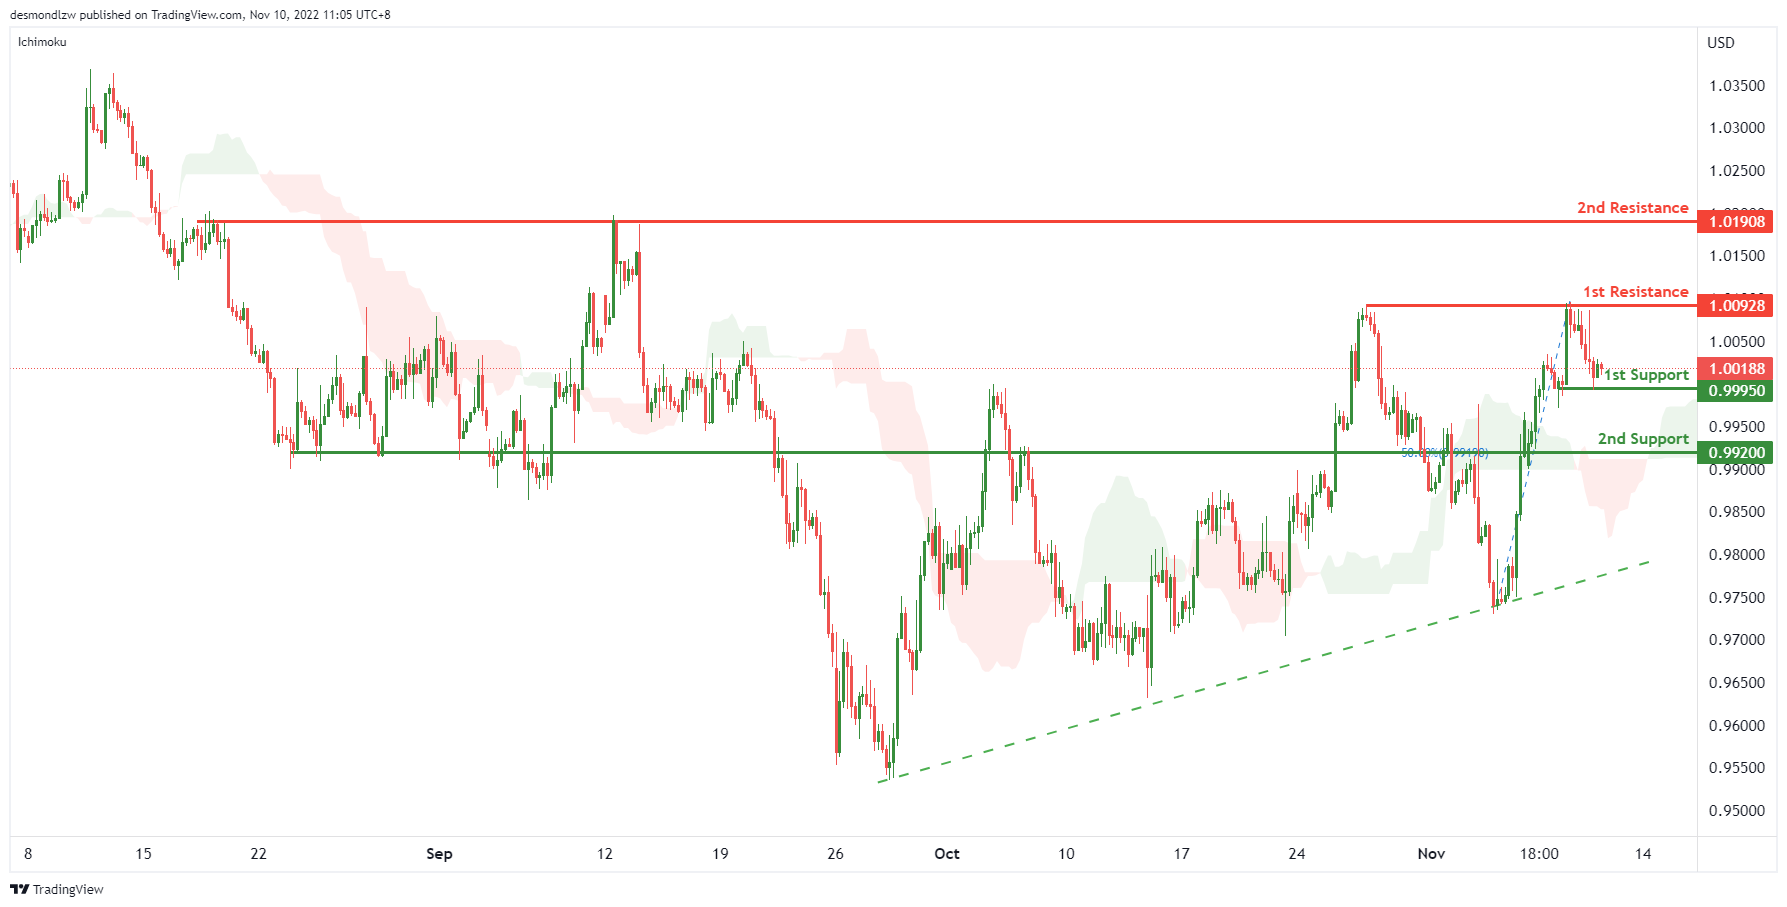
EUR/USD:
On H4, with the price moving above the ichimoku cloud and ascending trendline, we have a bullish bias that the price may rise to the 1st resistance at 1.00928, which is in line with the swing highs. If the 1st resistance is broken, the 2nd resistance is at 1.01908, where the previous swing highs are. Alternatively, the price may drop to the 1st support at 0.99950, where the previous swing low is. If the 1st support is broken, the 2nd support is at 0.99200, where the 50% fibonacci retracement sits.
Areas of consideration :
- H4 1st resistance at 1.00928
- H4 1st support at 0.99950
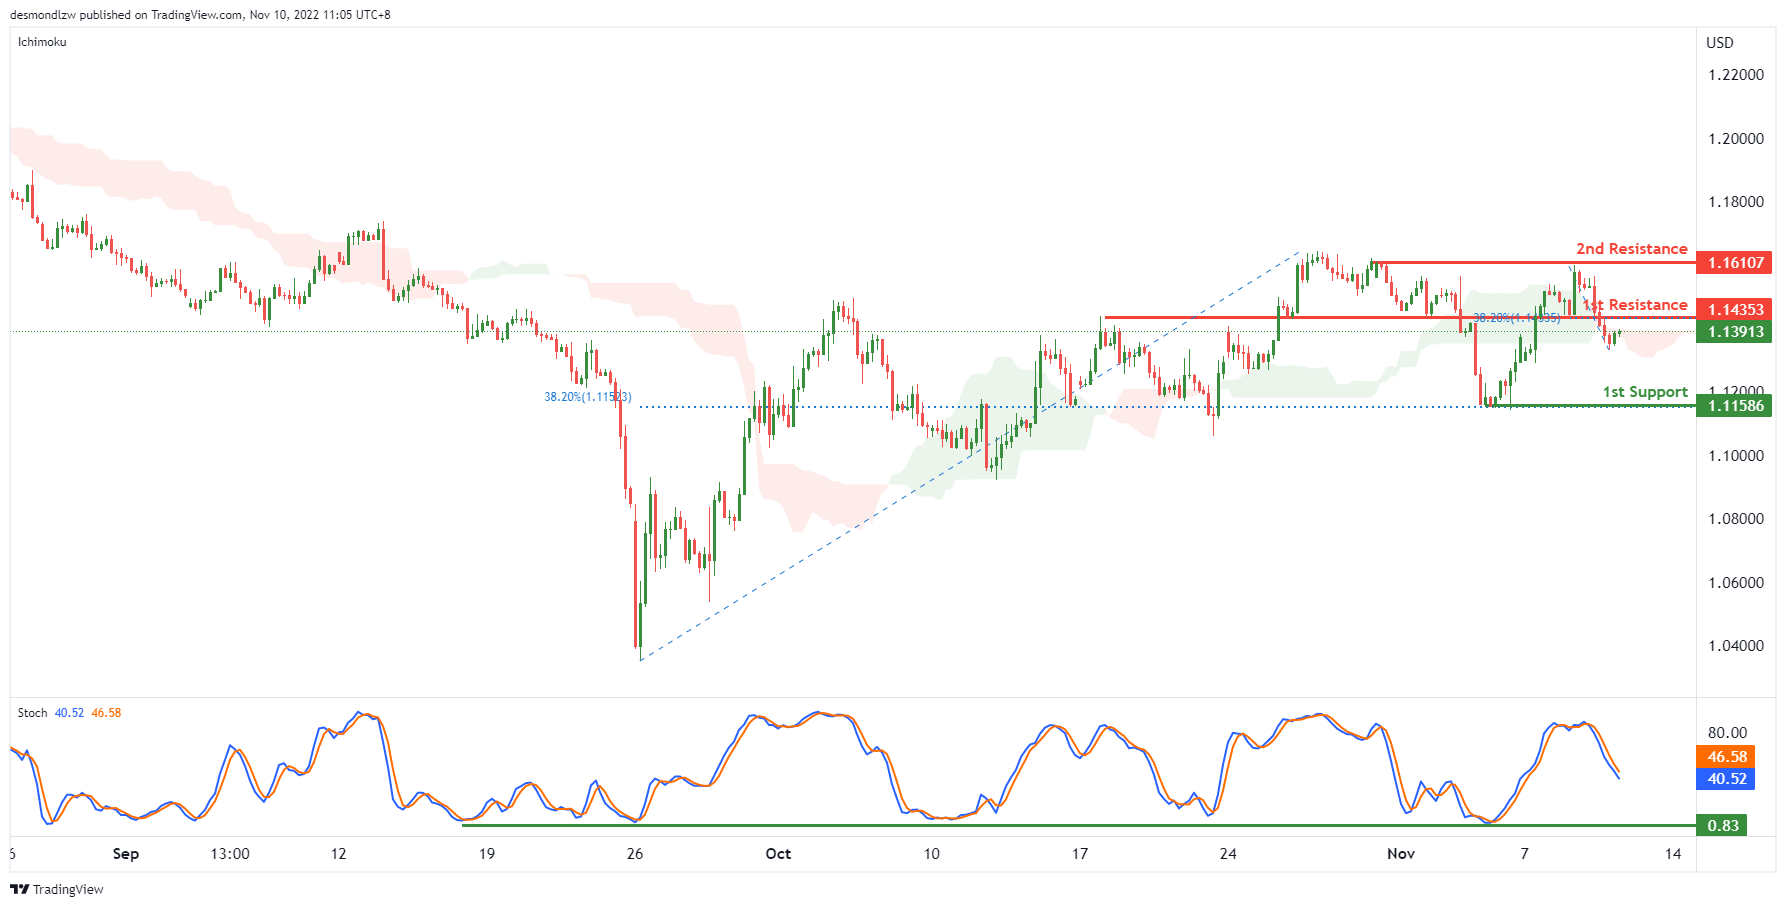
GBP/USD:
On the H4, price is crossing the ichimoku cloud and Stoch is dropping to the support level, we have a bearish bias that the price may drop from the 1st resistance at 1.14353, which is in line with the 38.2% fibonacci retracement and overlap resistance to the 1st support at 1.1586, where the previous swing low and 38.2% fibonacci retracement are. Alternatively, the price may rise to the 2nd resistance at 1.16107, where the previous swing high is.
Areas of consideration:
- H4 1st resistance at 1.14353
- H4 1st support at 1.1586
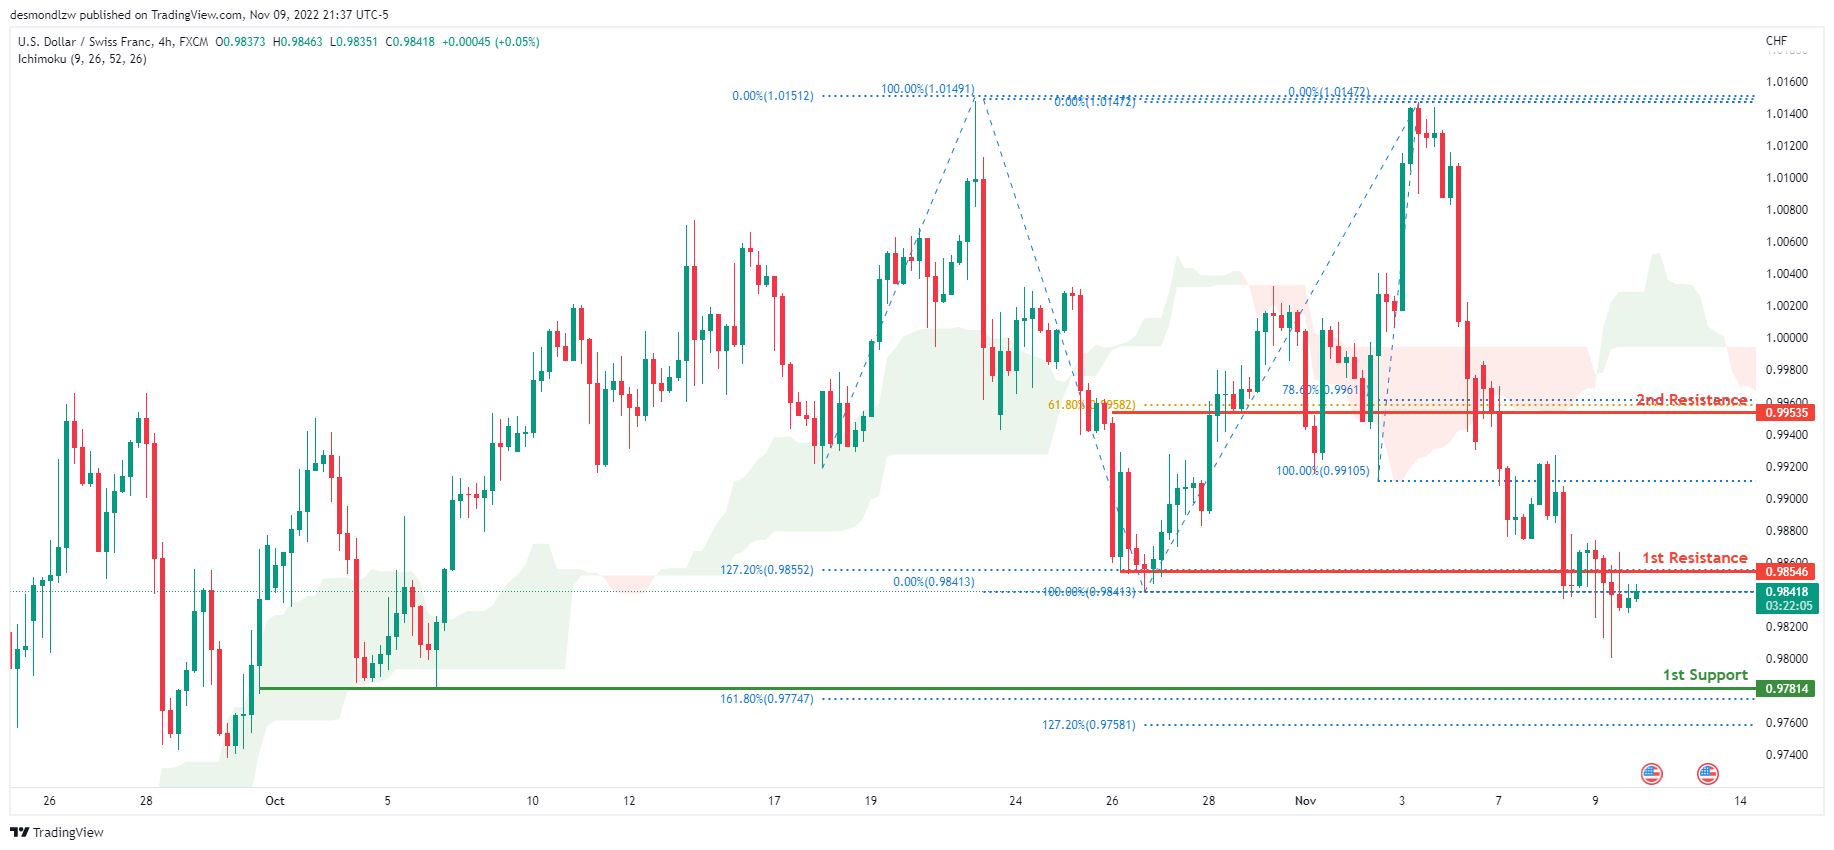
USD/CHF:
On the H4 chart, the overall bias for USDCHF is bearish. To add confluence to this, the price is below the Ichimoku cloud which indicates a bearish market. Overnight, price continued its bearish momentum downwards with price resting just below the 1st resistance line at 0.98546, where the 127.2% Fibonacci extension line, 100% Fibonacci line and previous swing low are located. The price is currently trading at 0.98396 at the time of writing. If this bearish momentum continues, expect price to head towards the 1st support line at 0.97814, where the 127.2% and 161.8% Fibonacci extension lines are located. In an alternative scenario, price could head back up to retest the 1st resistance line.
Areas of consideration
- H4 1st support at 0.97814
- H4 1st resistance at 0.98546
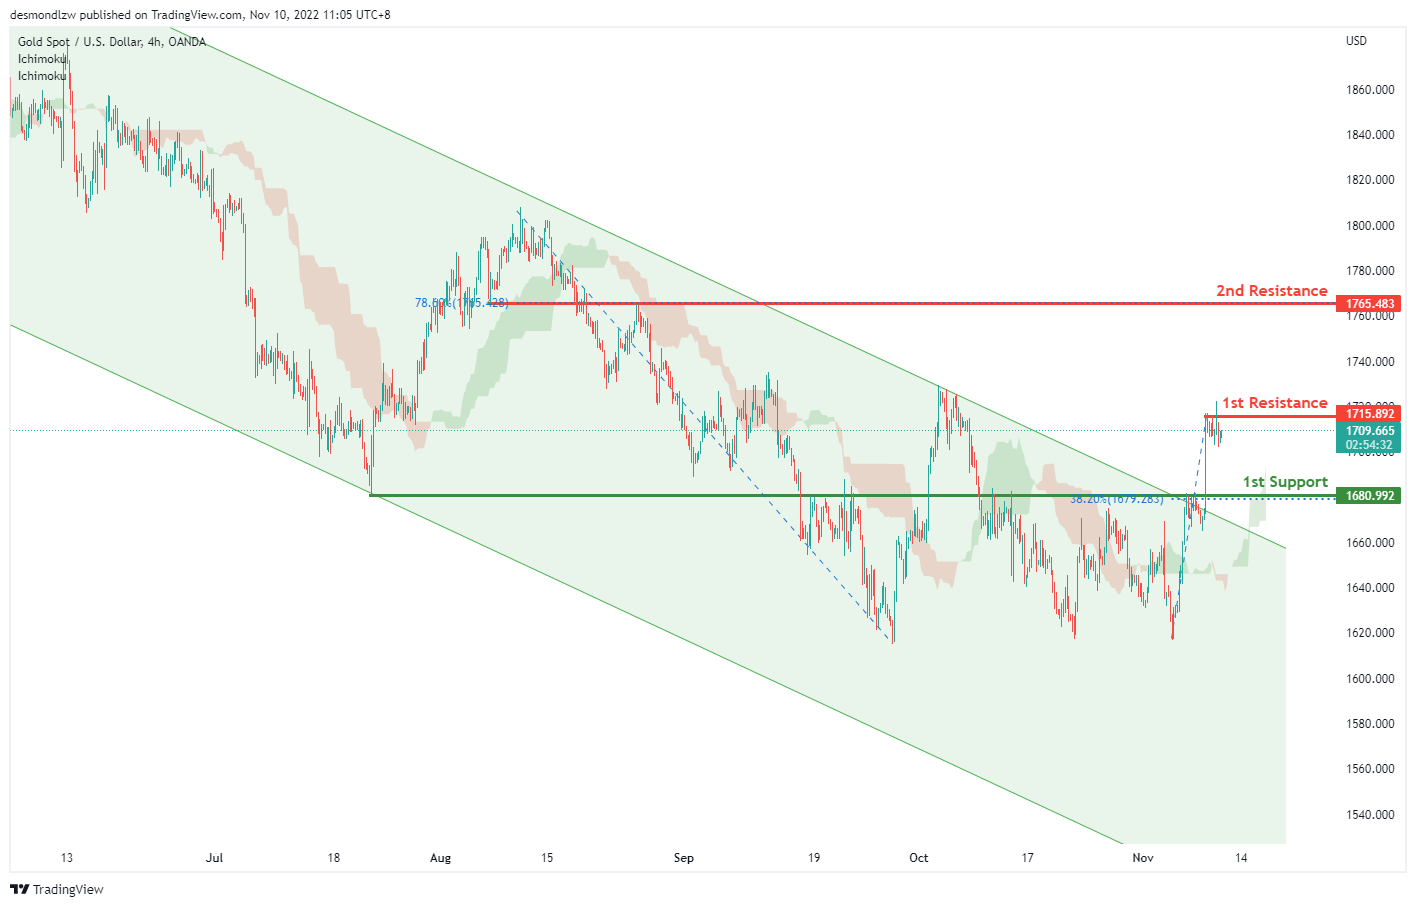
XAU/USD (GOLD):
On H4, with the price breaking the descending channel and above the ichimoku cloud, we can expect the price rise to the 1st resistance at 1715.892, which is in line with the previous swing high, if the 1st resistance is broken, the 2nd resistance is at 1765.483, where the 78.6% fibonacci retracement is. Alternatively, the price may drop to the 1st support at 1680.992, where the 38.2% fibonacci retracement is.
Areas of consideration:
- H4 time frame, 1st resistance at 1715.892
- H4 time frame, 2nd resistance is at 1765.483
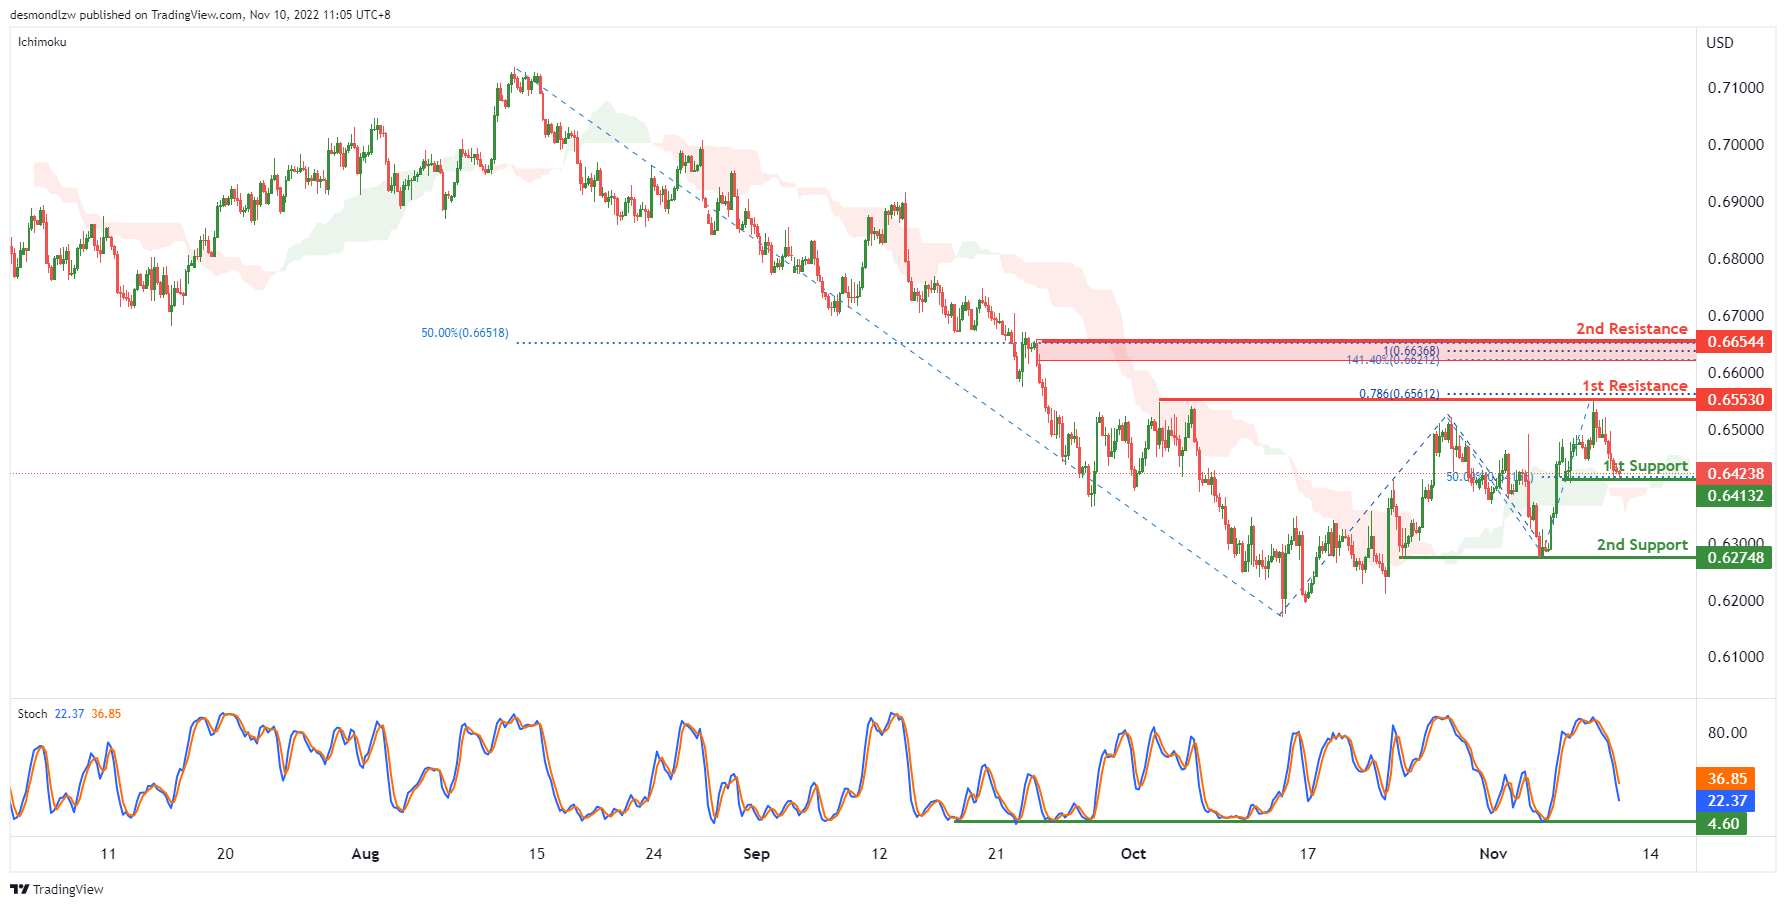
AUD/USD:
On the H4, with the stoch dropping to test the support level, we can expect the price break the 1st support at 0.64132, which is in line with the 50% fibonacci retracement and drop to the 2nd support at 0.62748, where the previous swing low is. Alternatively, the price may rise to the 1st resistance at 0.65530, where the swing highs are and 78.6% fibonacci projection are. If the 1st resistance is broken, the 2nd resistance is at 0.66544, where the 100% fibonacci projection, 50% fibonacci retracement and 141.4% fibonacci extension are.
Areas of consideration
- H4, 1st support at 0.64132
- H4, 2nd support at 0.62748,
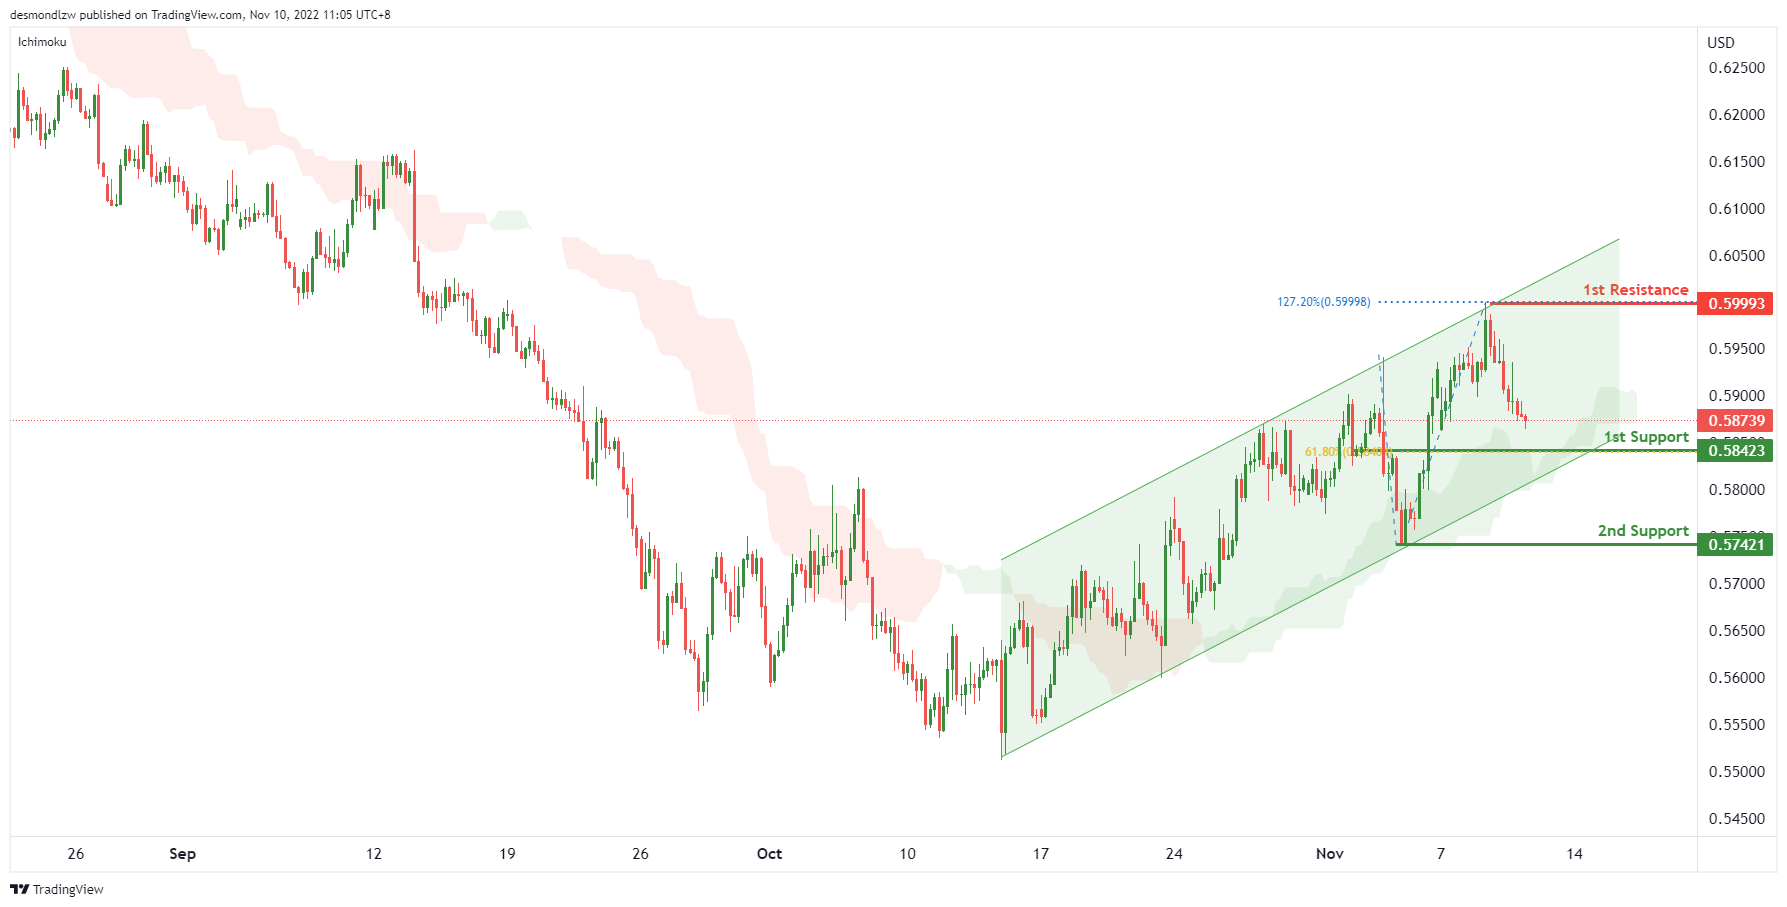
NZD/USD:
On the H4 chart, as the price is moving above ichimoku cloud and ascending channel, the price may drop to the 1st support at 0.58423, where the 61.8% fibonacci retracement is and rise to the 1st resistance at 0.59993, where the swing high and 127.2% fibonacci extension are. Alternatively, the price may drop to the 2nd support at 0.57421, which is in line with the previous swing low.
Areas of consideration:
- H4 time frame, 1st support at 0.58423
- H4 time frame, 1st resistance at 0.59993
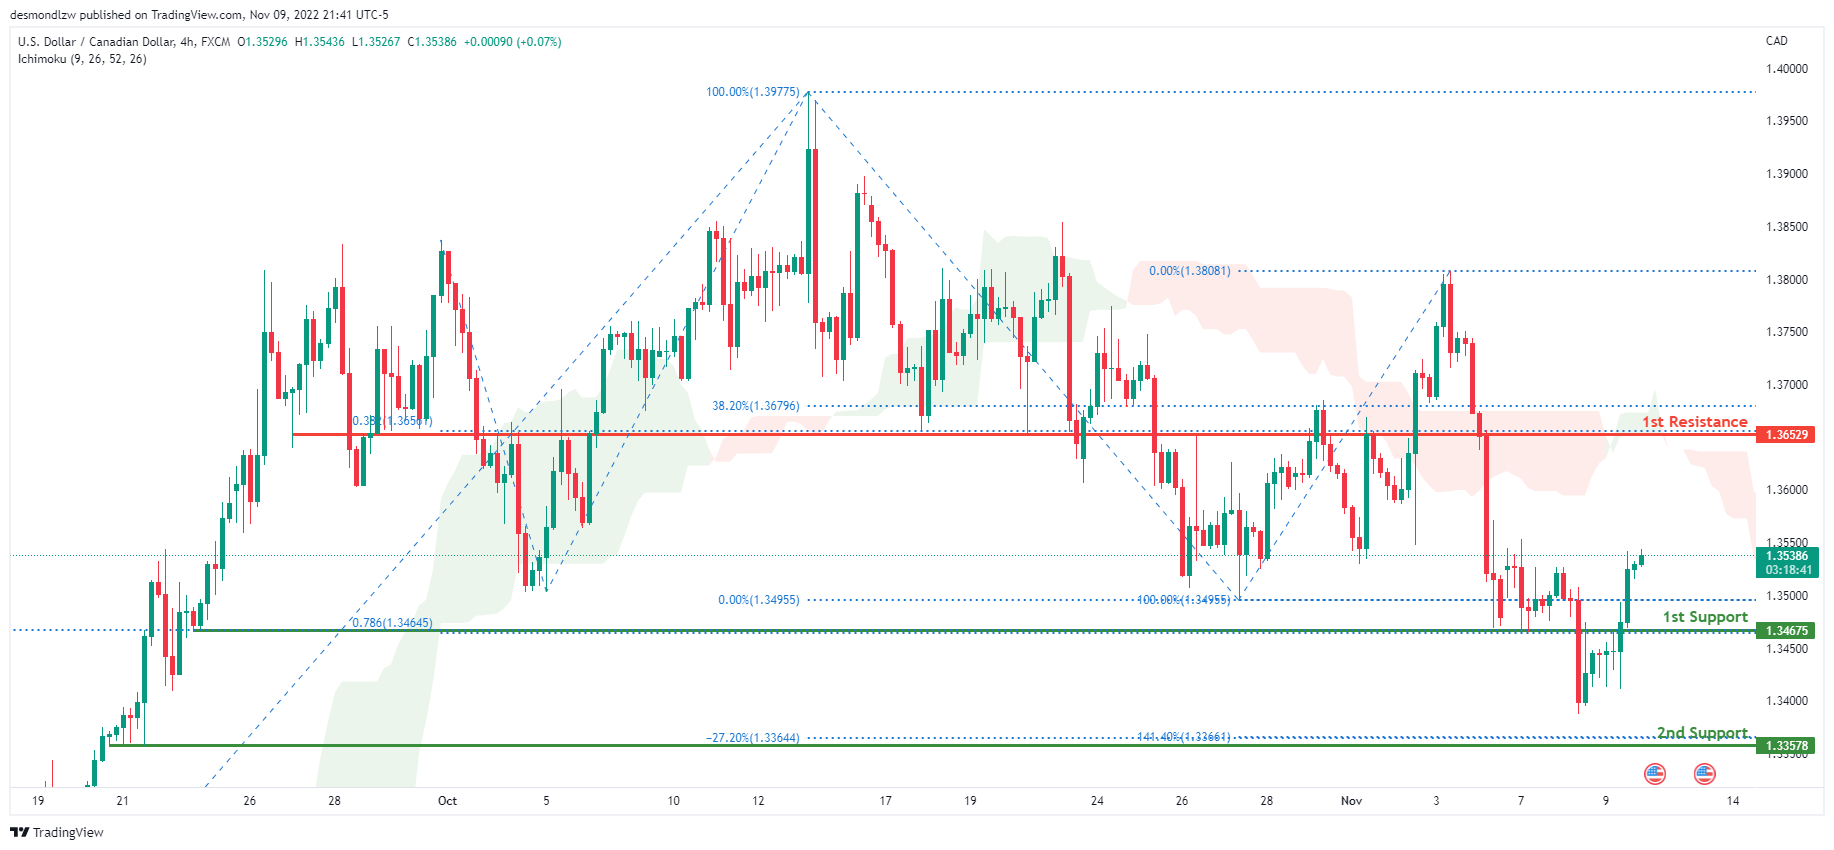
USD/CAD:
On the H4 chart, the overall bias for USDCAD is bearish. To add confluence to this, the price is below the Ichimoku cloud which indicates a bearish market. Overnight, the price had bullish momentum upwards with the price closing above the 1st support line at 1.34675 where the 78.6% Fibonacci projection line and previous low is located. The price is currently trading at 1.35395 at the time of writing. If this bearish momentum continues, expect the price to head back down towards the 1st support line. In an alternative scenario, price could head back up towards the 1st resistance line at 1.36529, where the 38.2% Fibonacci line and 38.2% Fibonacci projection line is located.
Areas of consideration:
- H4 time frame, 1st resistance at 1.36529
- H4 time frame, 1st support at 1.34675
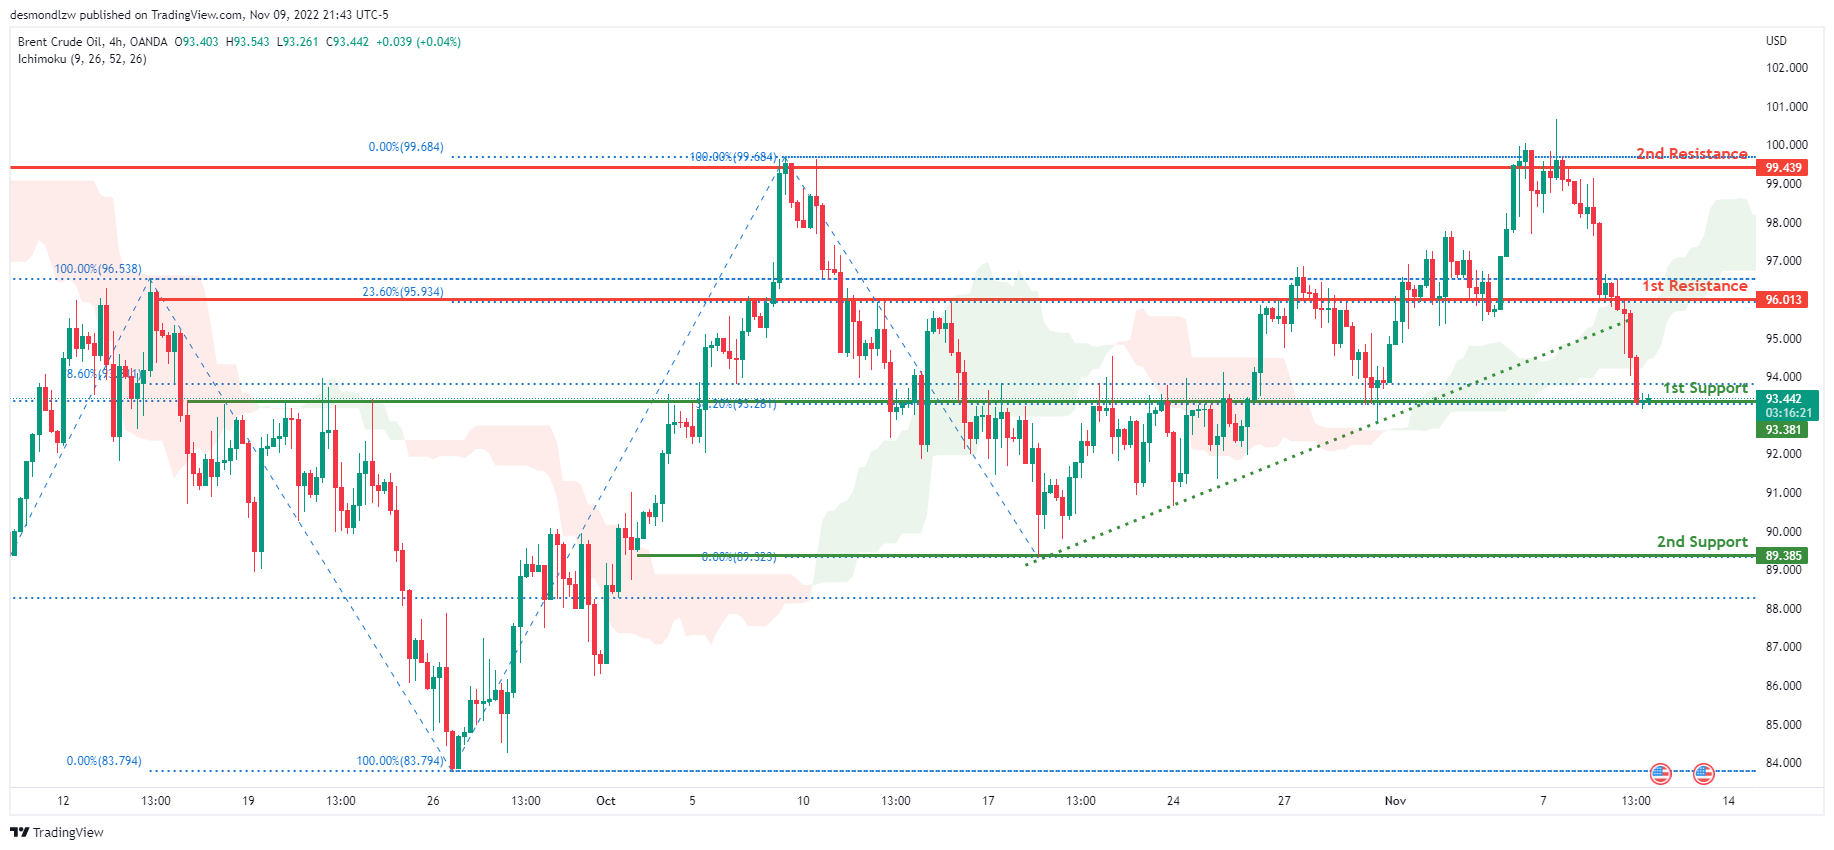
OIL:
Looking at the H4 chart, the current overall bias for Oil is bearish. To add confluence to this, the price is below the Ichimoku cloud which indicates a bearish market. Overnight, price had bearish momentum downwards with the price currently resting on the 1st support line at 93.381 where the 38.2% and 78.6% Fibonacci lines are located.The price is currently trading at 93.452 at the time of writing. If this bearish momentum continues, expect price to break the 1st support line and head towards the 2nd support line at 89.385 where the previous low and 0% Fibonacci line is located. In an alternative scenario, price could head back down to retest the 1st resistance level at 93.381 where the 38.2% and 78.6% Fibonacci lines are located.
Areas of consideration:
- H4 time frame, 1st resistance at 96.013
- H4 time frame, 1st support at 93.381
- H4 time frame, 2nd support at 93.381
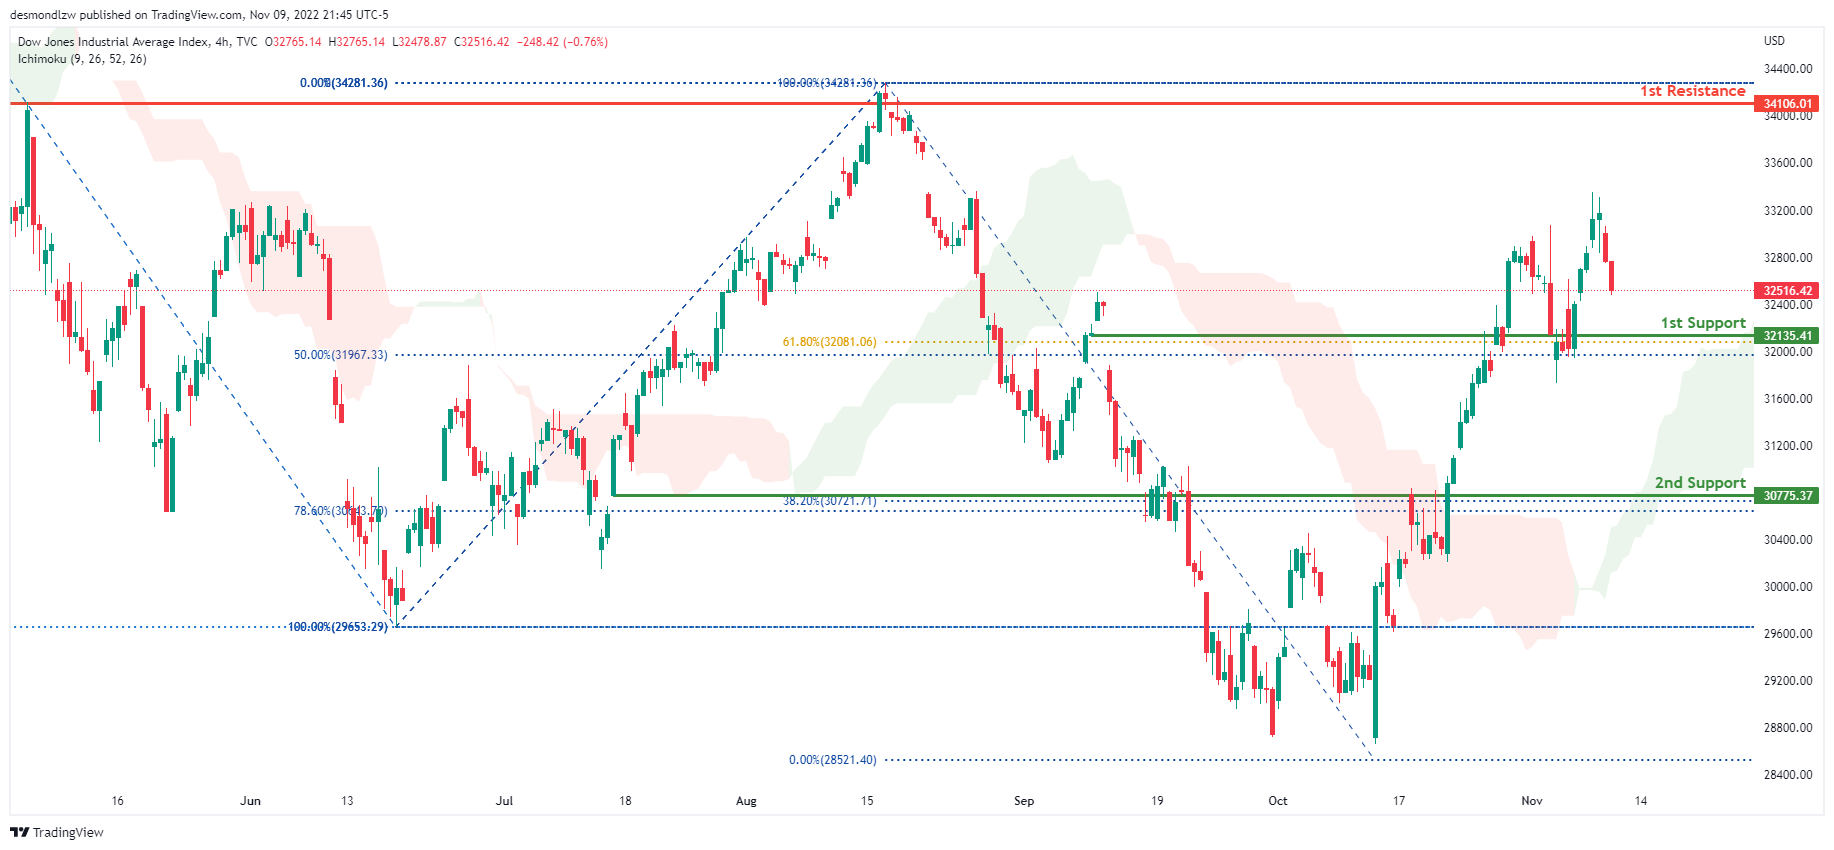
Dow Jones Industrial Average:
On the H4 chart, the overall bias for DJI is bullish. To add confluence to this, the price is above the Ichimoku cloud which indicates a bullish market. Overnight, price had some bearish momentum downwards. The price is currently trading at 33135.41 at time of writing. If this bullish momentum continues, expect the price to possibly head towards the 1st resistance at 34106.01 where the previous high and 100% Fibonacci line is located. In an alternative scenario, price could head towards the 1st support line at 32135.41, where the 61.8% and 50% Fibonacci lines are located.
Areas of consideration:
- H4 time frame, 1st support at 32135.41
- H4 time frame, 1st Resistance at 34106.01
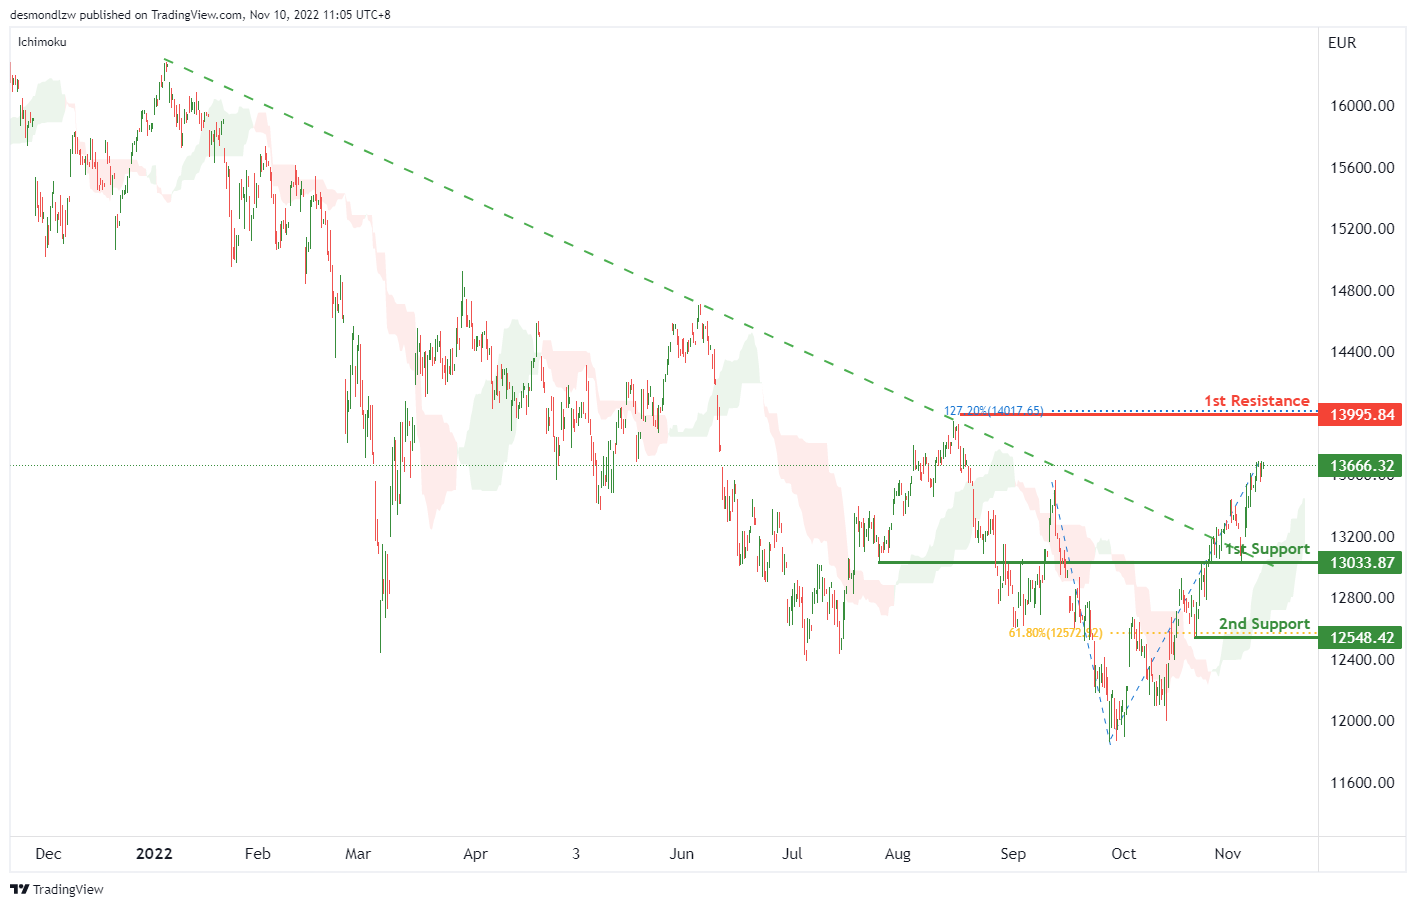
DAX:
On the H4 chart, the price breaks a descending trendline. Expecting price to possibly continue this bullish momentum and rise to the 1st resistance is at 13995.84, where 127.2% fibonacci extension sits. Alternatively, the price may drop to the 1st support at 13033.87, which is in line with the previous swing low, if the 1st support is broken, the 2nd support is at 12548.42, which is in line with the 61.8% fibonacci retracement.
Areas of consideration:
- H4 time frame, current price
- H4 time frame, 1st resistance is at 13995.84
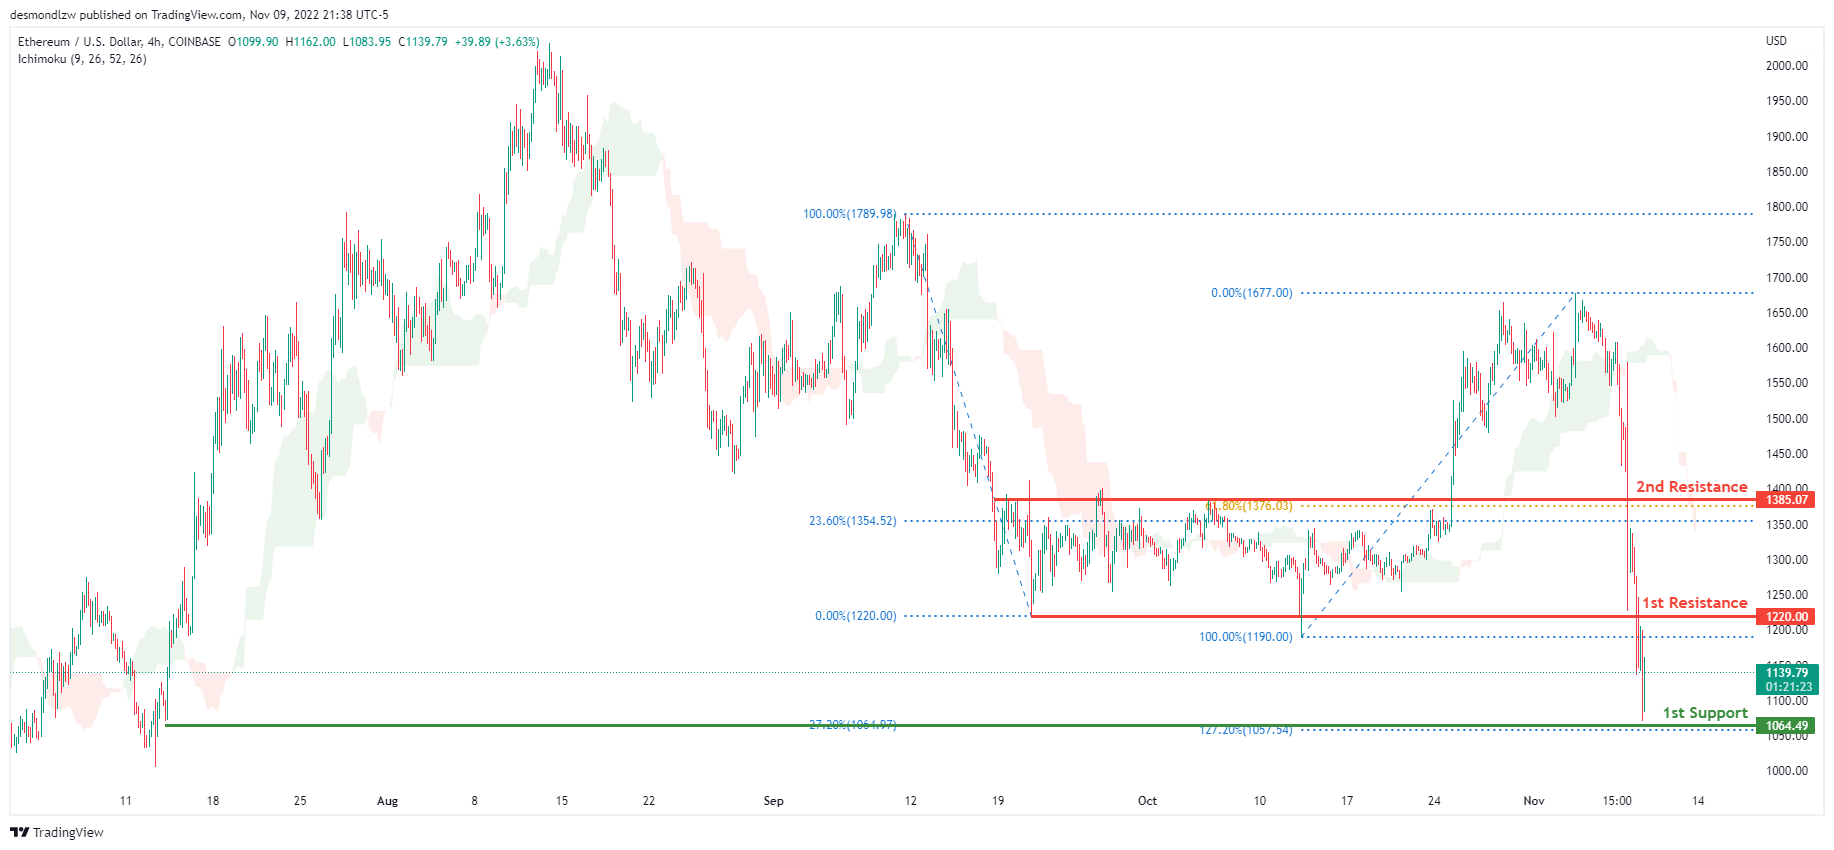
ETHUSD:
Looking at the H4 chart, the current overall bias for ETHUSD is bearish, with price currently under the Ichimoku cloud indicating a bearish market. Overnight, prices had huge bearish momentum downward with the price closing under the 1st resistance line at 1220.00 where the previous low and 100% Fibonacci line was located. The price is currently trading at 1064.49 at the time of writing. If this bearish momentum continues, expect the price to head towards the 1st support line at 1064.49 where the -27.2% Fibonacci expansion and 127.2% Fibonacci extension line is located. In an alternative scenario, price could head back up to retest the 1st resistance line .
Areas of consideration:
- H4 time frame, 1st resistance of 1220.00
- H4 time frame, 1st support at 1064.49
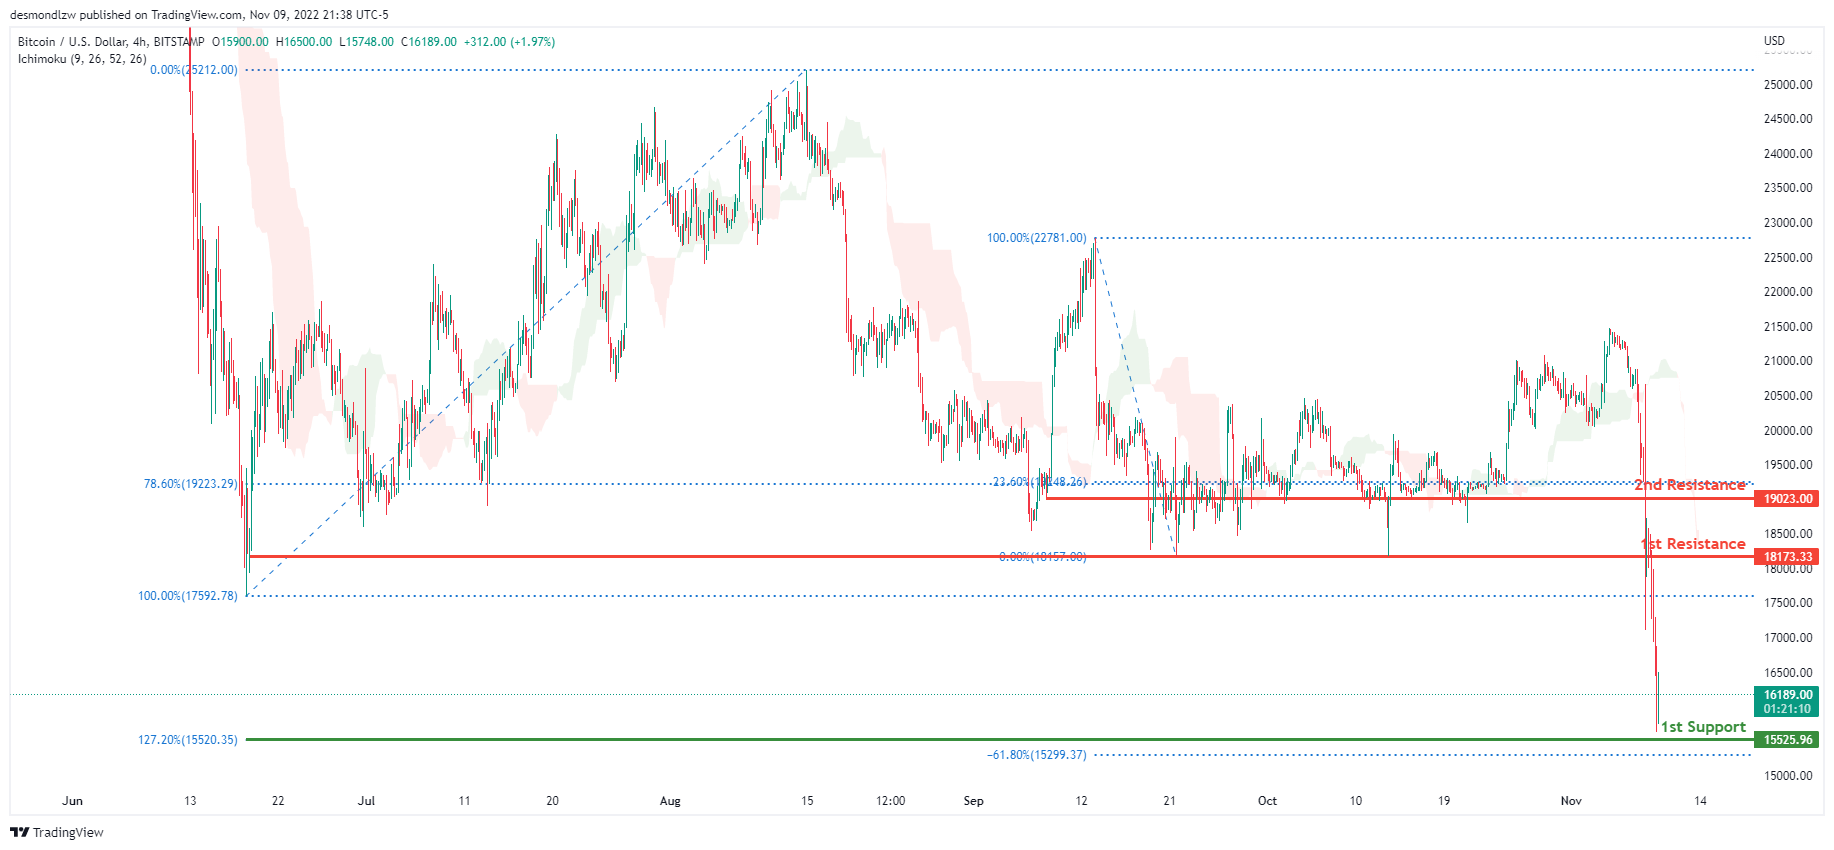
BTCUSD:
On the H4 chart, the overall bias for BTCUSD is bearish. To add confluence to this, the price is below the Ichimoku cloud which indicates a bearish market. Overnight, price continued its huge downwards bearish momentum with price currently above the 1st support line at 15525.96, where the 127.2% Fibonacci extension line and -61.8% Fibonacci expansion line is located . Price is currently trading at 16226.00 at time of writing. If this bearish momentum continues, expect the price to head towards the 1st support line. In an alternative scenario, price could retrace back up to retest the 1st resistance line at 18173.33, where the previous low and 0% Fibonacci line is located.
Areas of consideration:
- H4 time frame, 1st resistance 18173.33
- H4 time frame, 1st support at 15525.96
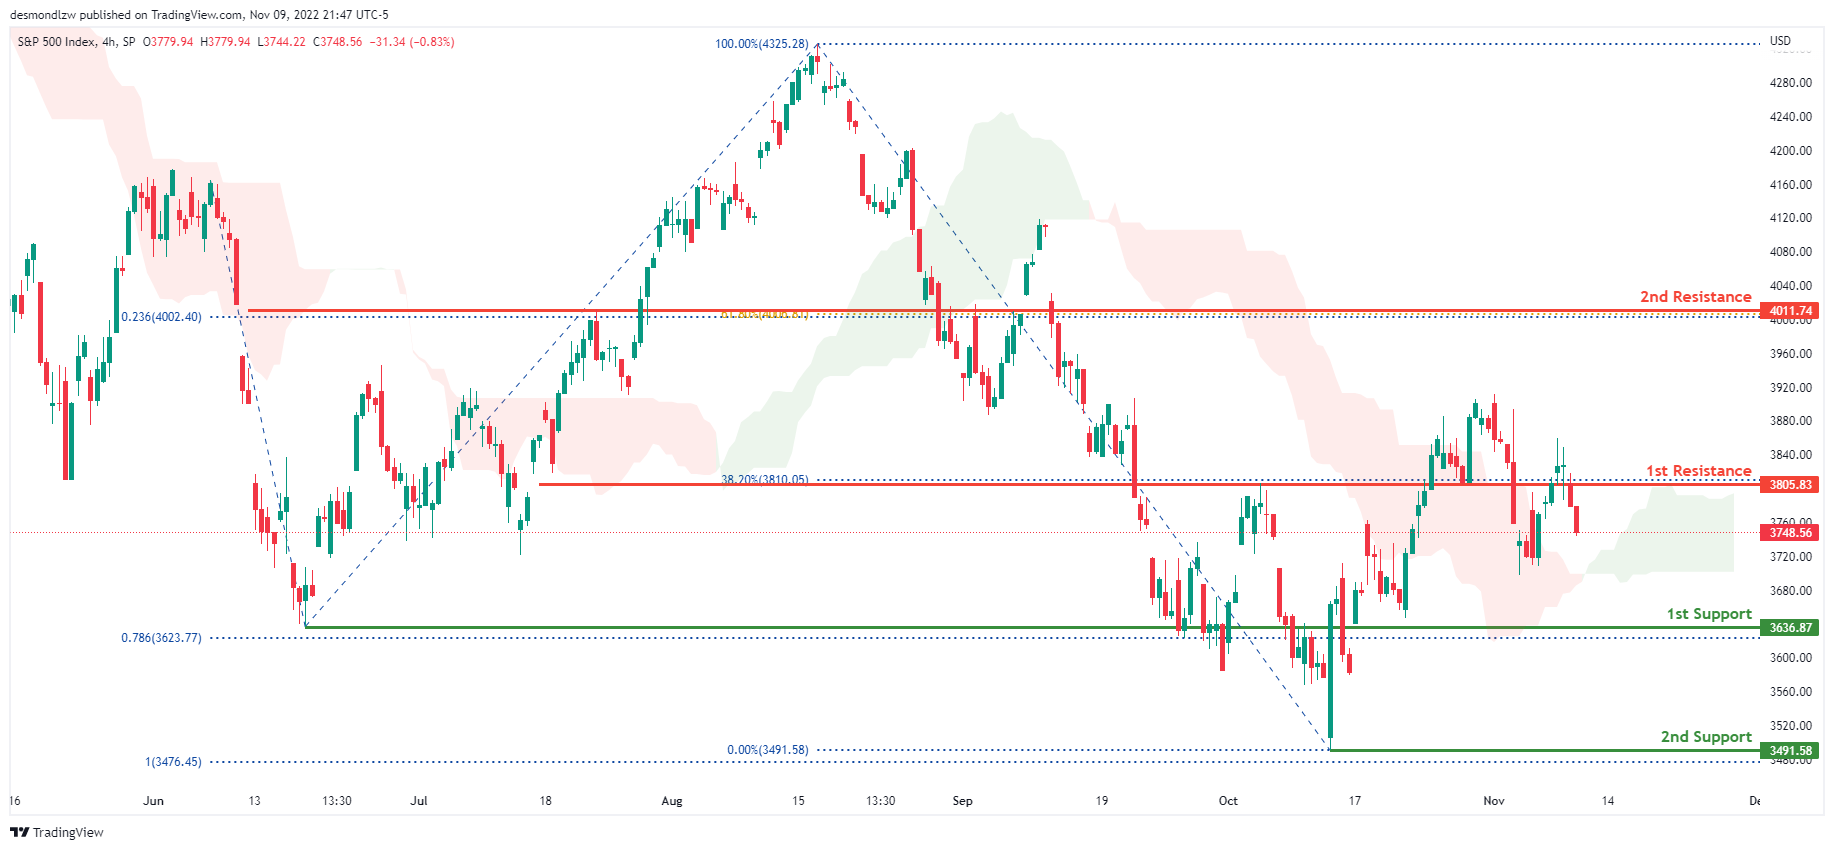
S&P 500:
On the H4 chart, the overall bias for S&P500 is bullish with price above the Ichimoku cloud. Overnight, price had bearish momentum with the price closing under the 1st resistance at 3805.83 where the 38.2% Fibonacci line is located. The price is currently trading at 3748.56 at time of writing. If bullish momentum continues, expect the price to head back up to retest the 1st resistance line. In an alternative scenario, price could possibly head back down towards the 1st support line at 3636.87 where the previous swing low and 78.6% Fibonacci projection line is located.
Areas of consideration:
- H4 time frame, 1st support at 3636.87
- H4 time frame, 2nd support at 3491.58
- H4 time frame, 1st resistance at 3805.83


