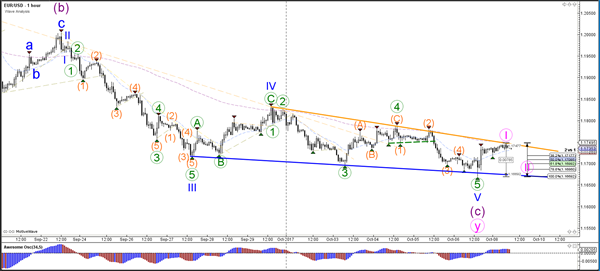
Currency pair EUR/USD
The EUR/USD is building a falling wedge chart pattern (blue/orange lines), which could indicate a bullish reversal. A bearish breakout below support (blue) and the 23.6% Fibonacci level of wave 4 (blue) could see price fall towards the 38.2% Fibonacci level near 1.15 whereas a bullish breakout could see price test the next resistance (orange line).
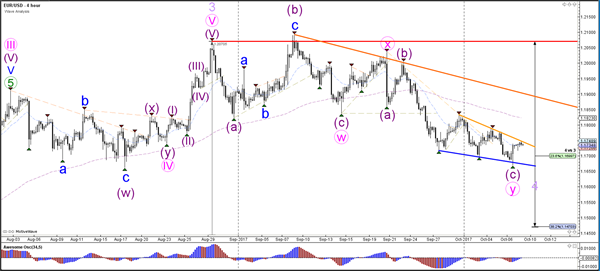
The EUR/USD direction depends on the breakout of the pattern which is indicated by the trend lines. A potential wave 1-2 (pink) might occur if price stays above the bottom (100% level)
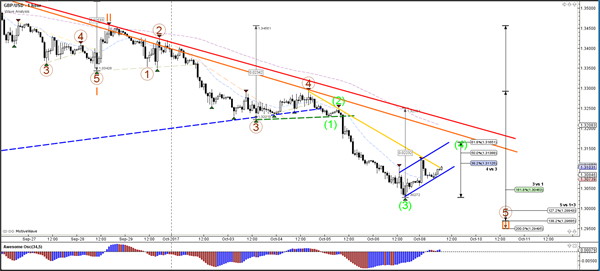
Currency pair GBP/USD
The GBP/USD is in a downtrend channel (red line) and could be building a larger wave C or 3 (green).
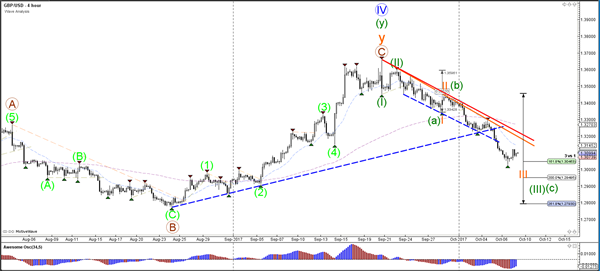
The GBP/USD could be building a wave 4 (light green) correction within wave 3 (orange). A break above the 61.8% Fibonacci level of wave 4 vs 3 makes the wave 4 less likely.
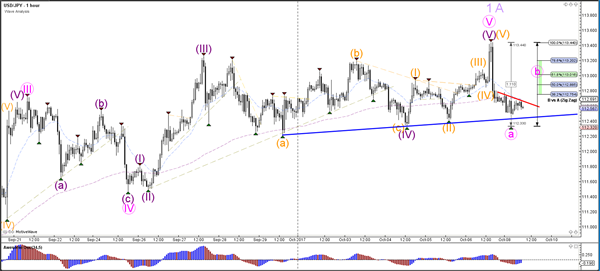
Currency pair USD/JPY
The USD/JPY is in a sideways range, which is indicated by the support (blue) and resistance (red) trend lines. A bearish breakout could indicate a retracement towards the Fibonacci levels of wave 2 or B (purple).
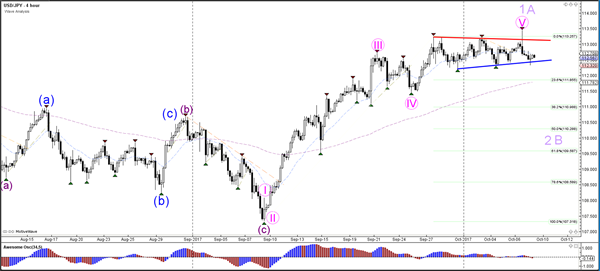
The USD/JPY could be building a potential ABC (pink) correction.