EUR/USD
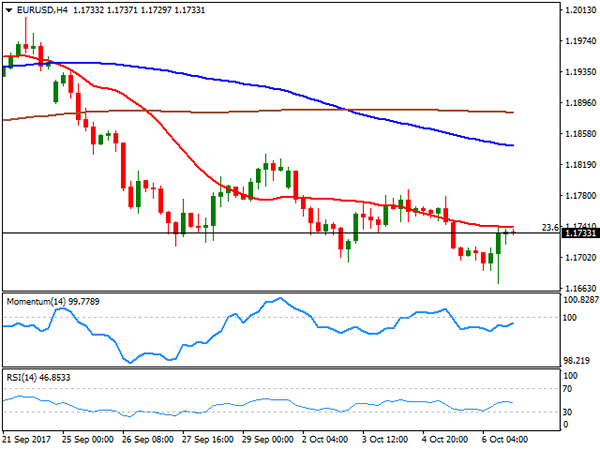
The EUR/USD pair closed down for a fourth consecutive week, ending a busy Friday at 1.1733. The weekly decline was a combination of political jitters in Spain and a dovish stance towards rates from the ECB weighing on the common currency, coupled with solid growth data from the US. On Friday, the US released the September jobs’ report, showing that the economy lost 33,000 jobs, instead of adding 90,000 as expected. Market players were already expecting a poor reading amid the hurricanes that hit the US during the past month, although the negative figure surpassed the worst forecast, with payrolls negative for the first time since 2010. The report, however, also showed that the unemployment rate fell to 4.2% from 4.4%, while wages were sharply up in the month, surging by 0.5%, taking the annual wage growth up to 2.9%, the highest in a decade and a sign that inflation may start to pick up. These last numbers, which are enough to keep the Fed in the tightening path, fueled demand for the greenback, resulting in the EUR/USD pair plummeting to 1.1669. Headlines coming from Russia, indicating that North Korea is preparing a missile test that can reach the US coast triggered a run towards safety, resulting in the pair bouncing back to end the day at 1.1733.
Spain will be the main risk factor for the common currency during the upcoming week, as Catalonia could attempt to declare its independence unilaterally, while in the US, Fed meeting minutes mid week, and Retail Sales and inflation releases on Friday will gather most of the attention.
Technically, the daily chart for the pair shows that it fell down to its 100 DMA, testing the indicator for the first time since mid April, to settle around the 23.6% retracement of the latest monthly rally. In the same chart, the price is well below a bearish 20 DMA, while the RSI indicator continues consolidating within bearish territory, with no directional strength. The Momentum managed to bounce from oversold readings, but remains well into the red, leaning the scale towards the downside. In the 4 hours chart, the pair ended right below a 20 SMA, while technical indicators remain within negative territory, lacking directional strength, indicating a limited buying interest around the pair short term. The pair bottomed for the week at 1.1669, where it has the mentioned 100 DMA, whilst August low comes at 1.1661, making of the 1.1660 a critical support for these upcoming days.
Support levels: 1.1695 1.1660 1.1620
Resistance levels: 1.1780 1.1825 1.1850
USD/JPY
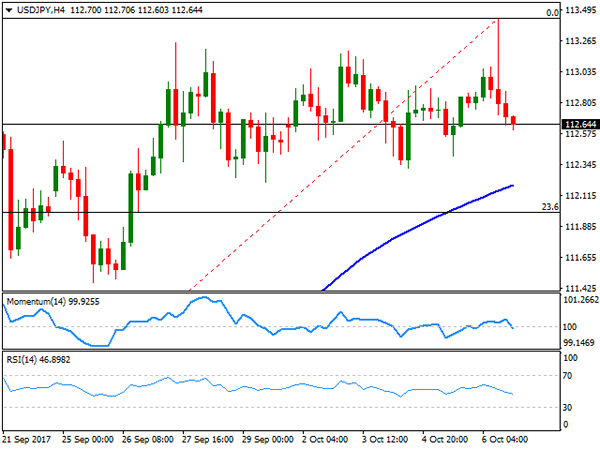
The USD/JPY pair closed the week unchanged at 112.64, after peaking at 113.43, its highest in three months, following the US employment report. Dollar’s positive momentum against the safe-haven yen took a hit from headlines coming from Russia, indicating that North Korea was getting ready to test a ballistic missile that could reach the West Coast of the US. Preventing the pair from falling further were US Treasury yields, with the 2-year note benchmark up to 1.51% its highest since late 2008, on increased expectations of a December hike, while the 10-year note yield settled at 2.37%. Beyond risk sentiment, the lack of upward progress implicates bulls are starting to feel discouraged, and therefore that a retracement is likely in the days to come. The daily chart shows that the Momentum indicator has gained downward strength, currently pressuring its mid-line, while the RSI indicator also begun retreating, although modestly, from overbought conditions. In the same chart, the price is well above its 100 and 200 SMAs, with the shortest converging with the 38.2% retracement of the latest bullish run at 111.10, the level to break to confirm a bearish trend ahead. In the 4 hours chart and for the short term, the technical outlook is neutral, as technical indicators have barely turned lower holding around their mid-lines, whilst the price remains above bullish moving averages.
Support levels: 112.30 112.00 111.65
Resistance levels: 112.85 113.25 113.60
GBP/USD
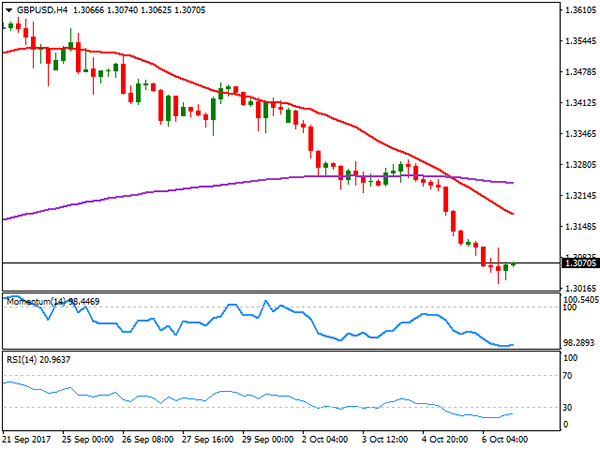
The GBP/USD pair had its worst week for the year, plummeting over 300 pips on the back of deteriorated PM May leadership. The pair remained offered, despite dollar’s pullback at the end of the week, closing it at 1.3070, not far from the low reached following the release of US employment figures at 1.3026. Political uncertainty, following May’s speech at the Tory party conference was the main reason of Pound’s weakness. May failed to build up confidence within her own cabinet amid the absence of a clear Brexit strategy that will fulfill her promises of a brighter future for the UK. Rumors that she may need to step down, or even worse, call for a snap election, will likely keep the Pound under pressure. Cable’s decline is far from over, according to technical readings in the daily chart, as technical indicators maintain their strong downward momentum. However, indicators are nearing oversold readings, pretty much straight from overbought conditions, reflecting the violent decline and indicating that an upward corrective movement is possible. The key is the 1.3000 psychological threshold, as a break below the level will close the doors for further recoveries. Shorter term, and according to the 4 hours chart, technical indicators consolidate within oversold territory, whilst the 20 SMA maintains a sharp downward slope above the current level, limiting chances of an upward correction in the near term.
Support levels: 1.3030 1.2995 1.2960
Resistance levels: 1.3100 1.3145 1.3190
GOLD
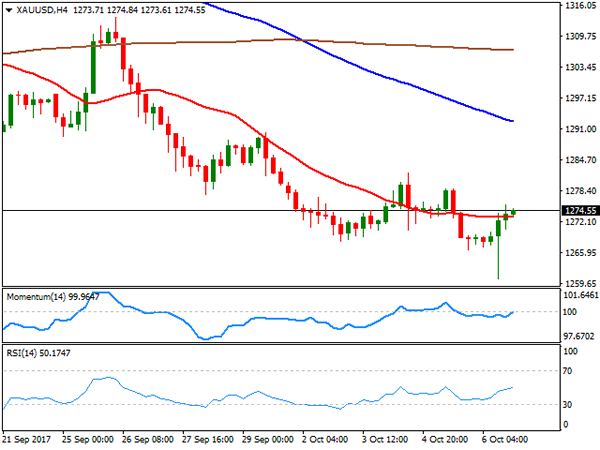
Spot gold posted a sharp reversal on Friday, closing the day higher and trimming most of its weekly losses, after plummeting to a two-month low of $1,260.54 a troy ounce. The initial decline was led by US employment data, as despite the negative headline, market players saw it as still supportive of a rate hike given the strong wages’ growth within the report. The dollar was unable to hold on to gains and changed course mid US session, following news that North Korea is preparing to test a missile that can reach the US, according to Anton Morozov, a Russian lawmaker who recently visited Pyongyang. The commodity settled at $1,274.55 a troy ounce, and the daily chart shows that the price tested its 200 DMA before bouncing to end around its 100 DMA. In the same chart, technical indicators have managed to bounce from near oversold readings, but are far from signaling an upward extension, whilst the 20 SMA maintains a sharp bearish slope well above the current level, limiting chances of a steeper advance. The key is the weekly high of 1,282.15 as some follow-through beyond the level should favor additional gains ahead. In the shorter term, and according to the 4 hours chart, the latest recovery also lacks enough strength to confirm a bullish continuation, as the price settled around a horizontal 20 SMA, but below bearish larger ones, while technical indicators have reached their mid-lines before losing directional strength.
Support levels: 1,268.30 1,260.50 1,252.90
Resistance levels: 1,282.15 1.294.25 1,303.95
WTI CRUDE OIL
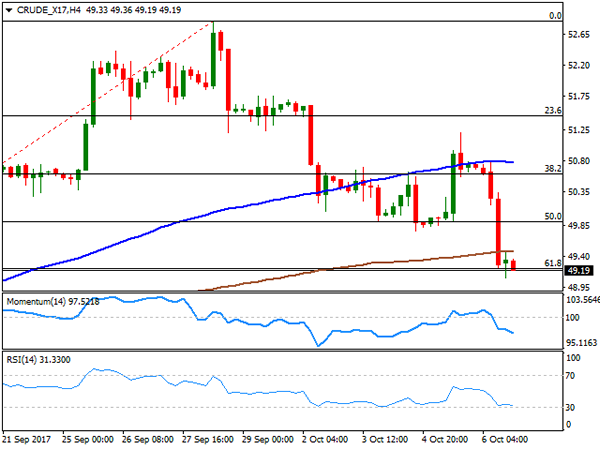
Crude oil prices plunged on Friday, ending the week in the red after advancing in the previous three. West Texas Intermediate crude oil futures closed at $49.19 a barrel, on speculation about supply disruptions, as the tropical storm Nate, which could evolve into a hurricane, reaches the Gulf of Mexico, forcing the shutdown on several platforms in the region. Nevertheless, news of the sector are supporting of a more balanced market ahead, on speculation that the OPEC and non-OPEC producers that decided an output cut late last year, are planning to extend it towards the end of 2018. The US Baker Hughes report released on Friday showed that the number of active US rigs drilling for oil fell by 2 to 748 this week, reportedly due to energy firms reducing spending plans for this year amid price declines. WTI settled around the 61.8% retracement of its bullish run between 46.99 and 52.84 at 49.20. The daily chart shows that the risk towards the downside has increased, as despite the price remains above the 100 and 200 SMAs, the largest is still well above the shortest and with a bearish slope. Technical indicators in the mentioned chart accelerated their declines after entering negative territory, in line with further slides ahead. Shorter term, and according to the 4 hours chart, the price settled below both moving averages, the Momentum indicator gains downward traction within bearish territory, whilst the RSI indicator consolidates around 32, all of which supports a downward move ahead, in line with the longer term perspective.
Support levels: 48.80 48.30 47.65
Resistance levels: 49.90 50.60 51.10
DJIA
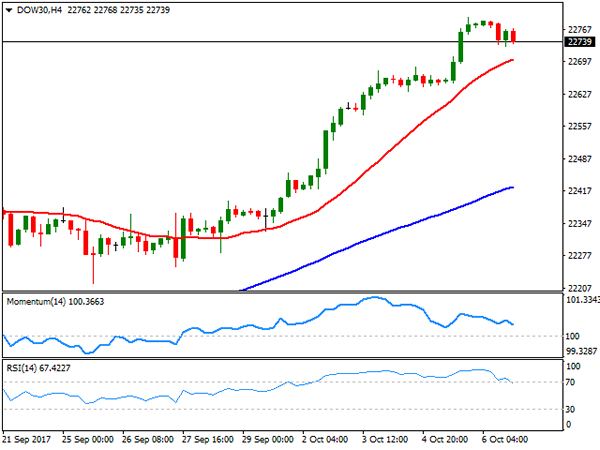
US equities traded with a softer tone on Friday, affected by a series of discouraging factors. First, news that Amazon is considering selling prescriptions´ drugs hit the pharmacy sector, which was the worst performer. US employment data hit investors´ sentiment, as the economy lost 33,000 jobs in September, the first negative reading since 2010. The report however, also indicated that the unemployment rate fell to 4.2% against the expected 4.4% while wages picked up sharply in the month. Finally, sentiment was dented by headlines indicating that North Korea plans to test a missile capable to reach the US west coast. The Dow Jones Industrial Average lost two points, to close at 22,773.67, while the S&P closed 0.11% lower at 2,549.33. The Nasdaq Composite managed to close in the green, up 4 points to 6,590.18. From a technical point of view, and referring to the Dow the 2 points decline is barely affecting the dominant bullish long term momentum. The daily chart shows that the index settled at the upper end on Thursday’s range, still far above bullish moving averages, and with technical indicators having turning modestly lower, but still within overbought territory. In the 4 hours chart, the RSI indicator erased the extreme overbought readings, now heading marginally lower around 68, whilst the Momentum presents a neutral-to-bearish stance, but still above its mid-line, suggesting the index may correct further lower next week, particularly if it breaks below the 20 SMA in this last time frame, the immediate support at 22,701. The possibility of a downward move is correlated to possible North Korean headlines, although market’s reaction to such risk-related events have been decreasing lately, as they become old news.
Support levels: 22,701 22,651 22,595
Resistance levels: 22,790 22,850 22,900
FTSE100
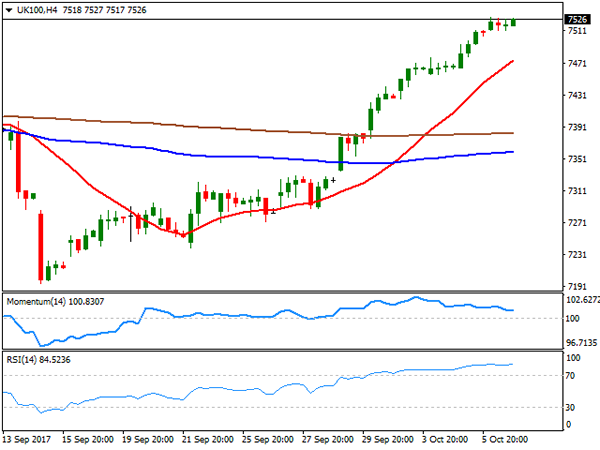
The FTSE 100 closed at 7,522,87, up roughly 15 points on Friday, backed by persistent weakness in the Pound, which remained pressured by political jitters in the UK and speculation that PM May would need to call for a snap election. The index added 2.0% in these last five days, logging its best weekly gain for the year. Banks and mining-related equities were among the worst performers, with banks dragged lower by Spain woes, and miners dragged lower by gold that plunged after the release of the US Nonfarm Payroll report. Leading gainers within the Footsie was NMC Health, up 4.26%, followed by Mediclinic International that added 3.31%. Centrica was the worst performer, down 1.69%, followed by EasyJet that lost 1.64%, after saying that it expects profits for this fiscal year to be at the upper end of estimates, but also noted increasing pressures in the sector. The index settled below its August low at 7,552, a critical resistance, with gains beyond the level likely for this Monday if the GBP/USD pair falls below the key 1.30 threshold. In the daily chart, technical indicators hold near overbought territory, with the Momentum easing modestly, rather reflecting the pullback from the intraday high than suggesting a downward move ahead, and as the index runs further above its moving averages, all of which supports additional gains ahead. In the 4 hours chart, the Momentum indicator keeps posting lower highs and heading lower within positive territory, drawing a bearish divergence that still needs to be confirmed with a break below its 100 level, but the RSI indicator consolidates within extreme overbought territory, whilst the index is firmly above a bullish 20 SMA, indicating a limited downward potential for the upcoming sessions.
Support levels : 7,495 7,444 7,408
Resistance levels: 7,513 7,552 7,599
DAX
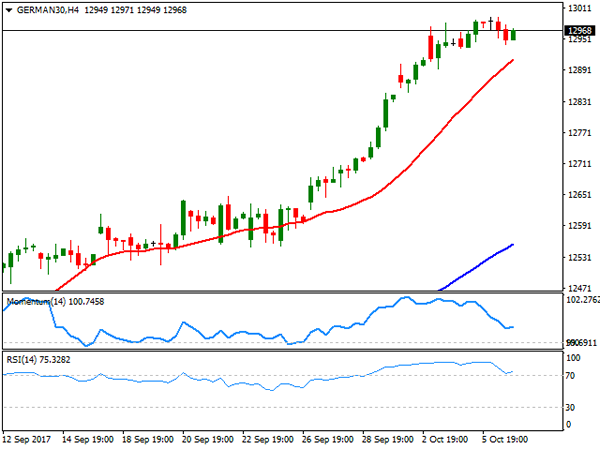
European equities closed Friday generally lower, undermined by political jitters in Spain, but managed to end the week with gains. The German DAX lost 12 points on the last trading day of the week, settling at 12,995.94, after reaching an intraday all-time high of 12,993, following news that total manufacturing orders in the country increased 3.6% in August from the previous month, reflecting a strong upswing in the sector. Banks were among the worst performers all through the region, after the third largest lender in Spain announced it would move its headquarters outside Catalonia. Within the DAX, ThyssenKrupp led decliners, down 2.17%, followed by Deutsche Lufthansa that lost 1.43%. ProSiebenSat.1 led gainers, up 2.65%, followed by Volkswagen that added 0.66%. The index has been rallying firmly since early September, and the daily chart shows that Friday’s retracement stalled above Thursday’s low, leaving the movement as merely corrective. In the same chart, technical indicators continue consolidating within extreme overbought readings, while the SMAs setup continues favoring the upside, as the 20 DMA extended its advance after crossing above the larger ones. Shorter term, and according to the 4 hours chart, the risk is also towards the upside, as the Momentum retreated within positive territory before turning flat, while the RSI corrected extreme overbought readings, but pared its decline to settle around 73. The 20 SMA in this last time frame provides an immediate support at 12,910, an immediate support for this Monday, which if gets broken, will likely favor additional declines ahead.
Support levels: 12,935 12,893 12,849
Resistance levels: 13,030 13,065 13,100