
USD/JPY:
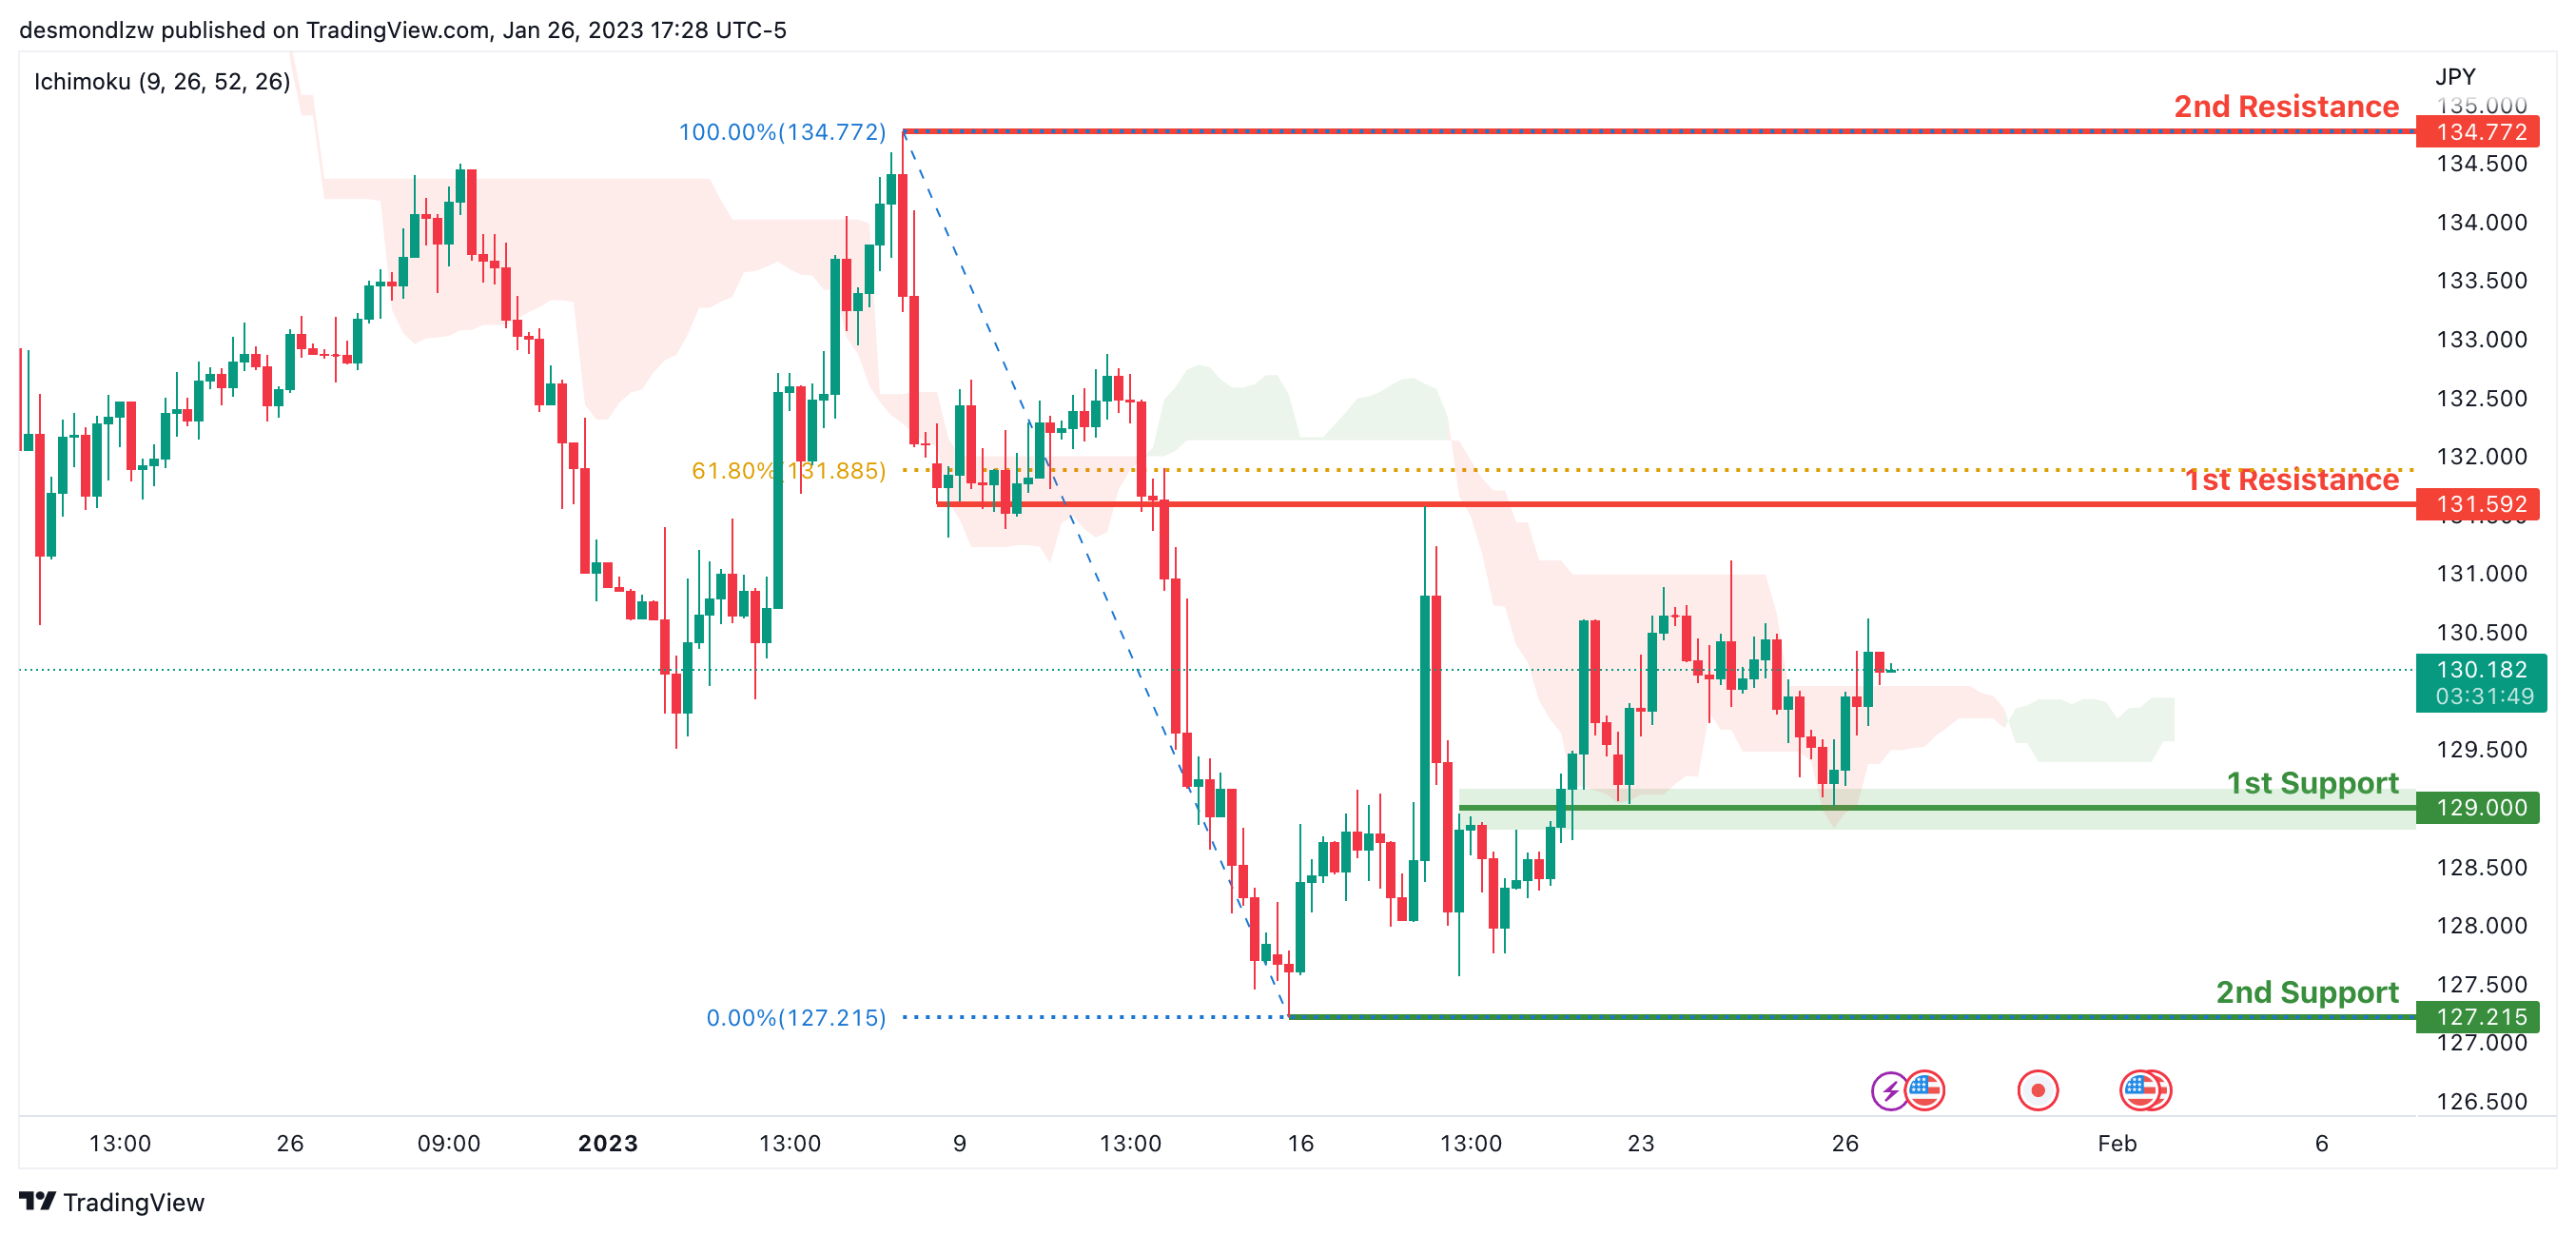
Looking at the H4 chart, my overall bias for USDJPY is bullish due to the current price crossing above the Ichimoku cloud, indicating a bullish market. If this bullish momentum continues, expect the price to possibly continue heading towards the 1st resistance level at 131.592, where the 61.8% Fibonacci line is. In an alternate scenario, price could possibly head back down to retest the 1st support at 129.000, where the overlap support is.
Areas of consideration:
- H4 time frame, 1st resistance at 131.592
- H4 time frame, 1st support at 129.000
DXY:
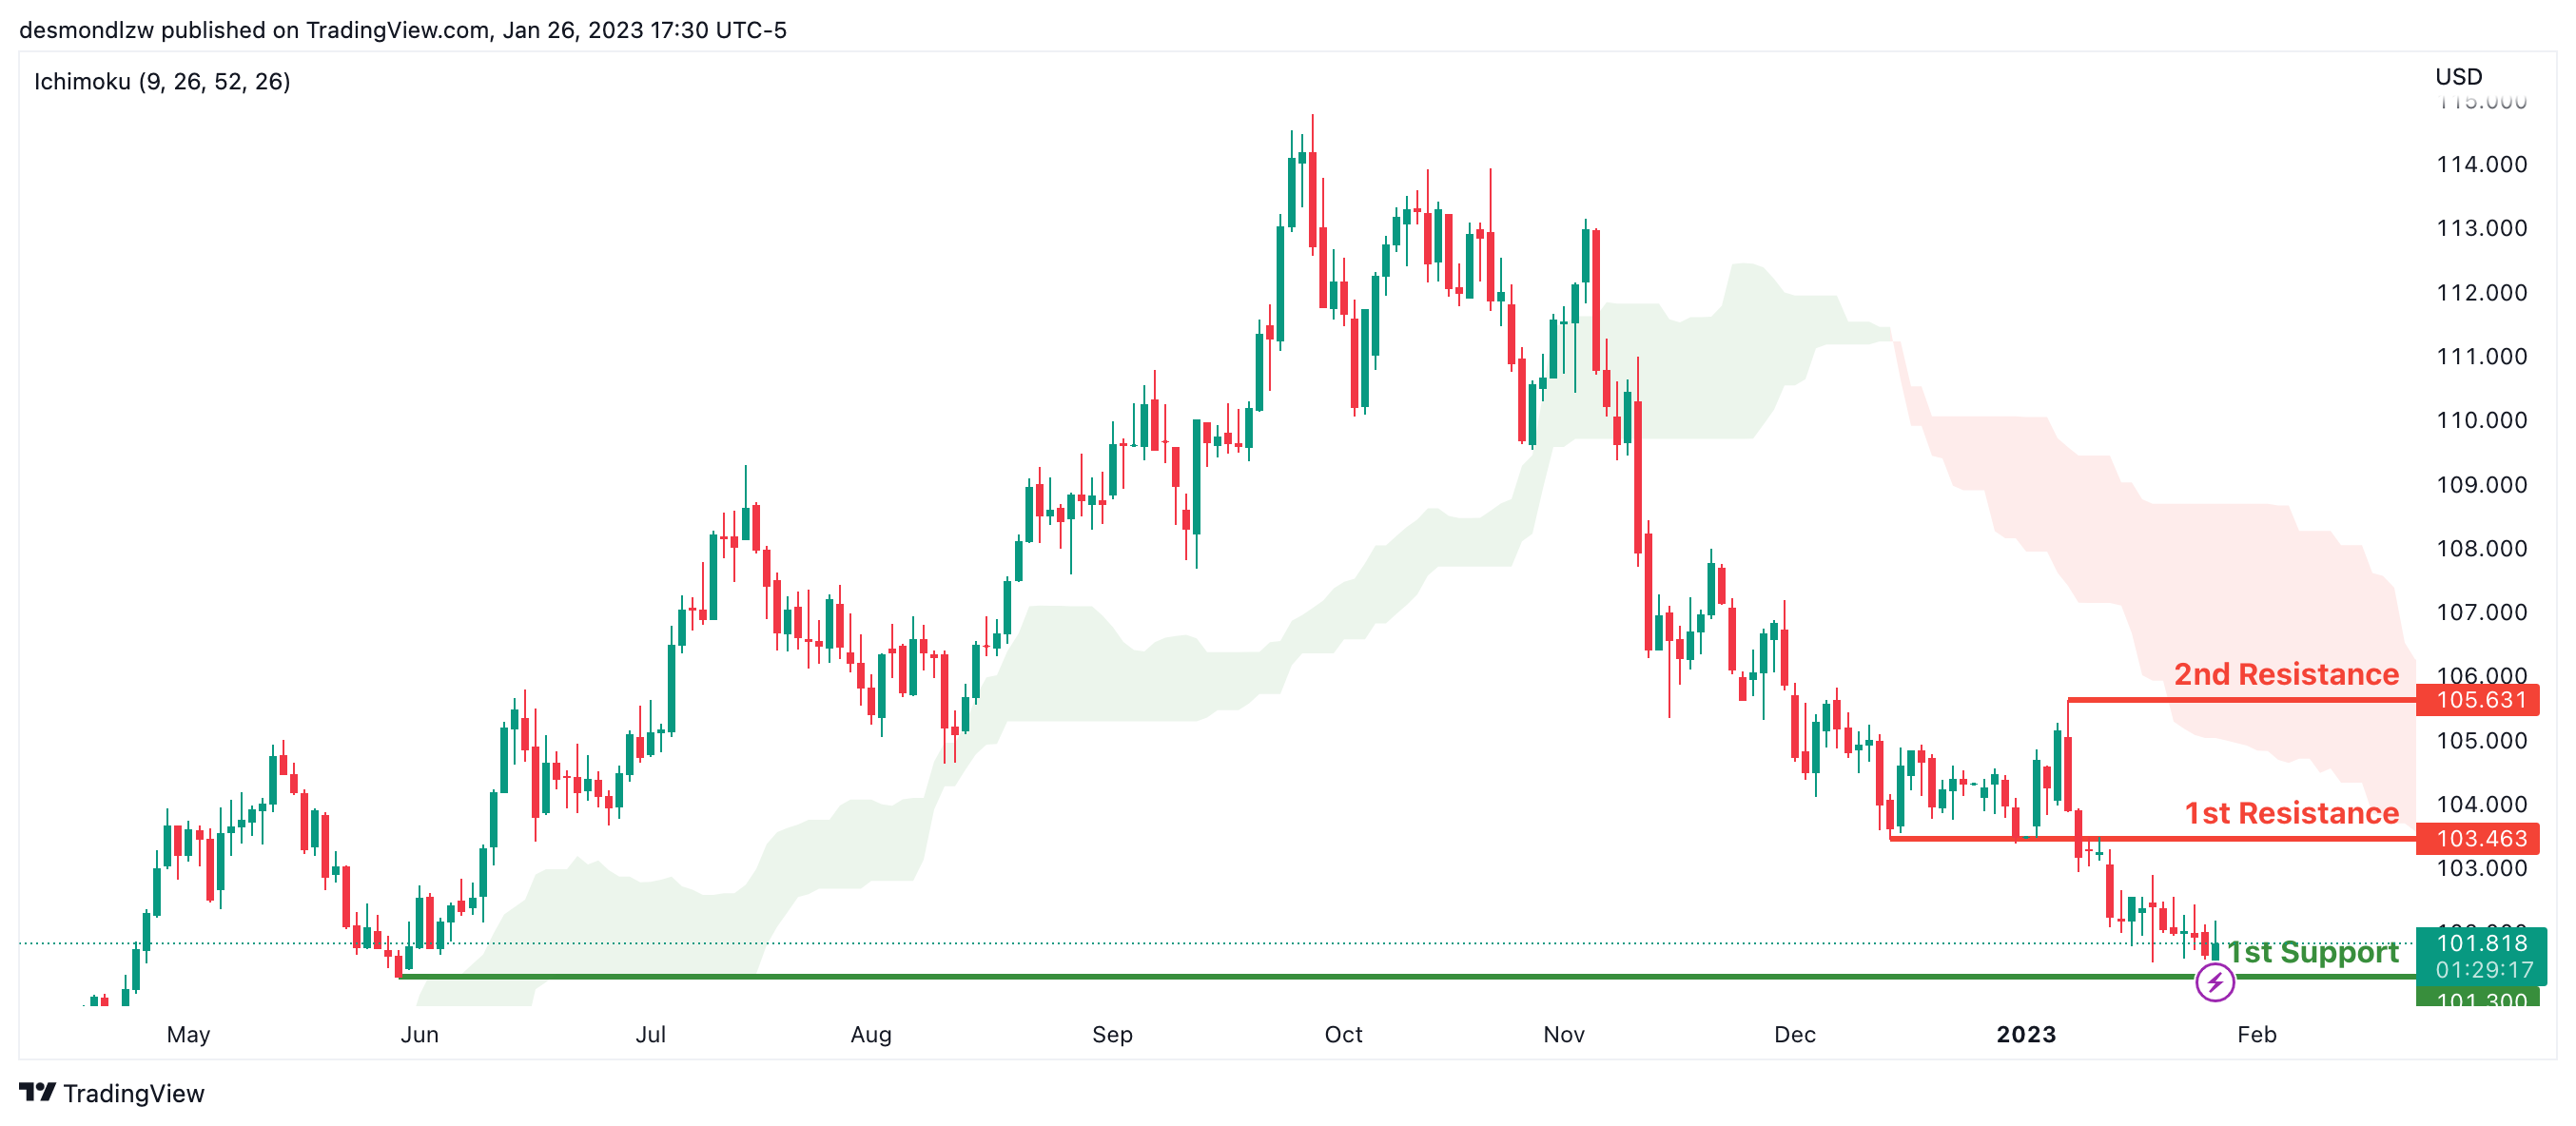
Looking at the Daily chart, my overall bias for DXY is bearish due to the current price being below the Ichimoku cloud, indicating a bearish market. If this bearish momentum continues, expect the price to possibly continue heading towards the 1st support at 101.300, where the previous low is. In an alternative scenario, price could head back up to retest the 1st resistance at 103.463, where the overlap resistance is.
Areas of consideration:
- H4 time frame, 1st resistance at 103.463
- H4 time frame, 1st support at 101.300
EUR/USD:
Looking at the Daily chart, my overall bias for EURUSD is bullish due to the current price being above the Ichimoku cloud, indicating a bullish market structure. To add confluence to this bias, price is also within an ascending channel. If this bullish momentum continues, expect the price to possibly continue heading towards the 1st resistance at 1.09445, where the 50% Fibonacci line is. In an alternate scenario, price could possibly head back down to retest the 1st support level at 1.07120, where the 50% Fibonacci line is.
Areas of consideration :
- H4 1st resistance at 1.09445
- H4 1st support at 1.07120
GBP/USD:
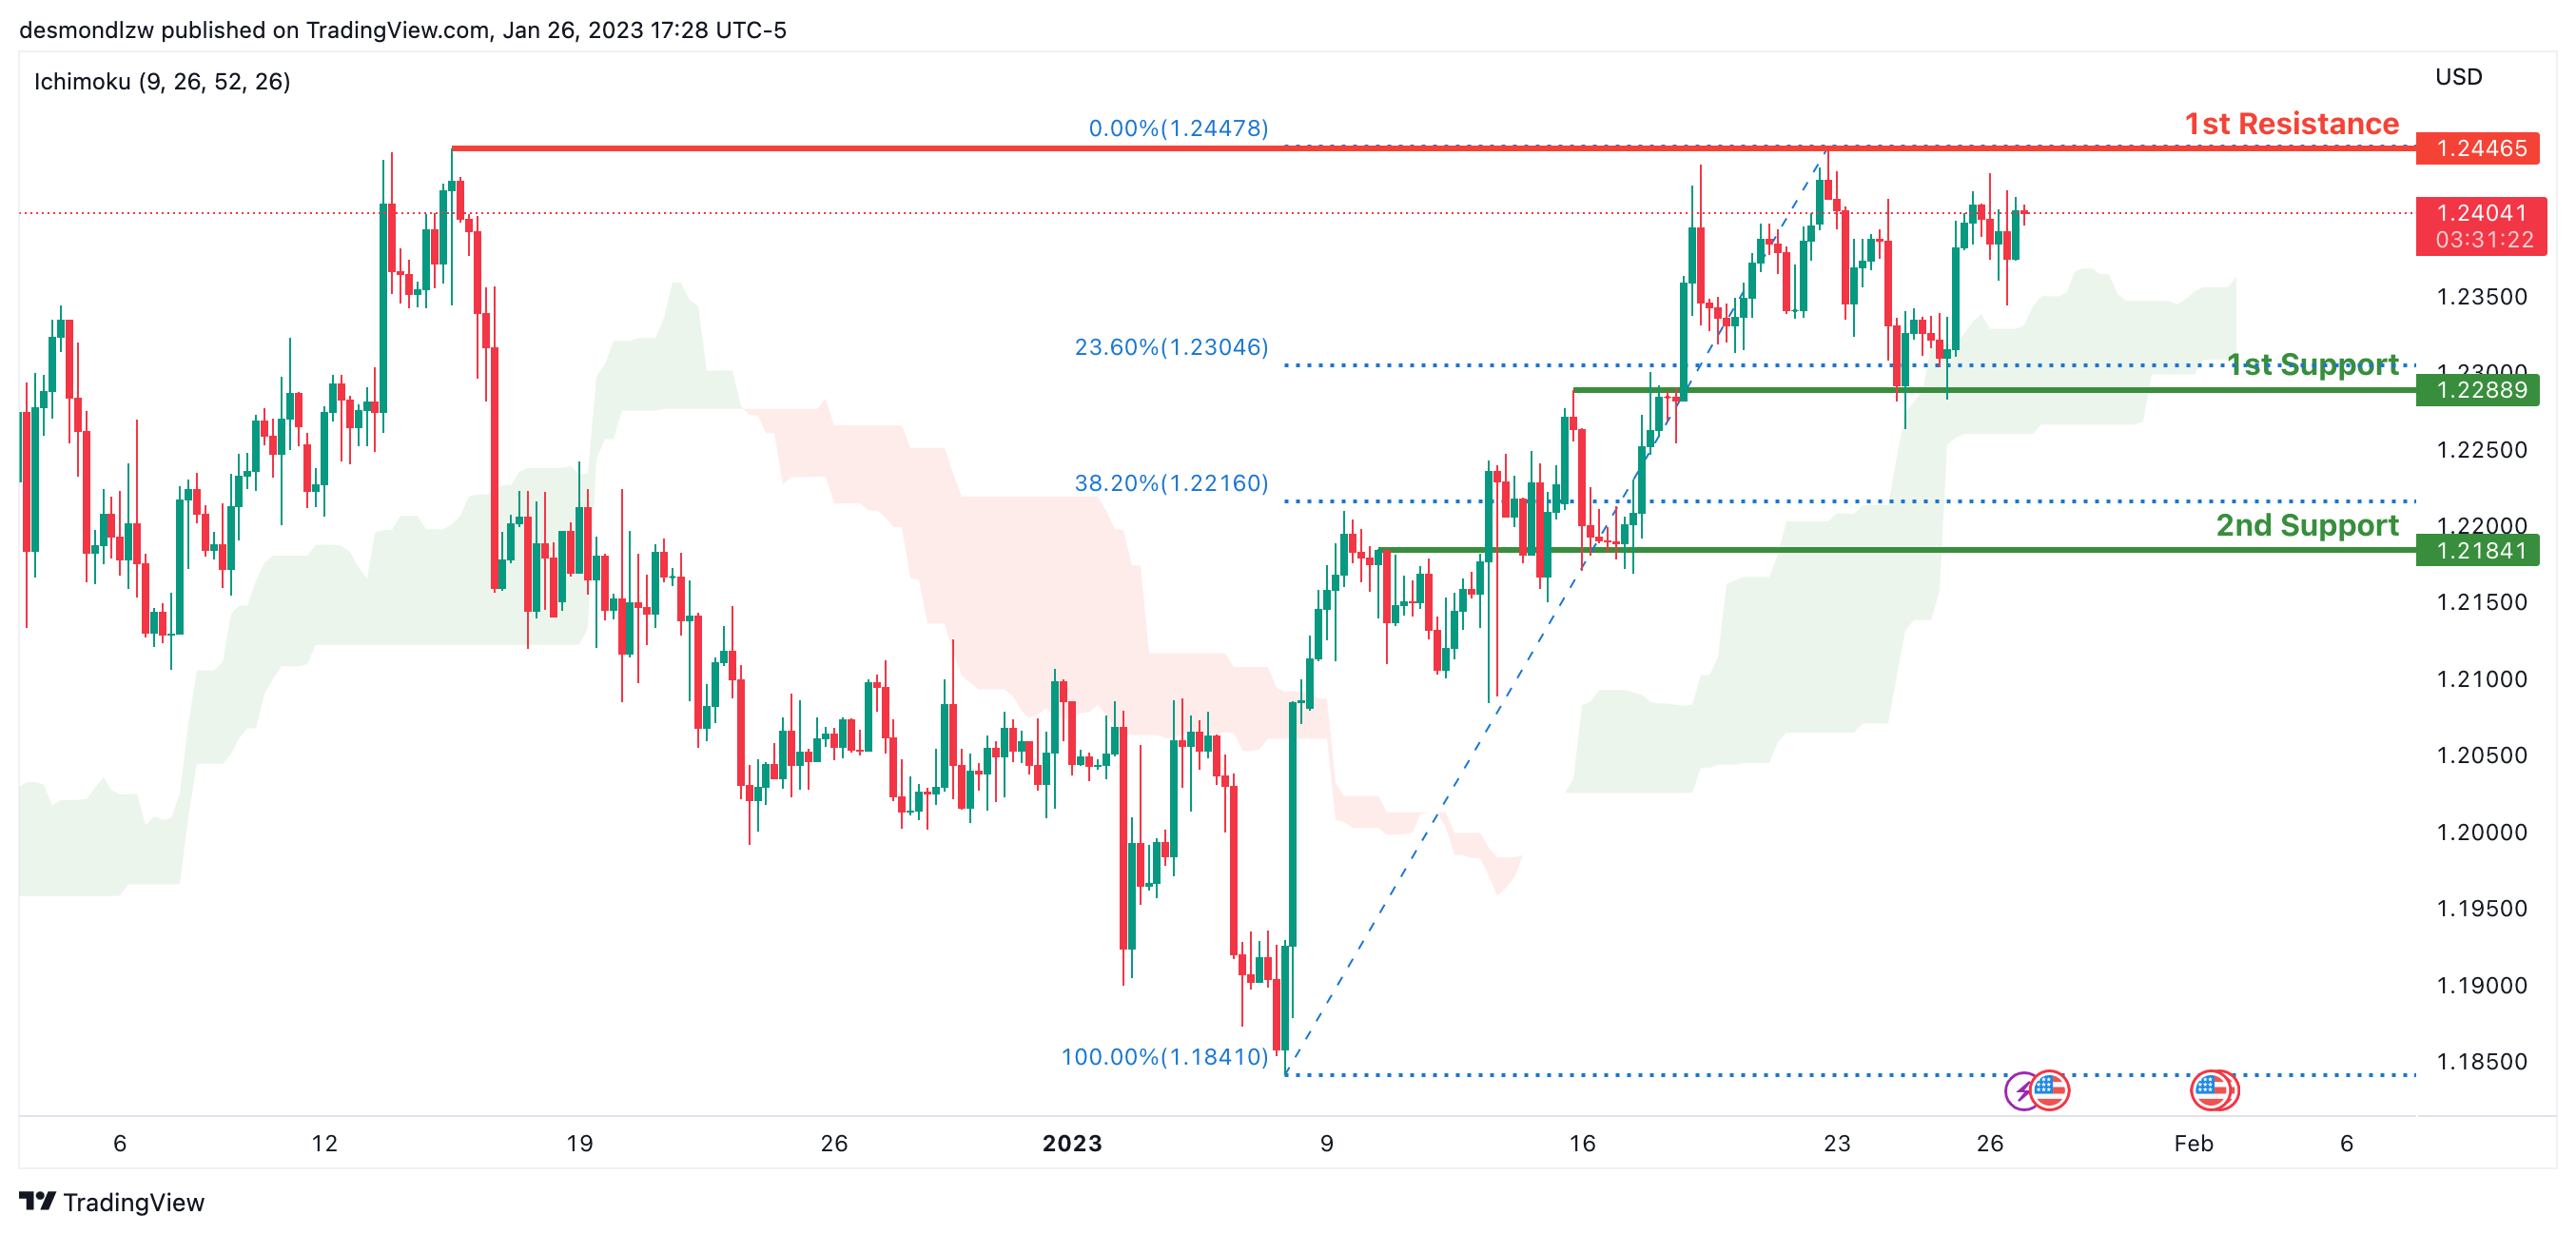
Looking at the H4 chart, my overall bias for GBPUSD is bullish due to the current price being above the Ichimoku cloud, indicating a bullish market. If this bullish momentum continues, expect price to possibly continue heading towards the 1st resistance line at 1.24465, where the previous swing high is. In an alternate scenario, price could possibly head back down and retest the 1st support at 1.22889, where the 23.6% Fibonacci line is.
Areas of consideration:
- H4 1st resistance at 1.24465
- H4 1st support at 1.22889
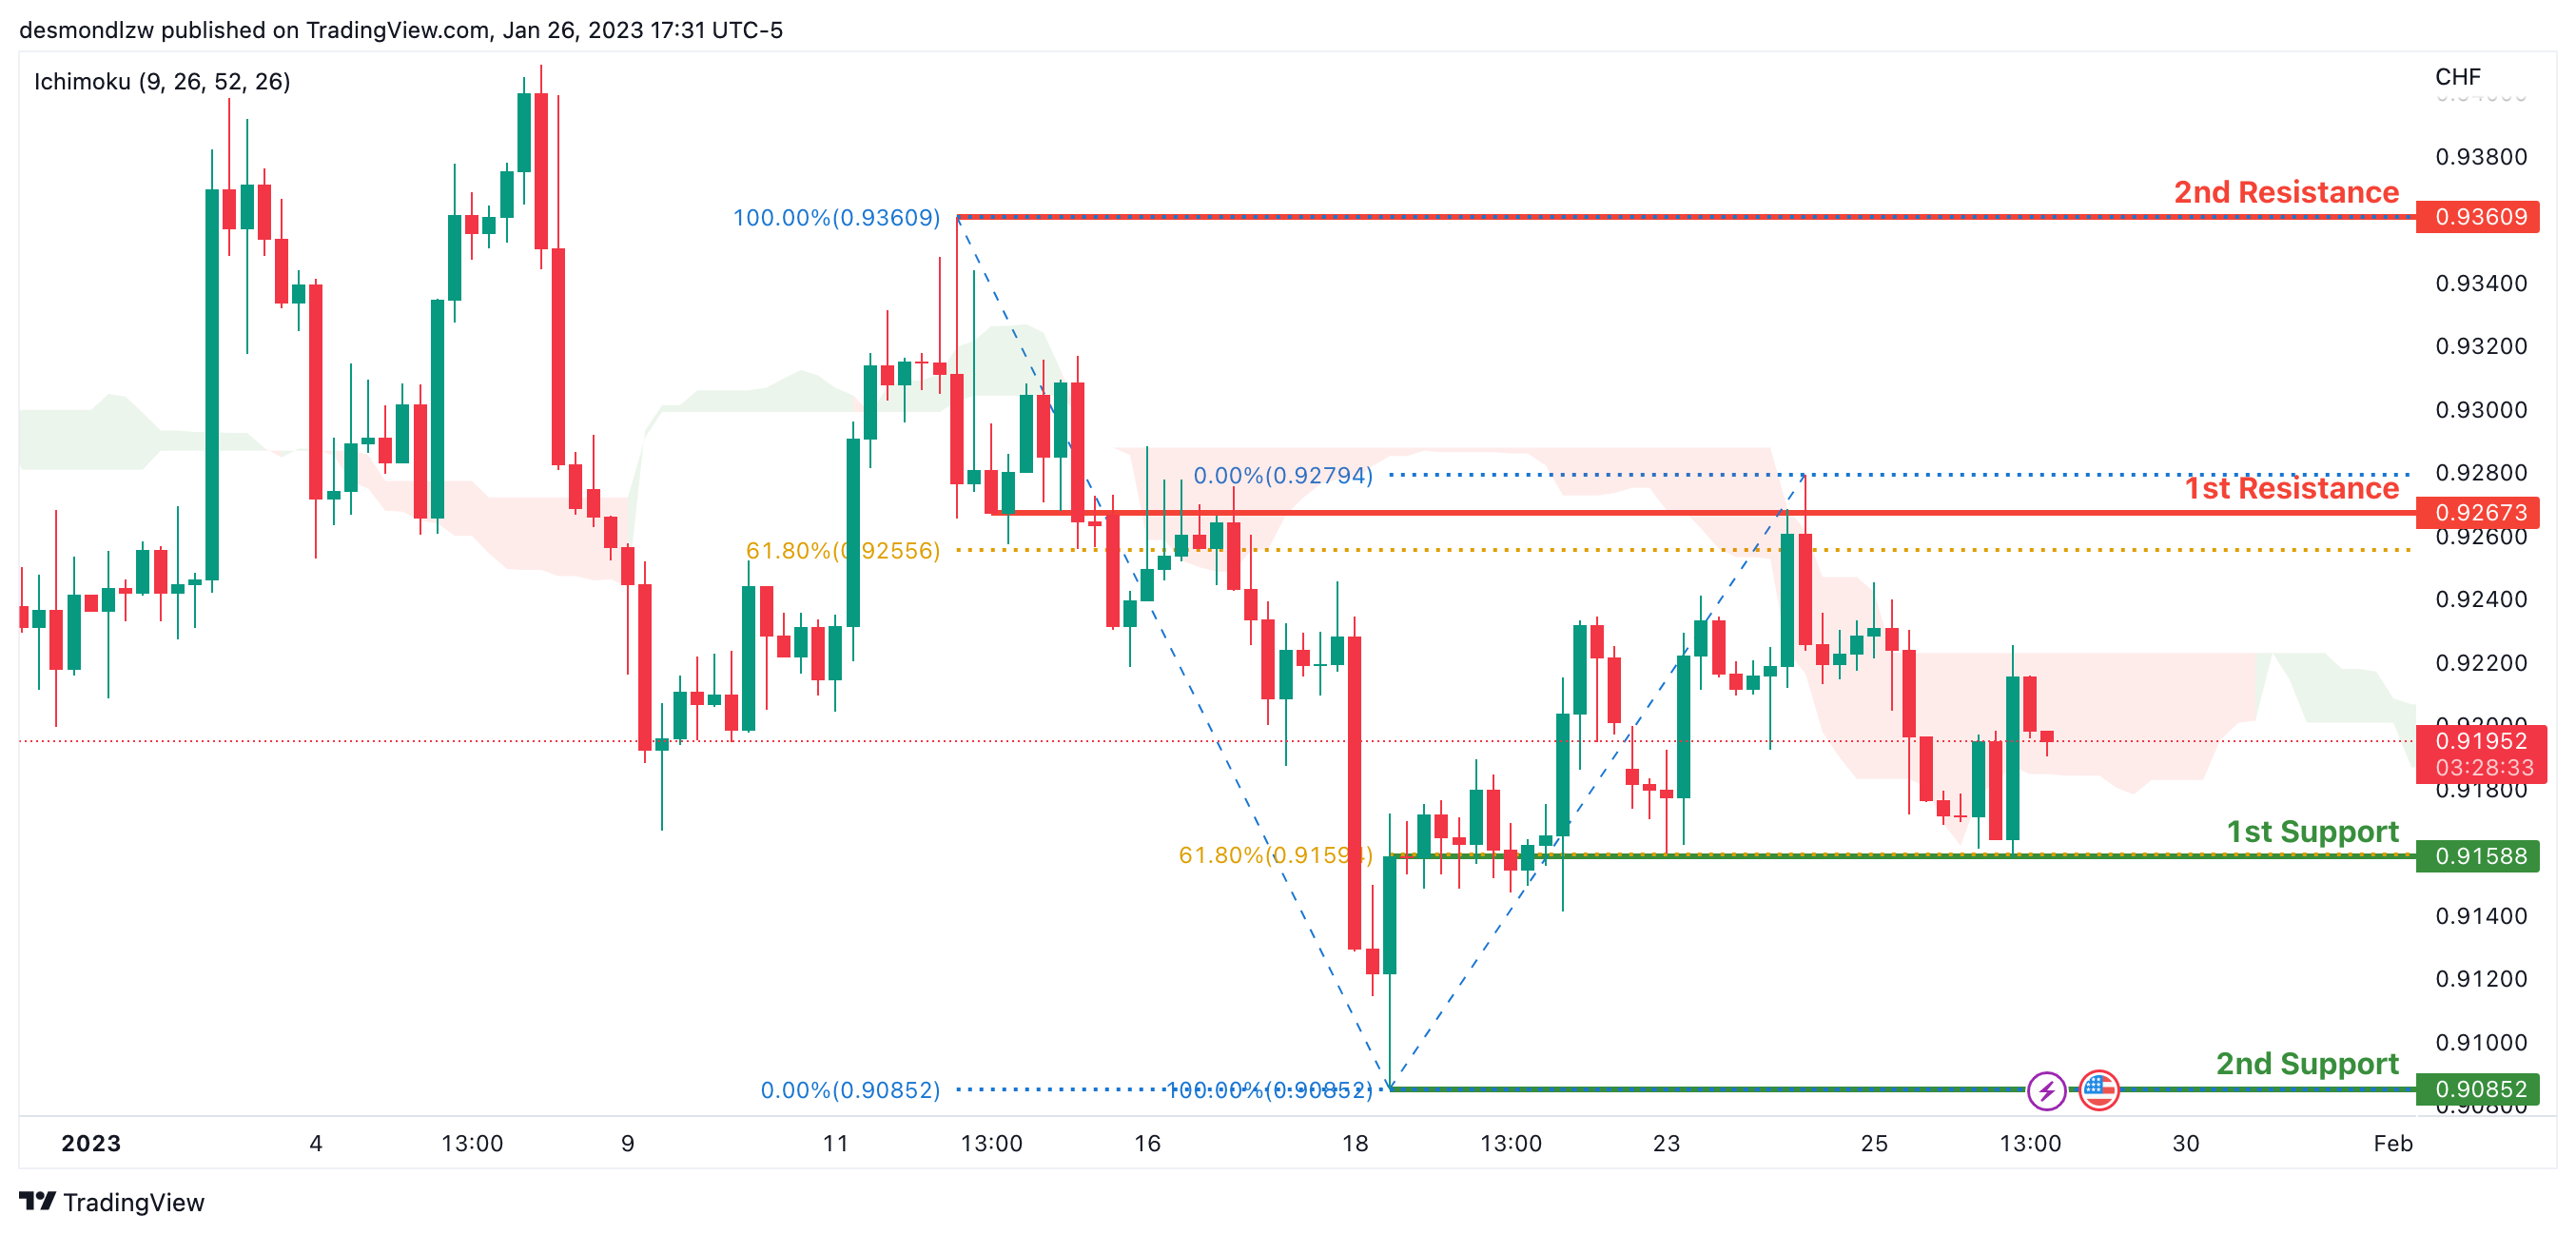
USD/CHF:
Looking at the H4 chart, my overall bias for USDCHF is bearish due to the current price crossing below the Ichimoku cloud, indicating a bearish market. If the current bearish trend continues, expect the price to possibly continue to head towards the 1st support at 0.91588, where the 61.8% Fibonacci line is. In an alternative scenario, price could possibly head back up to retest the 1st resistance at 0.92673, where the 61.8% Fibonacci line is.
Areas of consideration
- H4 1st support at 0.91588
- H4 1st resistance at 0.92673
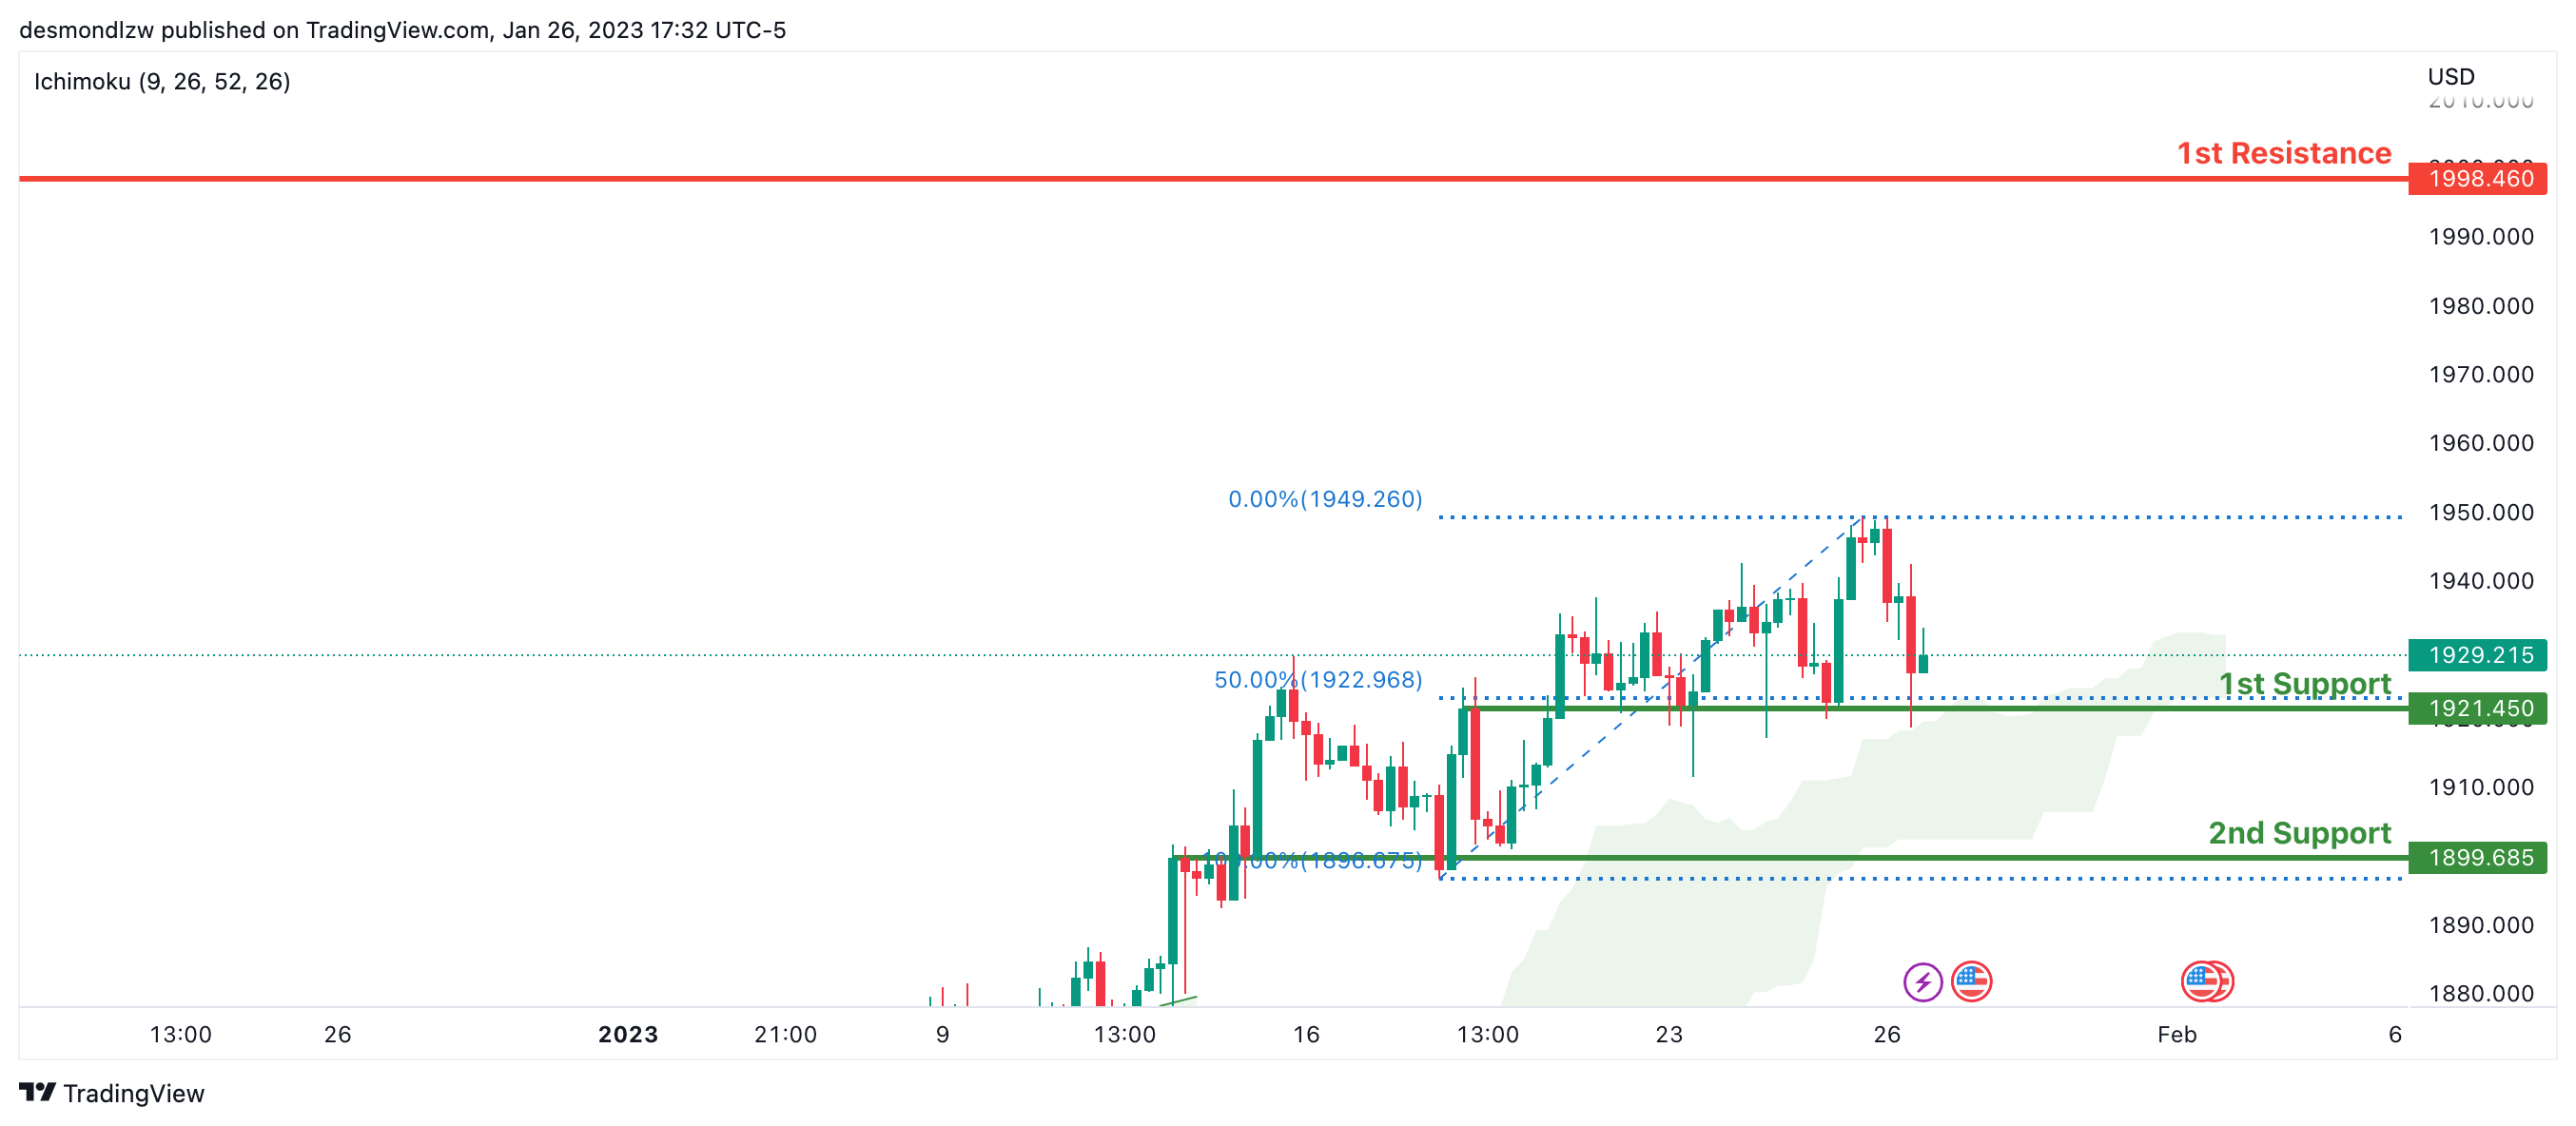
XAU/USD (GOLD):
Looking at the H4 chart, my overall bias for XAUUSD is bullish due to the current price being above the Ichimoku cloud, indicating a bullish market. If this bullish momentum continues, expect the price to possibly continue heading towards the 1st resistance at 1998.460, where the intermediary high is. In an alternative scenario, price could possibly head back down to retest the 1st support at 1921.450 where the 50% Fibonacci line is.
Areas of consideration:
- H4 time frame, 1st resistance at 1998.460
- H4 time frame, 1st support at 1921.450
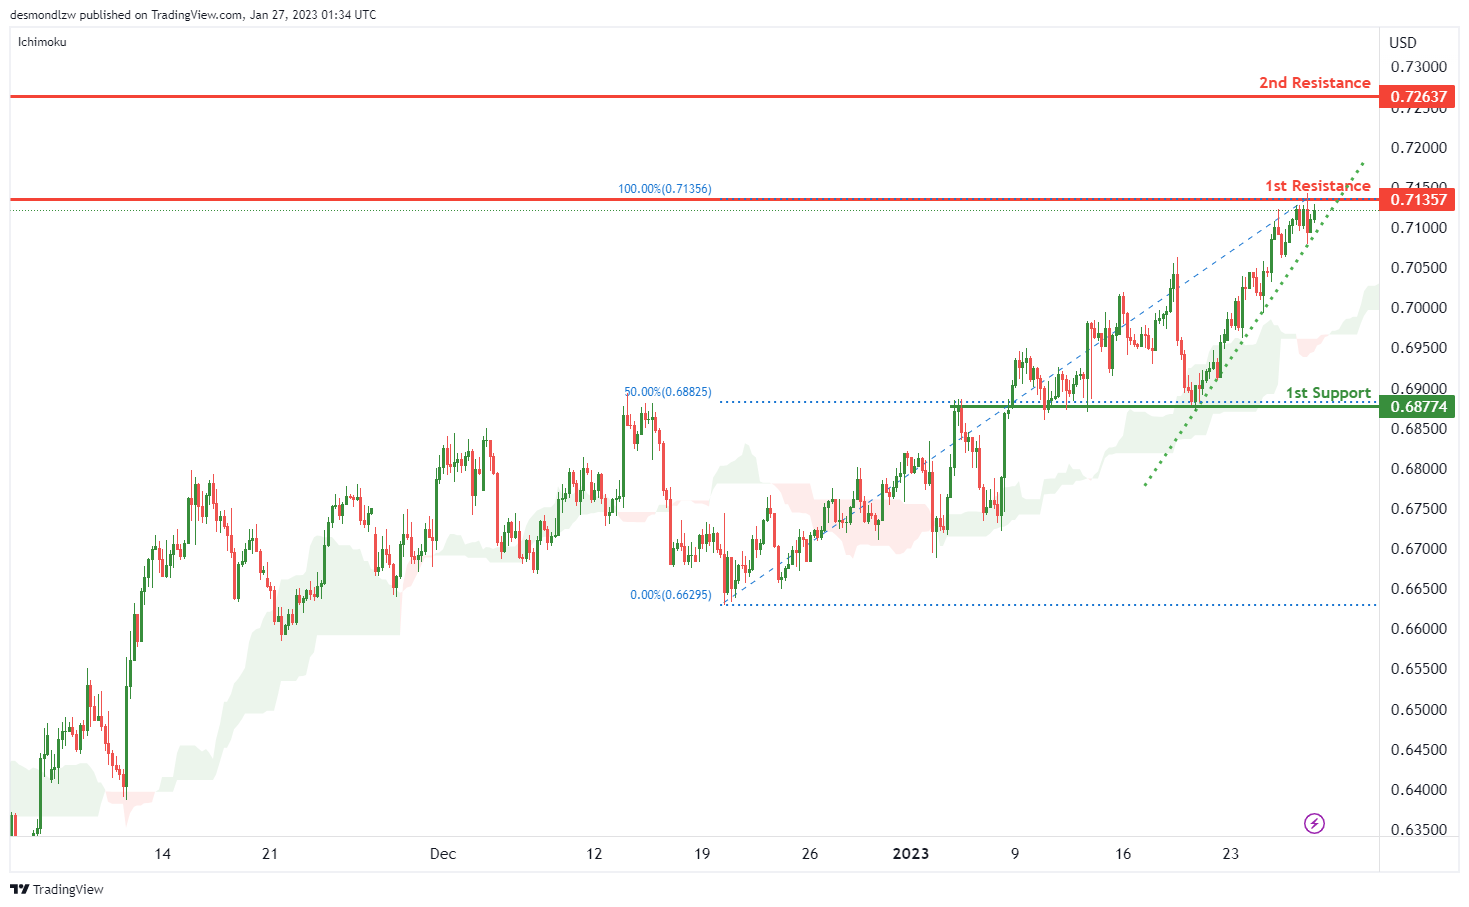
AUD/USD:
Looking at the H4 chart, my overall bias for AUDUSD is bullish due to the current price being above the Ichimoku cloud, indicating a bullish market. To add confluence to this bias, there is an ascending trend line. If this bullish momentum continues, expect price to possibly break through the 1st resistance at 0.71357 and head towards 2nd resistance is at 0.72637.
In an alternate scenario, price could possibly head back down towards the 1st support level at 0.68774, where the 50% Fibonacci line is located.
Areas of consideration
- H4 , 2nd resistance at 0.72637.
- H4. 1st resistance at 0.71357
- H4, 1st support at 0.68774
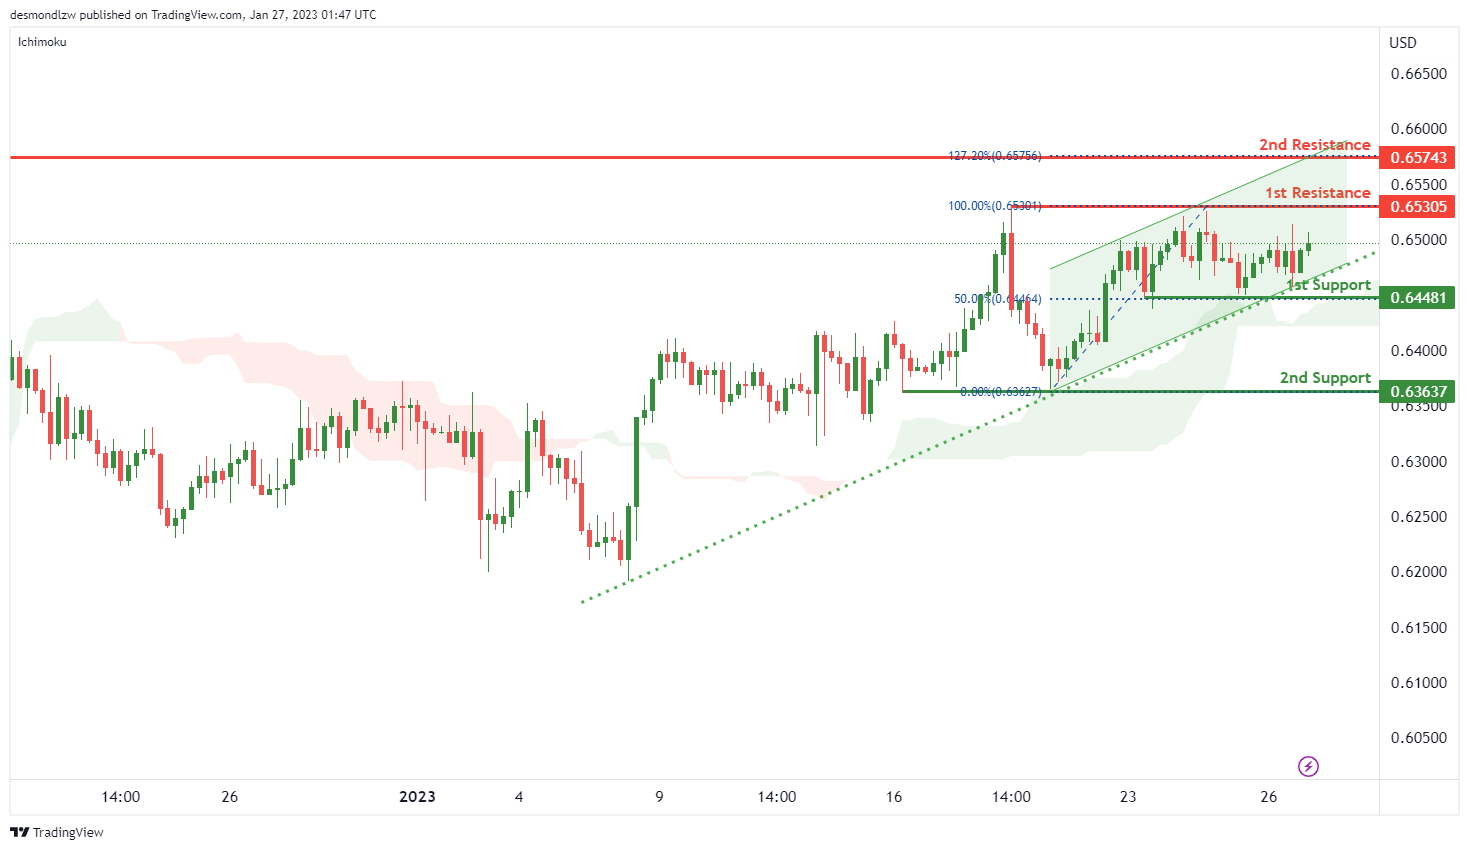
NZD/USD:
Looking at the H4 chart, my overall bias forNZDUSD is bullish due to the current price being above the Ichimoku cloud, indicating a bullish market. To add confluence to this bias, there is an ascending channel. If this bullish momentum continues, expect price to possibly head towards the 1st resistance at 0.65305, and 2nd resistance is at 0.65743, where the 127% Fibonacci line is located.
In an alternate scenario, price could possibly head back down towards the 1st support level at 0.64481, where the 50% Fibonacci line is located. 2nd support is at 0.63637 which is the recent swing low/
Areas of consideration:
- H4 time frame, 2nd resistance at 0.65743
- H4 time frame, 1st resistance at 0.65305
- H4 time frame, 1st support at 0.64481
- H4 time frame, 2nd support at 0.63637
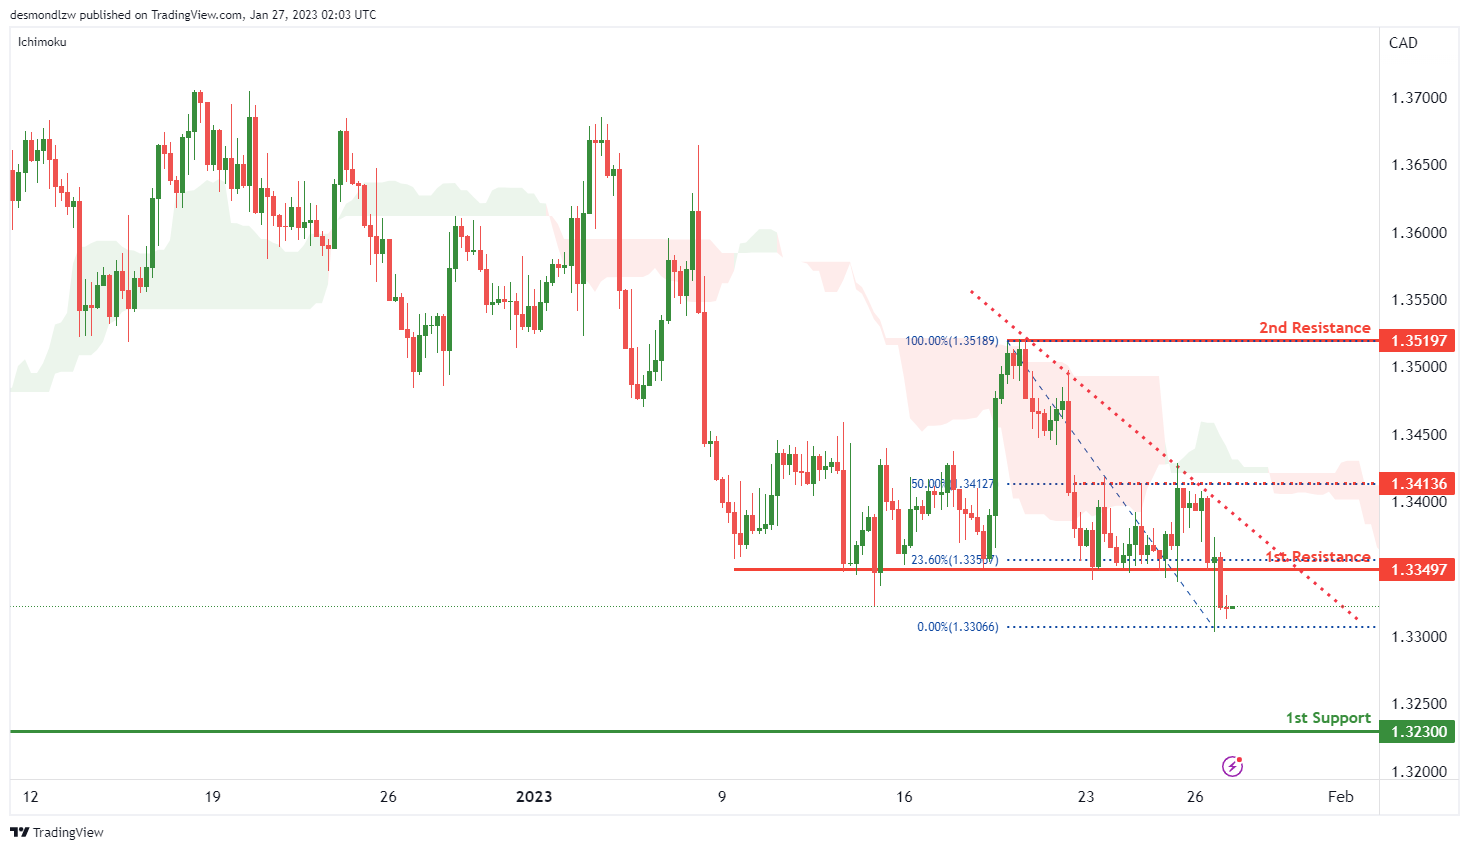
USD/CAD:
Looking at the H4 chart, my overall bias for USDCAD is bearish, due to the current price below the Ichimoku cloud, and there is a descending trend line add confluence to my bias. If this bearish momentum continues, expect the price to possibly continue heading towards the 1st support at 1.32263 which is recent swing low.
In an alternative scenario, price could possibly head up to the 1st resistance at 1.33497 which is in line with 23,6% Fibonacci line. The 2nd resistance is at 1.34802. There is an intermediate resistance at 1.34136 which is inl ine with 50% Fibonacci line.
Areas of consideration:
- H4 time frame, 2nd resistance at 1.34802
- H4 time frame, intermediate resistance at 1.34136
- H4 time frame, 1st resistance at 1.33497
- H4 time frame, 1st support at 1.32263
- H4 time frame, 2nd support at 1.33138
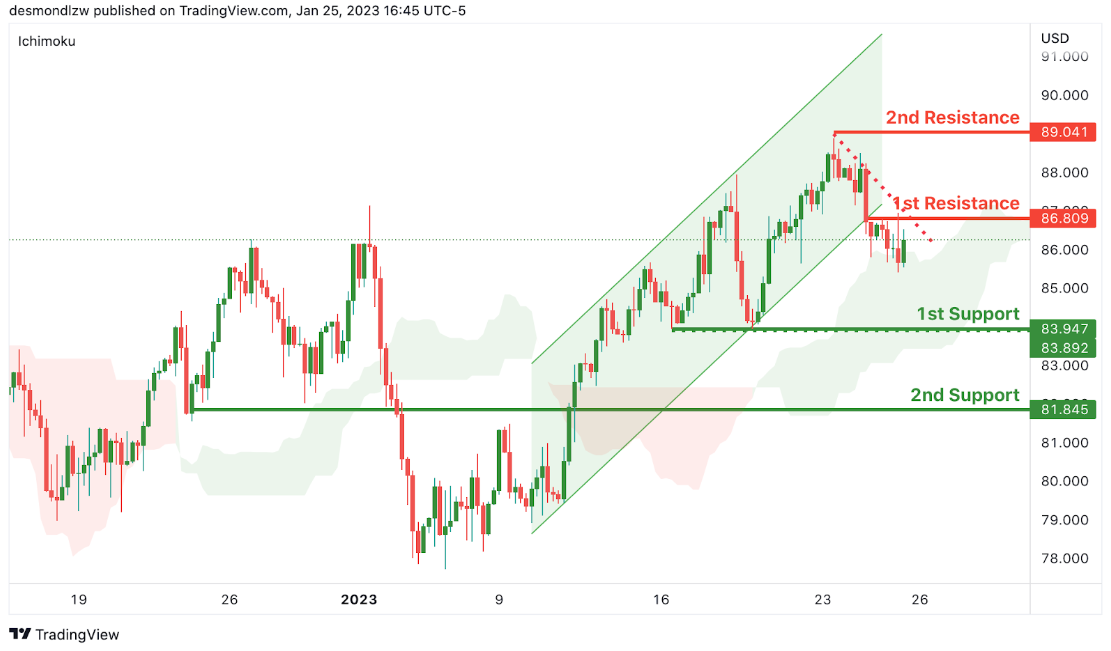
OIL:
Looking at the H4 chart, my overall bias for BOC is bullish due to the current price being above the Ichimoku cloud, indicating a bullish market. To add confluence to this bias, there is an ascending trend line. If this bullish momentum continues, expect price to possibly head towards the 1st resistance at 88.885, where is the recent swing high. 2nd resistance is at 89.727.
In an alternate scenario, price could possibly head back down towards the 1st support level at 83.936, where the 50% Fibonacci line is located.
Areas of consideration:
- H4 time frame, 2nd resistance at 89.727.
- H4 time frame, 1st resistance at 88.885
- H4 time frame,1st support at 83.936,
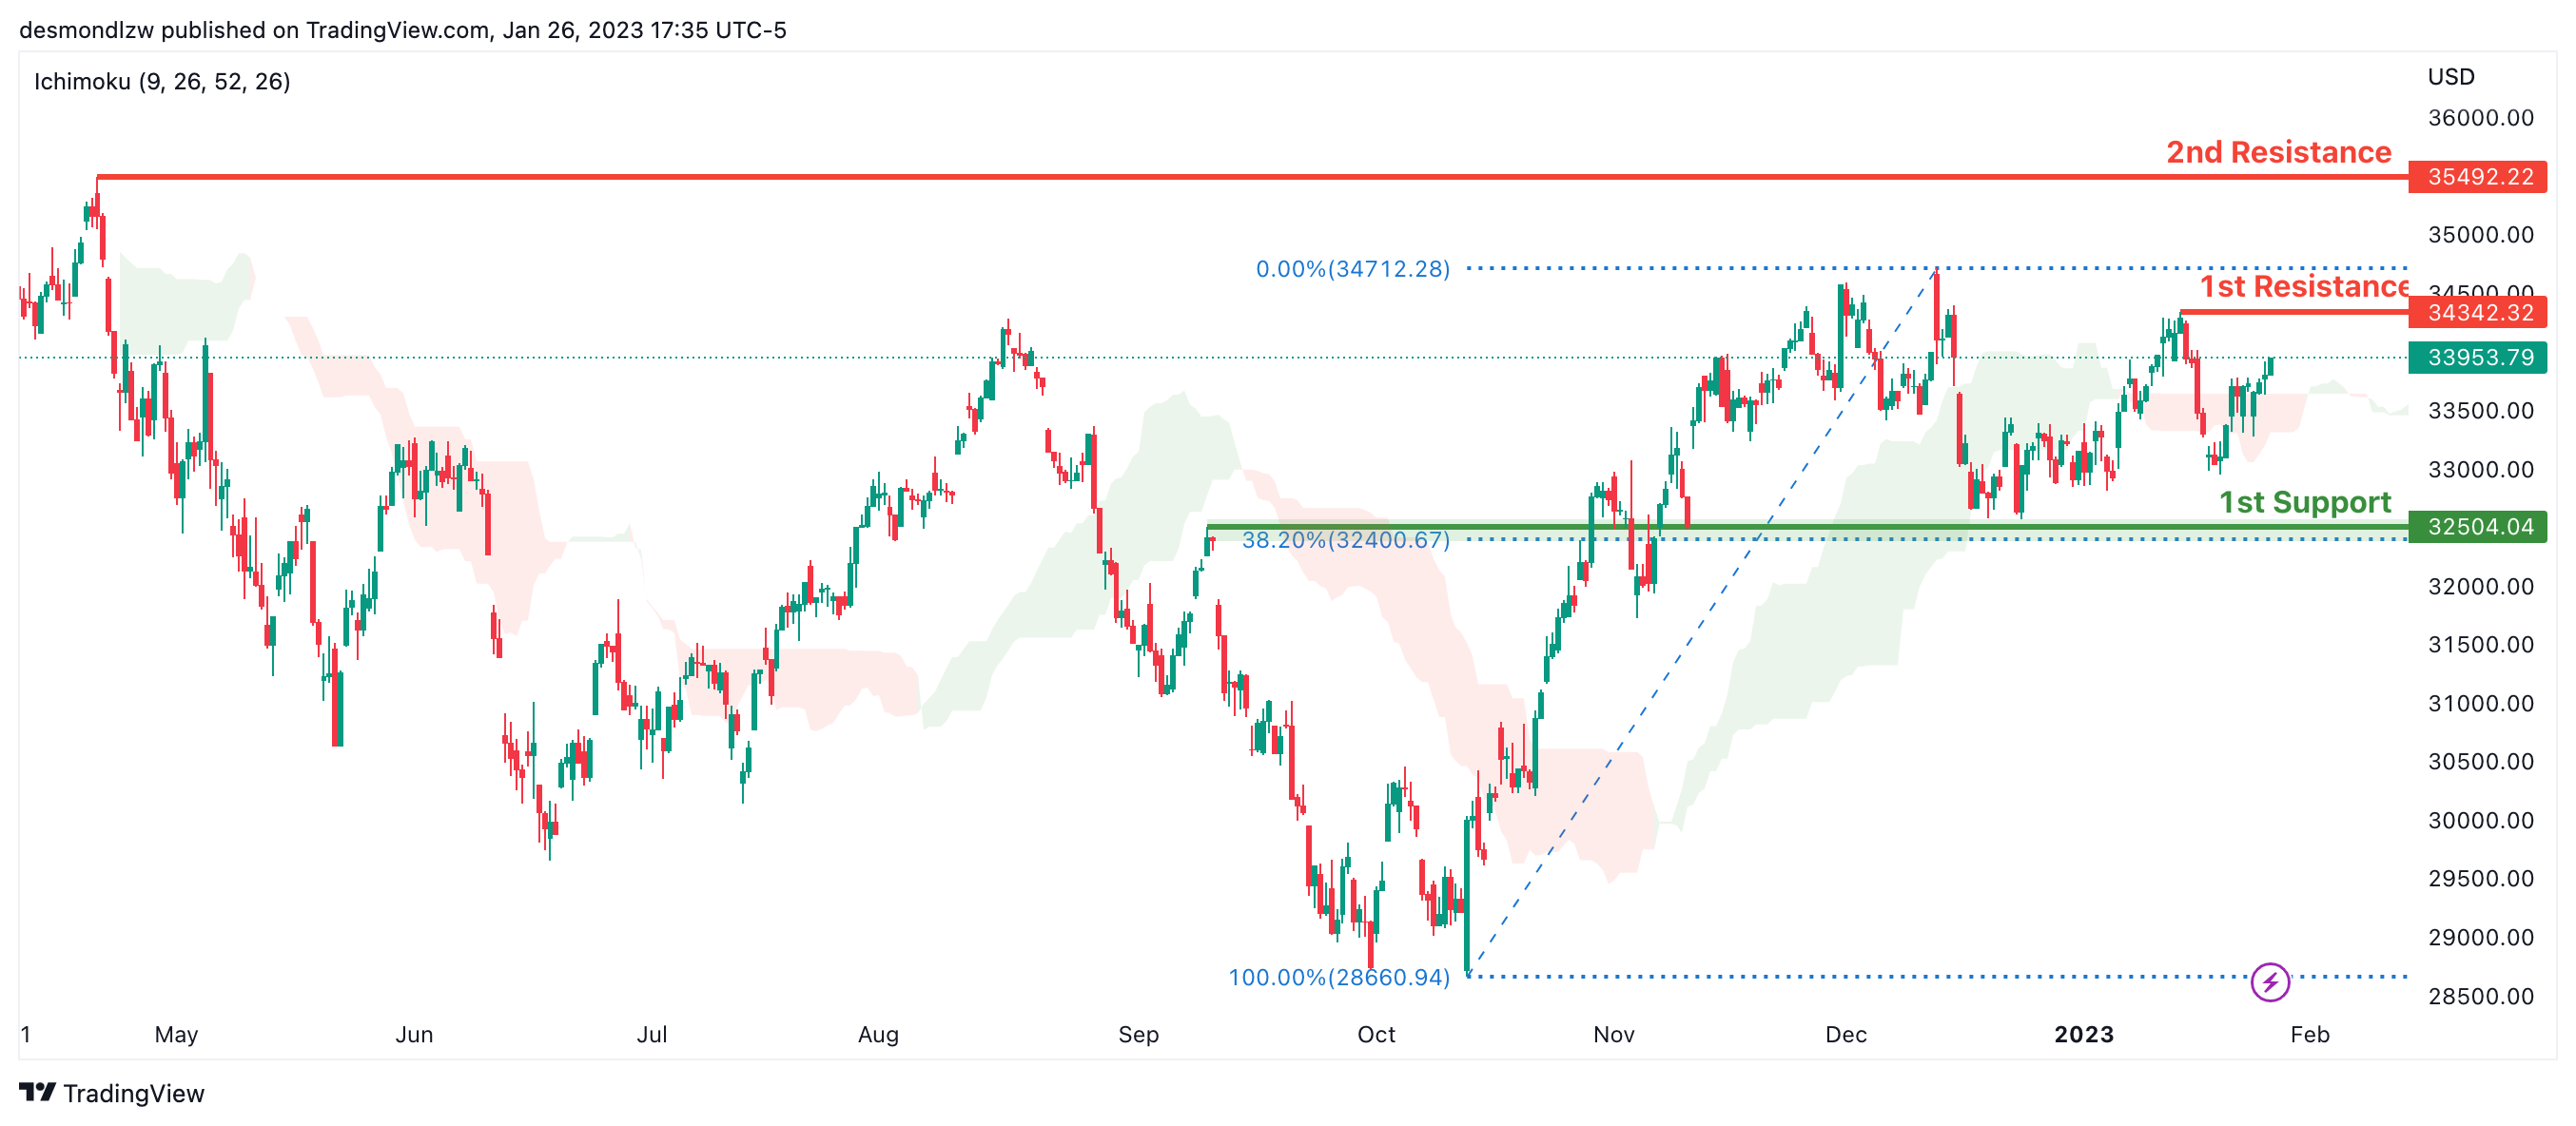
Dow Jones Industrial Average:
On the H4 chart, the overall bias for DJI is bullish. To add confluence to this, the price is crossing above the Ichimoku cloud which indicates a bullish market. If this bullish momentum continues, expect the price to possibly continue heading towards the 1st resistance line at 34342.32, where the recent swing high is. In an alternative scenario, price could possibly head back down towards the 1st support at 32581.97, slightly above where the 38.2% Fibonacci line is.
Areas of consideration:
- H4 time frame, 1st support at 32581.97
- H4 time frame, 1st Resistance at 34342.32
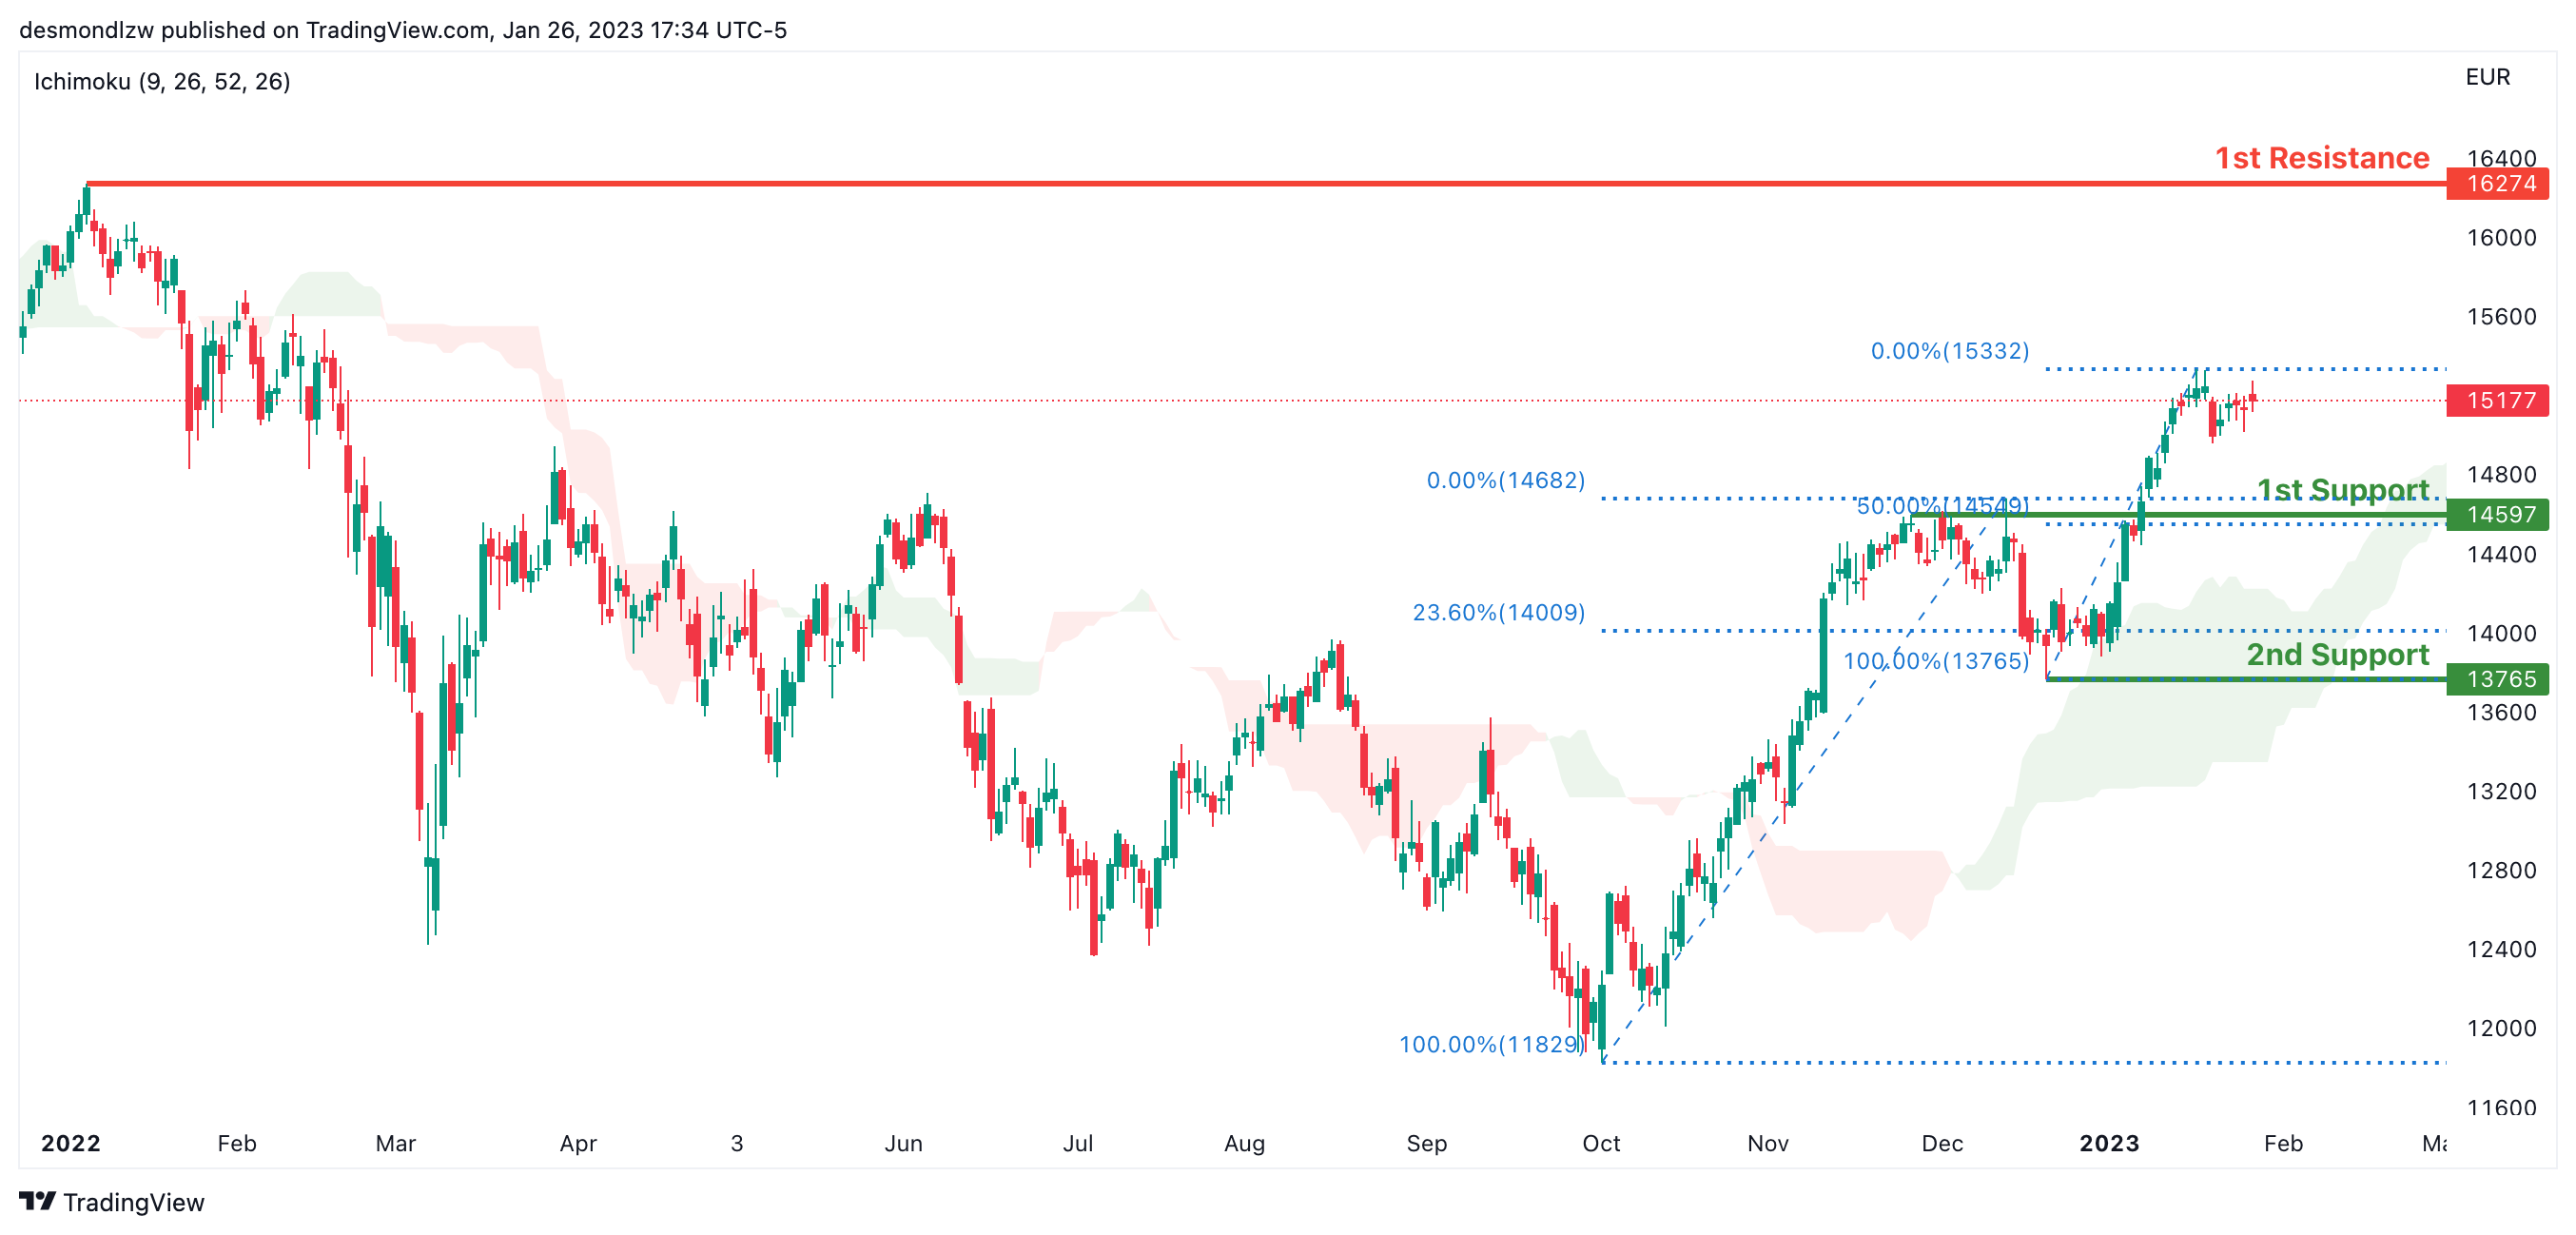
DAX:
Looking at the Daily chart, my overall bias for DAX is bullish due to the current price crossing above the Ichimoku cloud, indicating a bullish market. If this bullish momentum continues, expect the price to possibly head towards the 1st resistance line at 16274, where the previous swing high is. In an alternative scenario, price could possibly head down to retest the 1st support at 14597, where the 50% Fibonacci line is.
Areas of consideration:
- H4 time frame, 1st resistance is at 16274
- H4 time frame, 1st support is at 14597
ETHUSD:
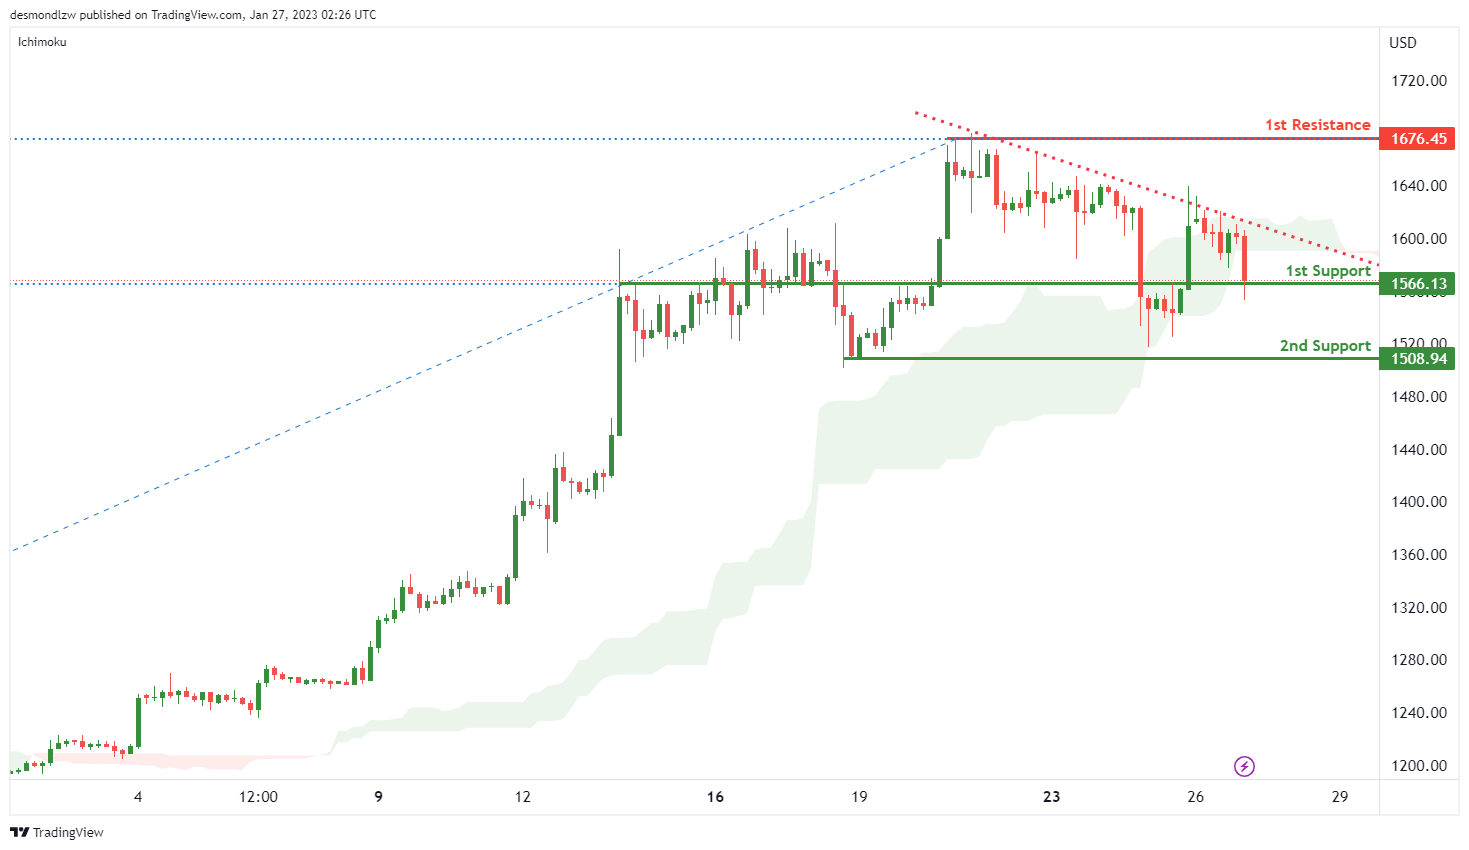
Looking at the H4 chart, my overall bias for ETHUSD is bearish, as the current price is below the Ichimoku cloud and a descending trend line add confluence to my bias. The price may break the 1st support at 1566.13 and head towards the 2nd support at 1508.94 which is the recent swing low.
In an alternative scenario, the price may up to the 1st resistance at 1676.45 which is the recent swing high .
Areas of consideration:
- H4 time frame, 1st resistance of 1676.45
- H4 time frame, 1st support at 1566.13
- H4 time frame, 2nd support at 1508.94

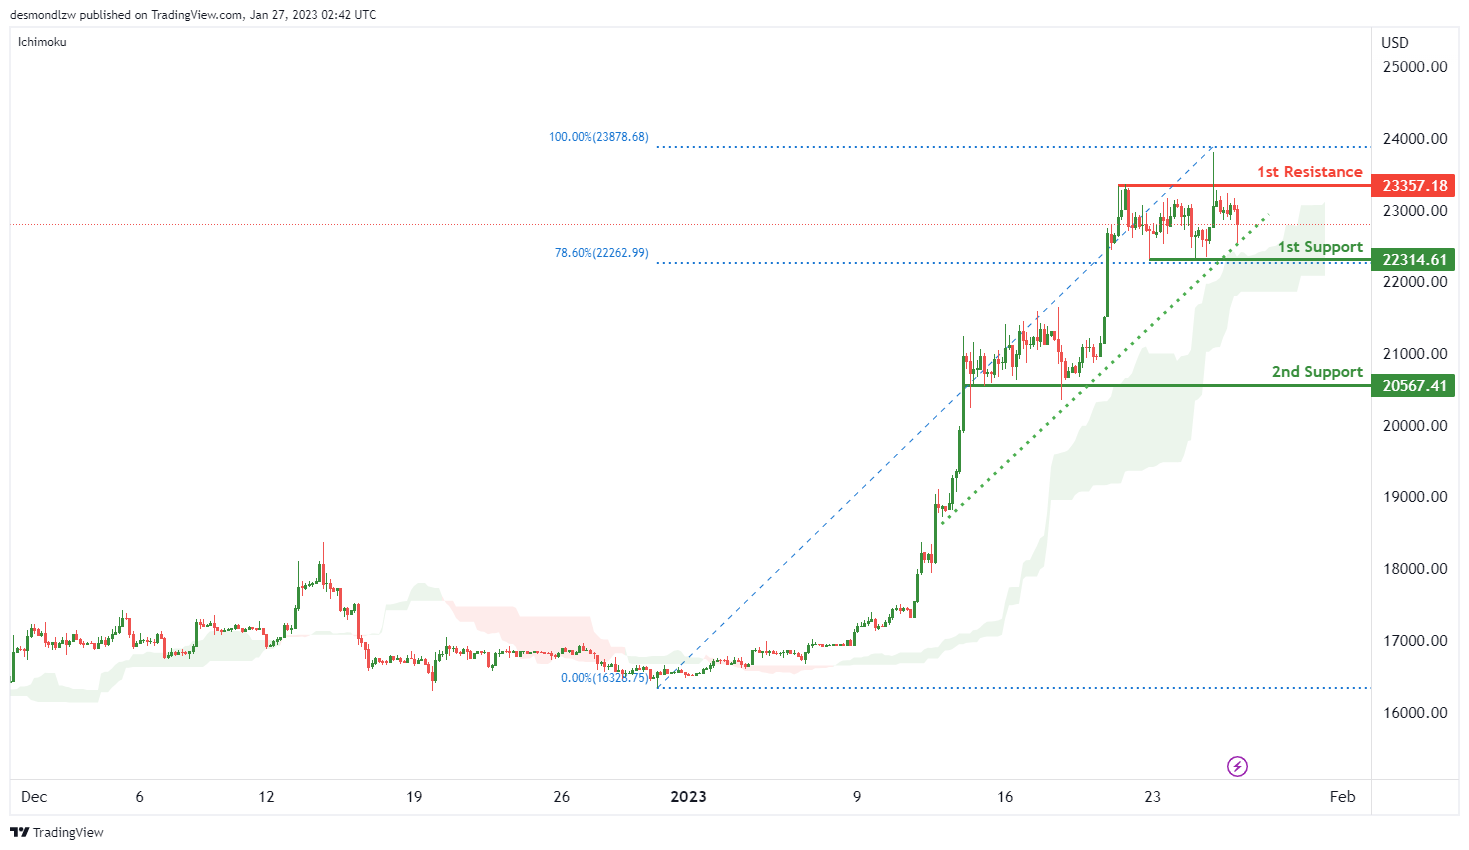
BTCUSD:
Looking at the H4 chart, my overall bias for BTCUSD is bullish due to the current price being above the Ichimoku cloud, and there is an ascending channel, indicating a bullish market. If this bullish momentum continues, expect the price to possibly rise to the 1st resistance at 23357.18 which is the overlap resistance.
In an alternative scenario, the price could possibly head back down to retest at the 1st support at 22314.61 which is in line with 78.6% Fibonacci line. . 2nd support is at 20567.41 which is the recent swing low.
Areas of consideration:
- H4 time frame, 1st resistance 23357.18
- H4 time frame, 1st support at 22314.61
- H4 time frame, 2nd support a 20567.41
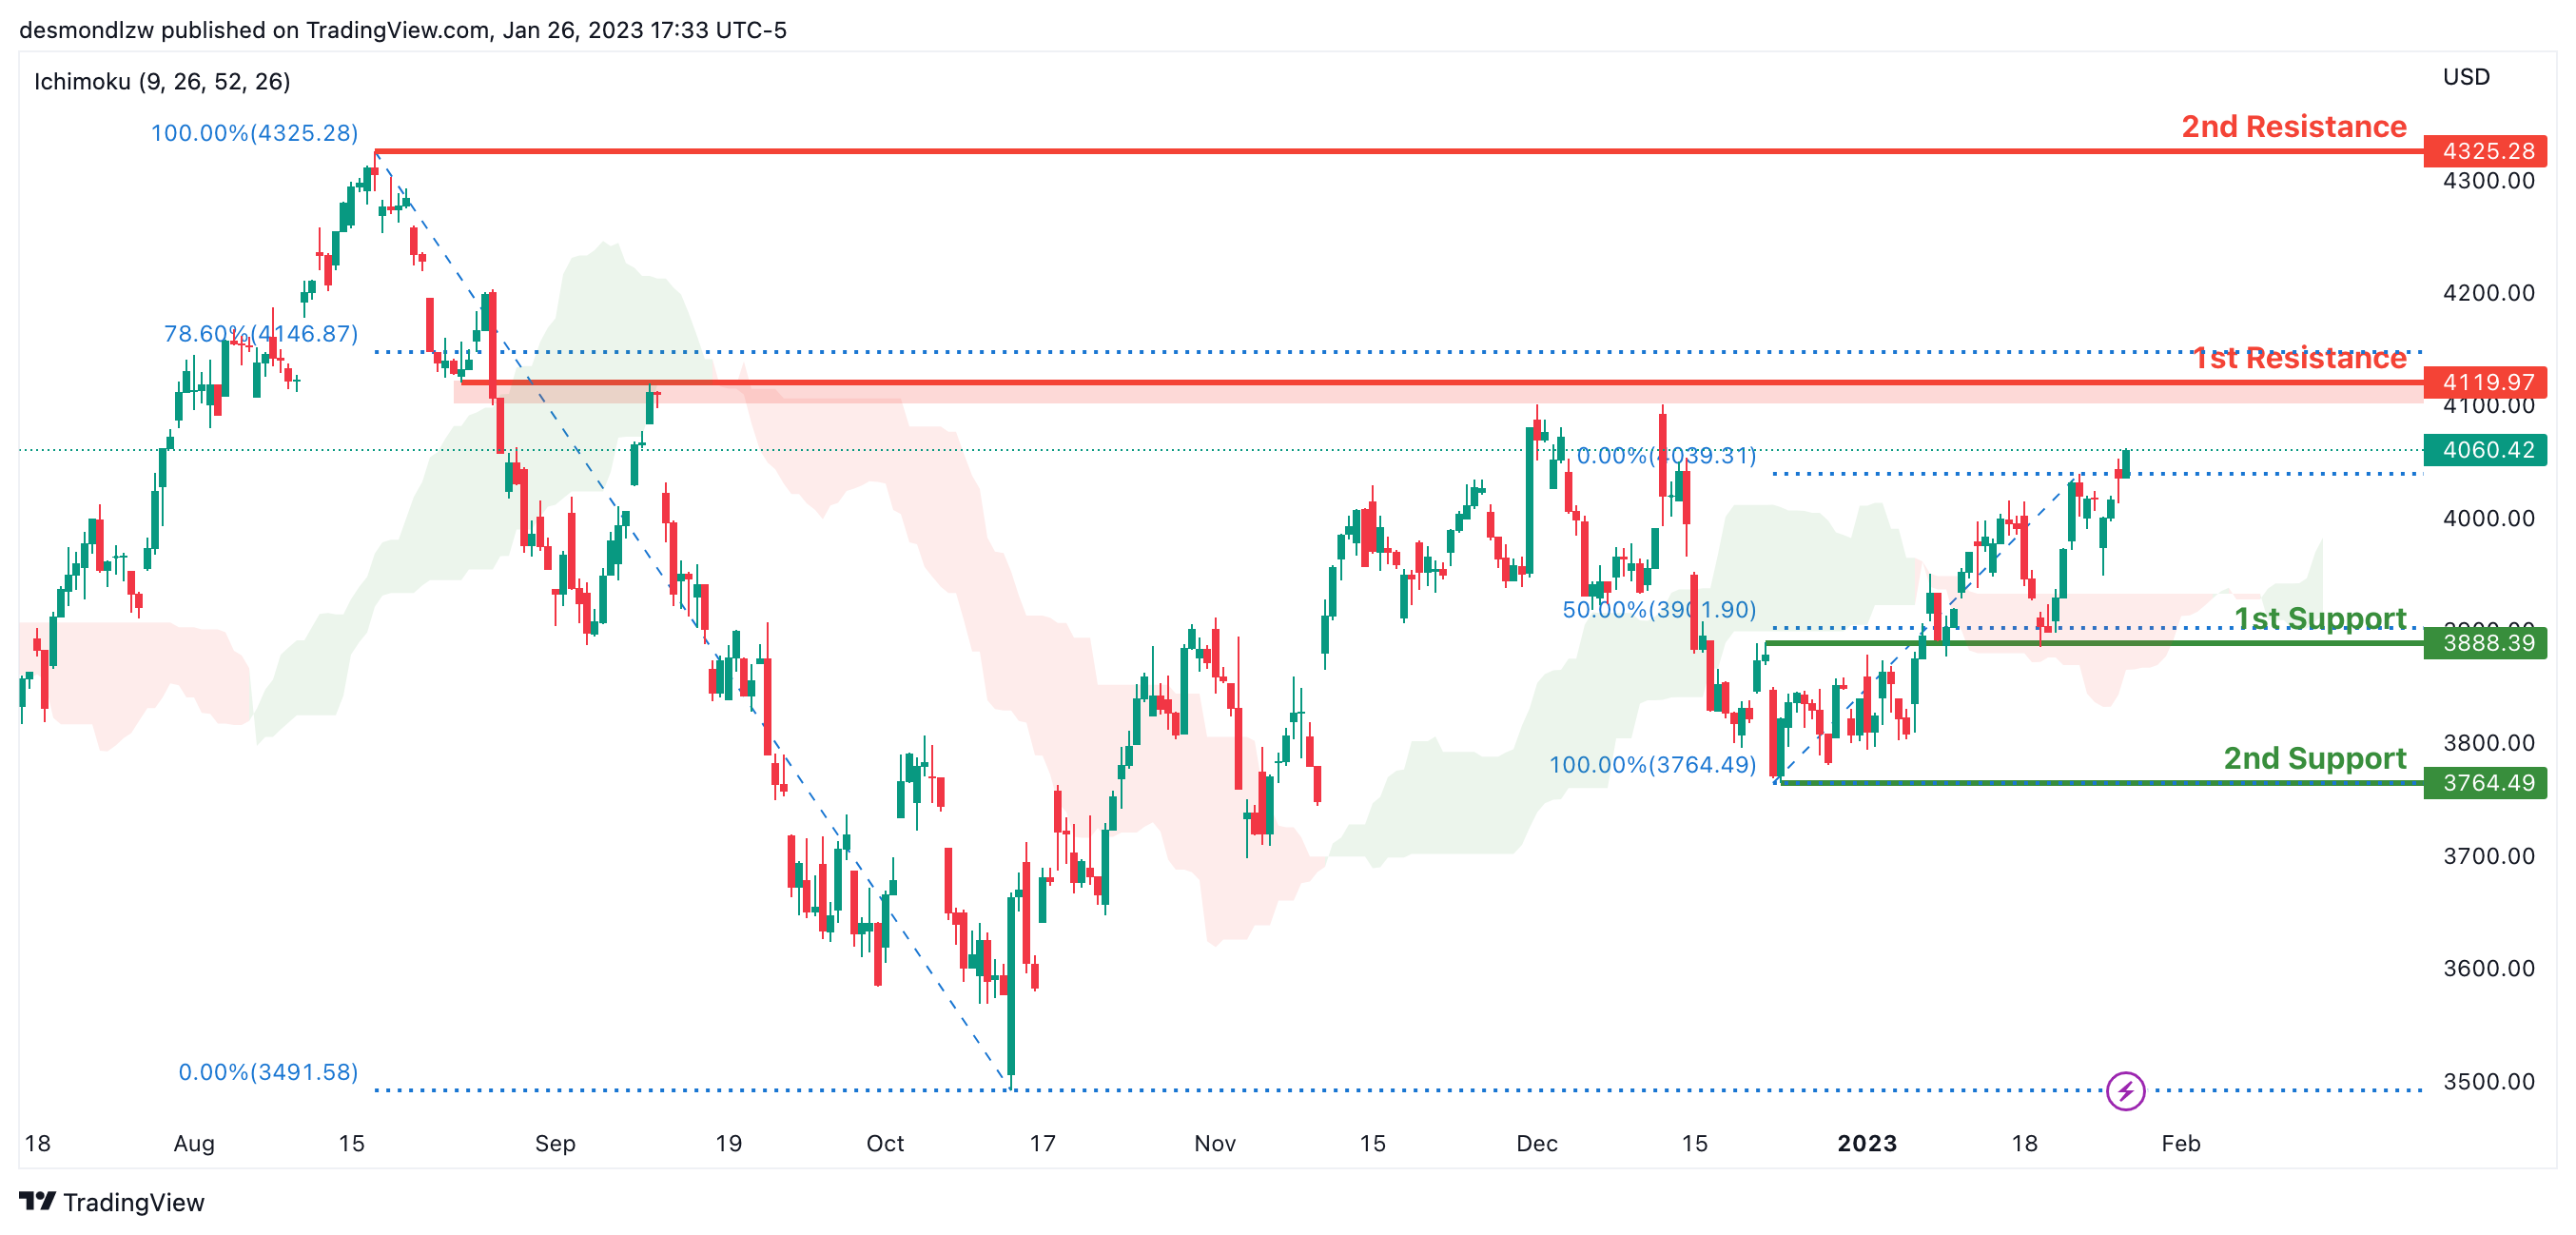
S&P 500:
Looking at the H4 chart, my overall bias for S&P500 is bullish due to the current price being above the Ichimoku cloud, indicating a bullish market. If this bullish momentum continues, expect the price to continue heading towards the 1st resistance at 4119.97, where the 78.6% Fibonacci line is. In an alternative scenario, price could possibly head back down to break the 1st support at 3888.39, where the 50% Fibonacci line is, before heading towards the 2nd support at 3764.49, where the recent swing low is.
Areas of consideration:
- H4 time frame, 1st support at 3888.39
- H4 time frame, 2nd support at 3764.49
- H4 time frame, 1st resistance at 4119.97


